|
|
|
|||
|
||||

|
|
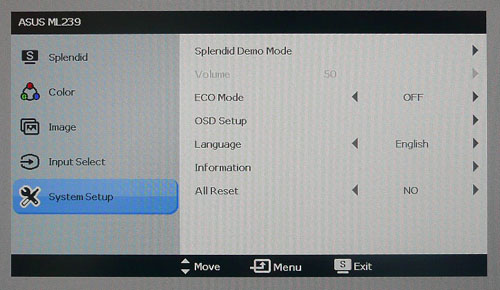
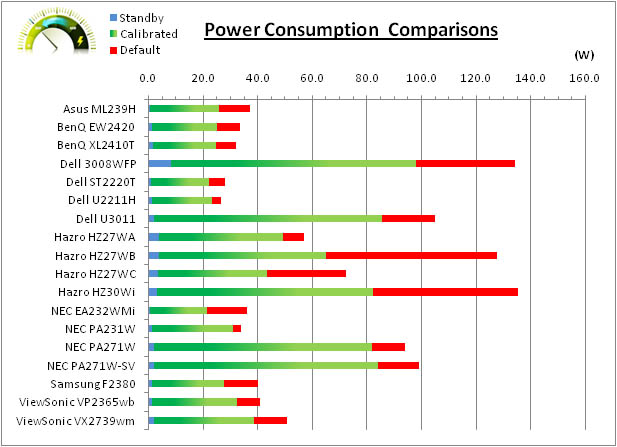
We tested this ourselves and found that out of the box the screen used a slightly lower 37.1W of power. After calibration, where we had adjusted the brightness control and therefore the backlight intensity, this was reduced to 25.9W. In standby the screen uses only 1.3W of power. We tested the ECO mode which seemed to actually increase the power consumption back to the standard consumption. It reverted our manual 30% brightness setting back to a brighter setting, although the option was now greyed out in the OSD. This ECO mode doesn't appear to offer much or is perhaps set up wrongly? A calibrated state with manual adjustment of the brightness control would be most appropriate. There will always be a compromise between luminance and power consumption anyway.
As well as the power saving of W-LED backlighting
Asus are also promoting its environmentally friendly components. This includes a
mercury-free LED-backlit panel,
corrugated cardboard packaging with at least 80% recycled content and slim-flat packaging
which allows more cartons to be fitted per cargo, reducing
transportation costs and CO2 emission.
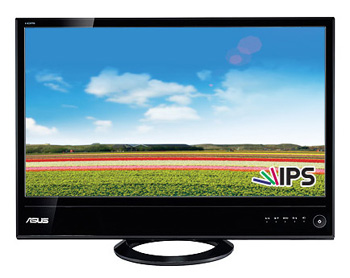
The Panel and Backlighting Unit The Asus ML239H utilises an LG.Display LM230WF3-SLB1 e-IPS panel which is capable of producing 16.7 million colours. The panel itself actually uses a 6-bit colour depth with frame rate control (A-FRC) to produce the 16.7m colours. This is different to regular 8-bit IPS matrices, but this is likely a measure taken to achieve a lower price point for these modern lower-cost displays. Studying detailed information from LG.Display's datasheet confirms the panel is indeed 6-bit+AFRC. The ML239H uses White-LED (W-LED) backlighting. The colour space of this screen is approximately equal to the sRGB reference (and around 72% NTSC) and the screen is therefore classifed as a standard gamut model.
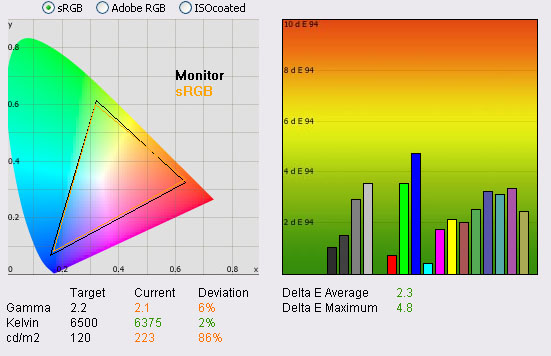
An important thing to consider for most users is how a screen will perform out of the box and with some basic manual adjustments. Since most users won't have access to hardware colorimeter tools, it is important to understand how the screen is going to perform in terms of colour accuracy for the average user. I restored my graphics card to default settings and disabled any previously active ICC profiles and gamma corrections. The screen was tested at default factory settings using the DVI interface, and analysed using an X-rite i1 Pro spectrophotometer combined with LaCie's Blue Eye Pro software suite. An NEC branded and customised X-rite i1 Display 2 colorimeter was also used to verify the black point and contrast ratio since the i1 Pro is less reliable at the darker end.
The out of the box performance of the ML239H was fairly good. The CIE diagram on the left confirms that the monitors colour gamut (black triangle) very closely matches the sRGB colour space (orange triangle). It extends a little past the sRGB space in blues and greens and is a little short in red shades, but not by much at all. Default gamma was recorded at 2.1 average, leaving it 6% out from the target of 2.2. White point was very close to the target though at 6375k (2% deviance) which shows a good factory set up in this area.
Luminance was recorded at a high 223 cd/m2 which is perhaps not surprising given that the screen is set at 100% brightness by default. This should be easy enough to adjust later during our calibration. Even at this high 223 cd/m2 luminance, the black depth was a very good 0.28 cd/m2. This gave us a static contrast ratio of 803:1 which is good for an IPS panel.
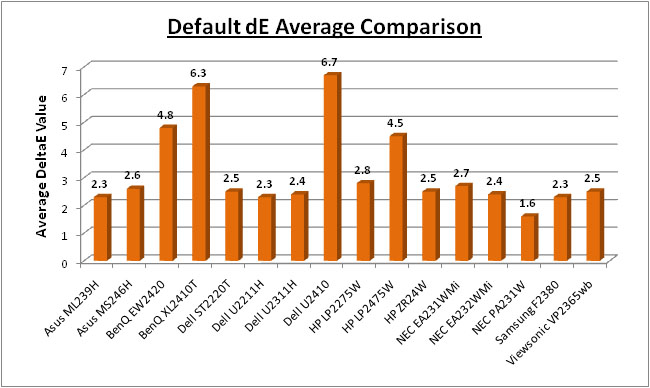
Colour accuracy was moderate at default factory settings with an average dE of 2.3, ranging up to a maximum of 4.8. The screen felt quite even to the naked eye although overly bright at these default settings. This factory set up will probably be fine for casual users as long as you turn the brightness control down to around 30% to reach a more comfortable luminance.
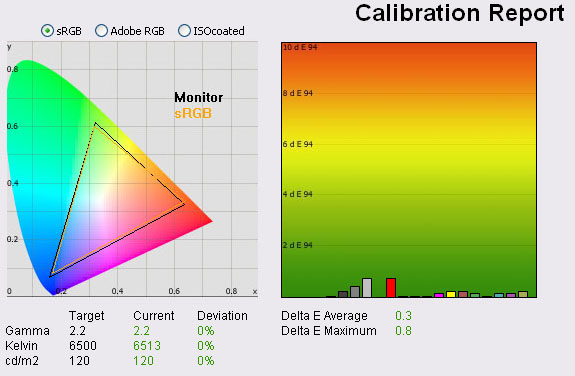
I wanted to calibrate and profile the screen to determine what was possible with optimum settings and profiling. I used the X-rite i1 Pro spectrophotometer combined with the LaCie Blue Eye Pro software package to achieve these results and reports. An NEC branded and customised X-rite i1 Display 2 was used to validate the black depth and contrast ratios due to lower end limitations of the i1 Pro device.
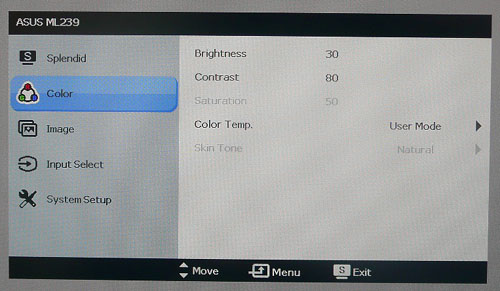
I remained in the standard mode preset for this process and this meant that I could adjust the RGB controls from within the OSD menu. I followed LaCie's calibration process through, adjusting the OSD settings in line with the recommendations made in the process, and then letting the software carry out the LUT adjustments at a graphics card level and create an ICC profile. The screen does not feature a hardware LUT calibration option so other than the OSD alterations, the rest of the process is carried out at a graphics card level in profiling the screen.
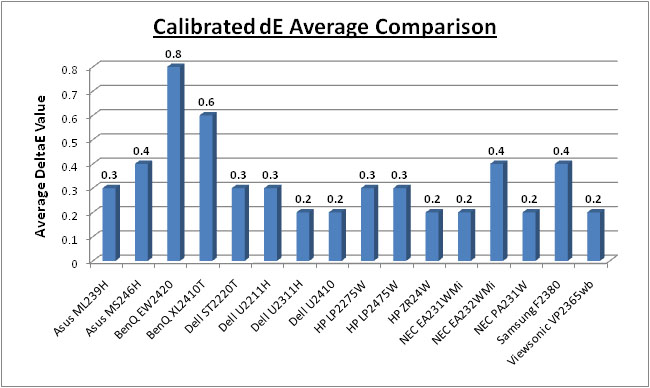
The calibration was a success. Gamma had been corrected now to the target of 2.2 and white point was basically spot on at 6513k. Luminance had been reduced to a more comfortable 120 cd/m2 after the adjustment of the OSD brightness control to 30%. Black depth was still good at 0.16 cd/m2 and this gave us a reasonable calibrated static contrast ratio of 749:1 Colour accuracy was also improved nicely with dE average now 0.3 and maximum only 0.8. LaCie would consider colour fidelity to be excellent.
Testing the screen with various colour gradients showed very smooth transitions with no sign of any colour banding. There was some slight gradation evident in darker tones but overall no issues. There was also some slight temporal noise evident, particularly in darker tones if you look very closely. This is a result of the FRC algorithm used to produce the 16.7 million colour palette. It's not something you'd notice in practice to be honest, and you do have to look very closely to see it.
You can use our settings and try our calibrated ICC profile if you wish, which is available in our ICC profile database.
Calibration Performance Comparisons
I've provided a comparison above of the ML239H against some of the other screens we have tested in a similar size range. Out of the box average dE was 2.3 on the ML239H which was mediocre. It was better than the BenQ EW2420. That model used one of AU Optronics' newest AMVA panels with W-LED backlighting. Default colour accuracy of the EW2420 was worse at 4.8. The default colour accuracy of the ML239H was comparable to some of the other 23" IPS models we have tested, including the Dell U2311H (2.4), NEC EA231WMi (2.7) and Viewsonic VP2365wb (2.5) which was pleasing. The other 23" IPS + W-LED screen we have tested is the NEC EA232WMi and it is using the same panel as the ML239H. It was very close as well at 2.4 dE average. The professional grade 23" NEC PA231W was better still at 1.3 dE average. A reasonable performance in terms of default colour accuracy from the Asus ML239H and in keeping with the competition.
Once calibrated the dE average was reduced to 0.3. This would be classified as excellent colour fidelity by LaCie. It was not quite as low as some of the other screens here which reached down to 0.2 average, but in practice you would not notice any real difference here. Some of the professional range models from NEC are even more accurate. Professional grade monitors like the NEC PA series also offer other high end features which separate them from some of these other models, including extended internal processing, 3D LUT's and hardware calibration. These comparisons are based on a small selection of tests, so it should be remembered that other factors do come into play when you start talking about professional use. For further information and tests of a high end professional grade screen with hardware LUT calibration, you may want to have a read of our NEC SpectraView Reference 271 review.
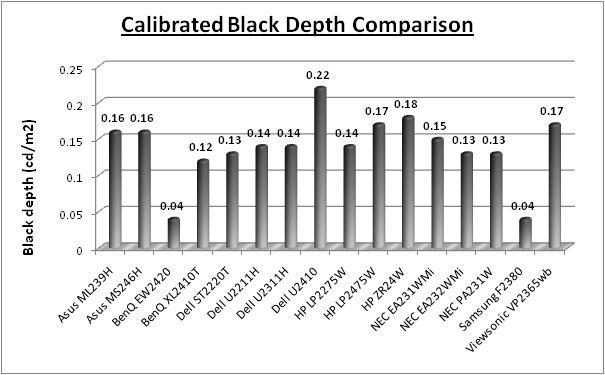
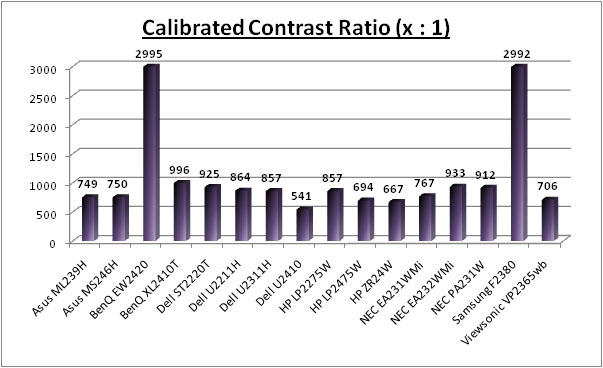
The black depth and contrast ratio of the ML239H were reasonable for an IPS panel. Calibrated black depth was 0.16 which was very close to the other 23" IPS screens we have tested (ranging between 0.13 and 0.17). The NEC EA232WMi is the closest rival to the Asus ML239H and had a slight better calibrated black depth of 0.13. Contrast ratio was a decent enough 749:1 but it was a little behind the others in this regard. The NEC EA232WMi again was better with a 933:1 static contrast ratio thanks to its lower black point. The BenQ EW2420 and Samsung F2380 with their AMVA and cPVA panels offered some fantastic contrast ratios of ~3000:1 which IPS cannot compete with at the moment.
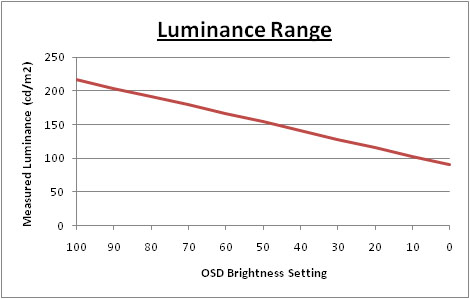
I wanted to see how much variance there was in the screens contrast as we adjusted the monitor setting for brightness. In theory, brightness and contrast are two independent parameters, and good contrast is a requirement regardless of the brightness adjustment. Unfortunately, such is not always the case in practice. We recorded the screens luminance and black depth at various OSD brightness settings, and calculated the contrast ratio from there. Graphics card settings were left at default with no ICC profile or calibration active. Tests were made using an NEC branded and customised X-rite i1 Display 2 colorimeter. It should be noted that we used the BasICColor calibration software here to record these, and so luminance at default settings may vary a little from the LaCie Blue Eye Pro report.
The luminance range of the screen was moderate at the top end although not as high as some modern screens. At 100% brightness control, the screen was able to offer a maximum luminance of 217 cd/m2 which is a little way off the advertised 250 cd/m2. You have a decent enough range to work with at the lower end as you can adjust the backlight down to achieve a low luminance of around 90 cd/m2. A setting of around 25 - 30% at default settings should return a luminance of around 120 cd/m2 for comfortable day to day use in normal lighting conditions. If you carry out further calibration or adjustments of contrast or the individual RGB channels this of course may vary. The range of adjustments was not as great as on some other screens with a fairly high minimum brightness setting. However, this should be fine for most users anyway. We have plotted the luminance trend on the graph below. The screen behaves as it should, with a reduction in the backlight intensity controlled by the reduction in the OSD brightness setting.
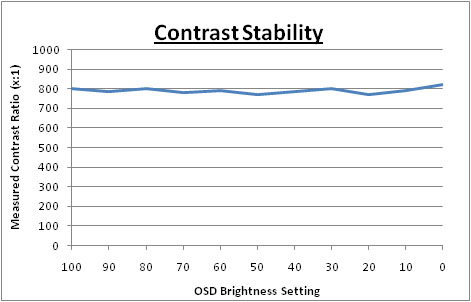
Black depth was reasonable across the whole range, being between 0.27 and 0.11 cd/m2. This was reasonable for an IPS panel but a little behind some other competing (IPS based) models. This could also not compete with the modern AMVA and cPVA panels that we have seen. Contrast remained stable across the range with an average static figure of 791:1 recorded based on a default uncalibrated state. These contrast measurements were plotted on the graph shown below:
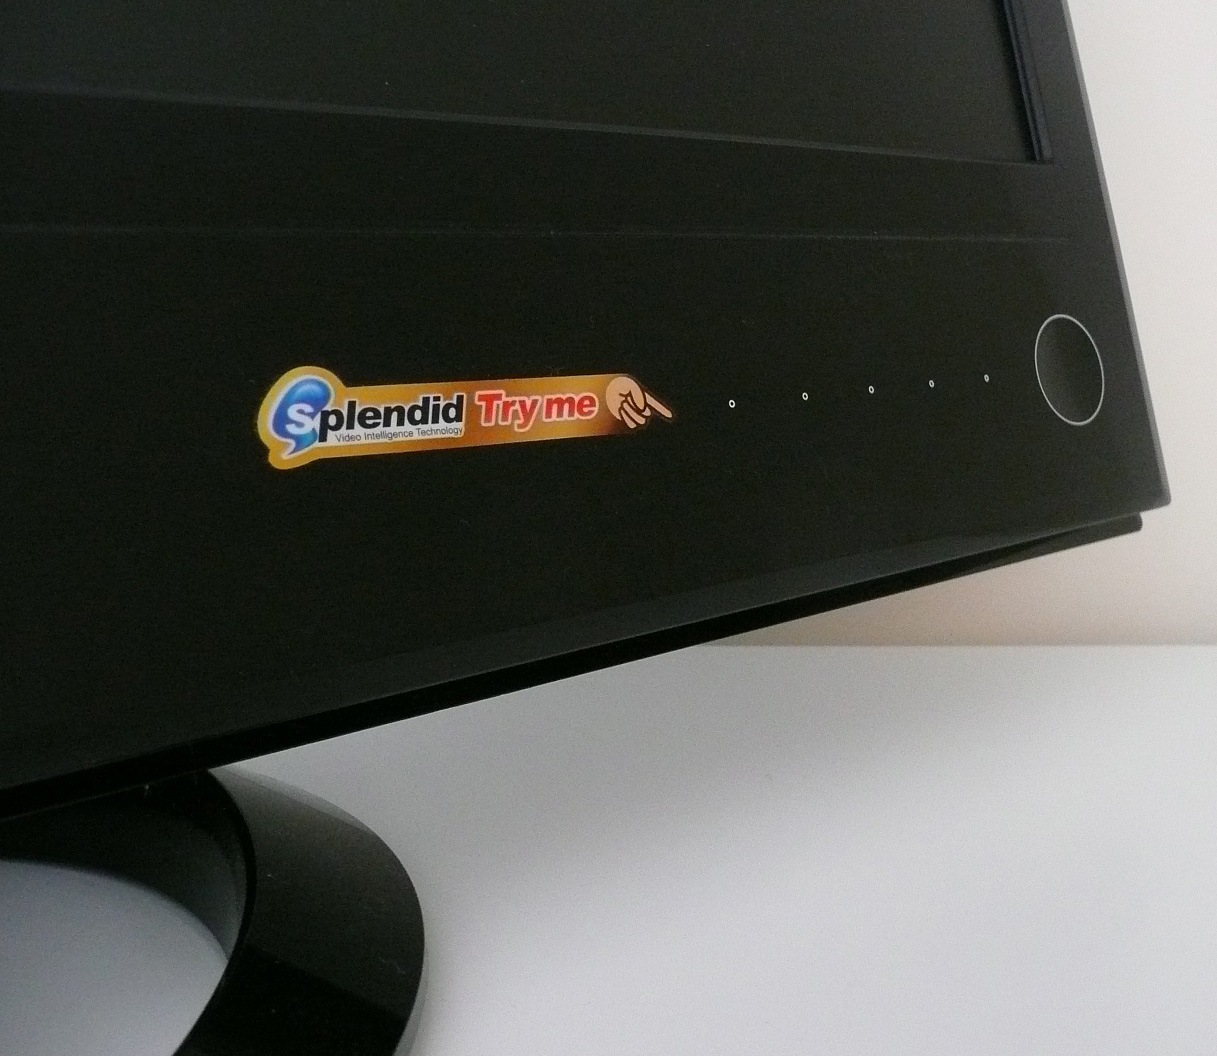
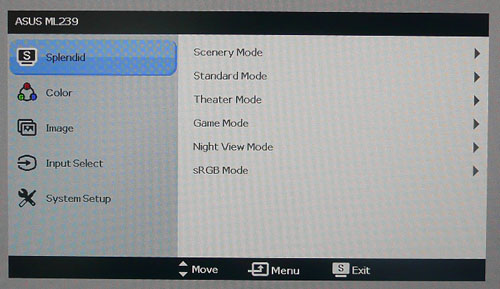
The DCR feature is only available in certain preset modes from the 'Splendid' menu. It is available when using the theater, game, night view and scenery modes. The option is greyed out in the other preset modes. If you enable ASCR when in any of these presets, the brightness control becomes greyed out.
The tests that we carry out to measure dynamic contrast ratio involve an almost completely white and almost completely black screen. In real use you are very unlikely to ever see a full black or full white screen, and even our tests are an extreme case. Carrying out the tests in this way does give you a good indication of the screens dynamic contrast ratio in real life situations however. Carrying out this test didn't seem to make use of the DCR much at all. There was a perhaps a very slight change in the screens brightness as you switched between the extremes of an almost completely black screen and an almost completely white screen. However, it was very minimal. In fact our colorimeter recorded maximum luminance as 199 cd/m2 and minimum black depth as 0.25 cd/m2. This only gave us a static contrast ratio of 794:1 which was no better than our uncalibrated default measurements of the screen. It seemed like this function made little to no difference in practice. Again testing this feature during several movie and video clips showed no real variation in the backlight during changes in the scenes. However, the feature can work, but only in the most unrealistic and extreme circumstances. If you display an all black screen (completely black) then the feature "works". You can watch this by bringing up the OSD menu when viewing an all black screen and in fact the screen goes so dark that it seems to turn the backlight off completely after a couple of seconds. You can see the fading of the OSD menu is smooth but after an initial delay of about a second the transition is very fast and the OSD then disappears completely! Switching back to a background which is not 100% black brings it back up instantly. So the technology appears to be switching the backlight off completely which would account for the ridiculously high DCR of 50 million:1. In the right lab settings you can achieve this DCR (in fact its tending towards infinity:1 if you consider its black point is basically the backlight turned off = 0 cd/m2.). However, in practice you are never going to be able to see a DCR range like that. In fact in normal use the DCR doesn't seem to operate at all. Another marketing gimmick.
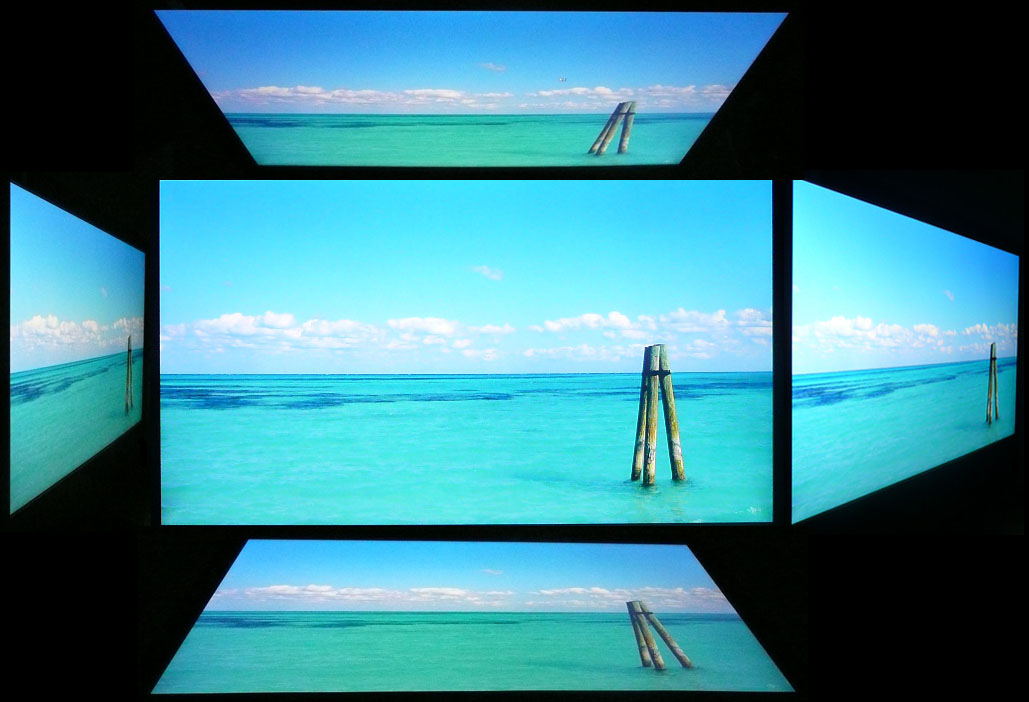
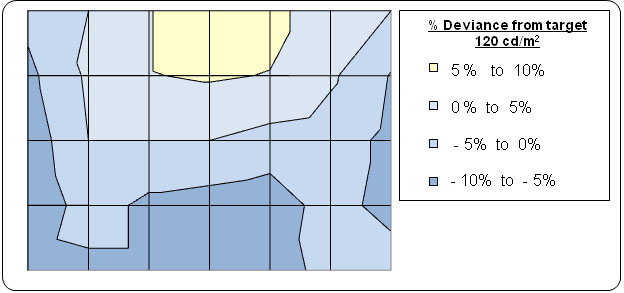
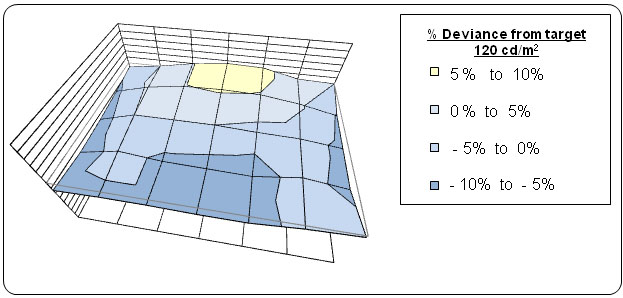
Viewing angles of the Asus ML239H are very good, as you would expect from a screen based on an e-IPS panel. Horizontally there are very wide fields of view with a small contrast shift only really becoming noticeable from a fairly wide angle of about 45°. Vertically, the contrast shift was a little more pronounced but the fields of view were still very good. The panel is free from any off-centre contrast shift which you see from VA matrices, and this is why IPS technology is so highly regarded in the colour enthusiast and professional space. It is also free of the very noticeable contrast and colour tone shifts you see from TN Film panels vertically. On a black image there is a fairly noticeable purple hue when viewed from an angle but there is no obvious white glow that you can see from some modern IPS panels. There is no A-TW polarizer on this panel which is rarely used now in the market. Measurements of the screens luminance were taken at 35 points across the panel on a pure white background. The measurements were taken using BasICColor's calibration software package, combined with the NEC customised X-rite i1 Display 2 colorimeter. The above uniformity diagram shows the difference, as a percentage, between the luminance recorded at each point on the screen, as compared with the reference point of a calibrated 120 cd/m2. This is the desired level of luminance for an LCD screen in normal lighting conditions, and the below shows the variance in the luminance across the screen compared with this point. It is worth noting that panel uniformity can vary from one screen to another, and can depend on manufacturing lines, screen transport and other local factors. This is only a guide of the uniformity of the sample screen we have for review.
Uniformity of Luminance The luminance uniformity of the ML239H sample was pretty good overall. The maximum deviations from the central measurement of 120 cd/m2 were as low as 109 cd/m2 along the left hand edge and up to the highest measurement of 129 cd/m2 along the middle top area. Overall the whole screen was within 10% deviance from the target however which was good and 54% of it was measured within 5% deviance. The upeer part of the screen was a little brighter than the bottom half but you couldn't spot this in normal use.
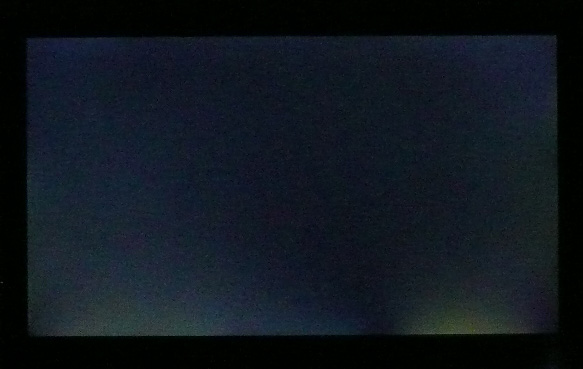
As usual we also tested the screen with an all black image and in a darkened room. A camera was used to capture the result. Although we had seen promising things from the luminance uniformity of the screen there was unfortunately some rather obvious backlight bleed from the panel, mostly along the bottom edge. This was easy to see with the naked eye and could pose a problem for people who want to use the screen in dimly lit conditions. Since the W-LED unit is positioned along the bottom edge of the panel, this is where the leakage is most apparent. In normal day to day use you can't see this leakage but if you were planning to use the screen with dark images in dark conditions, then this could present a problem.
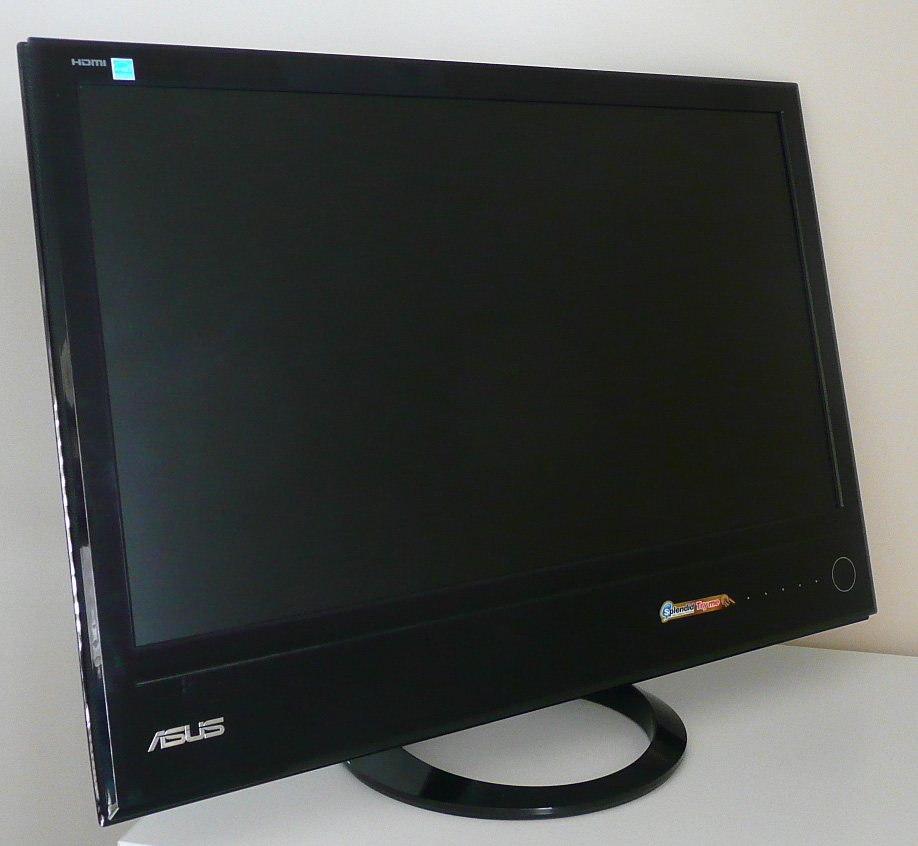
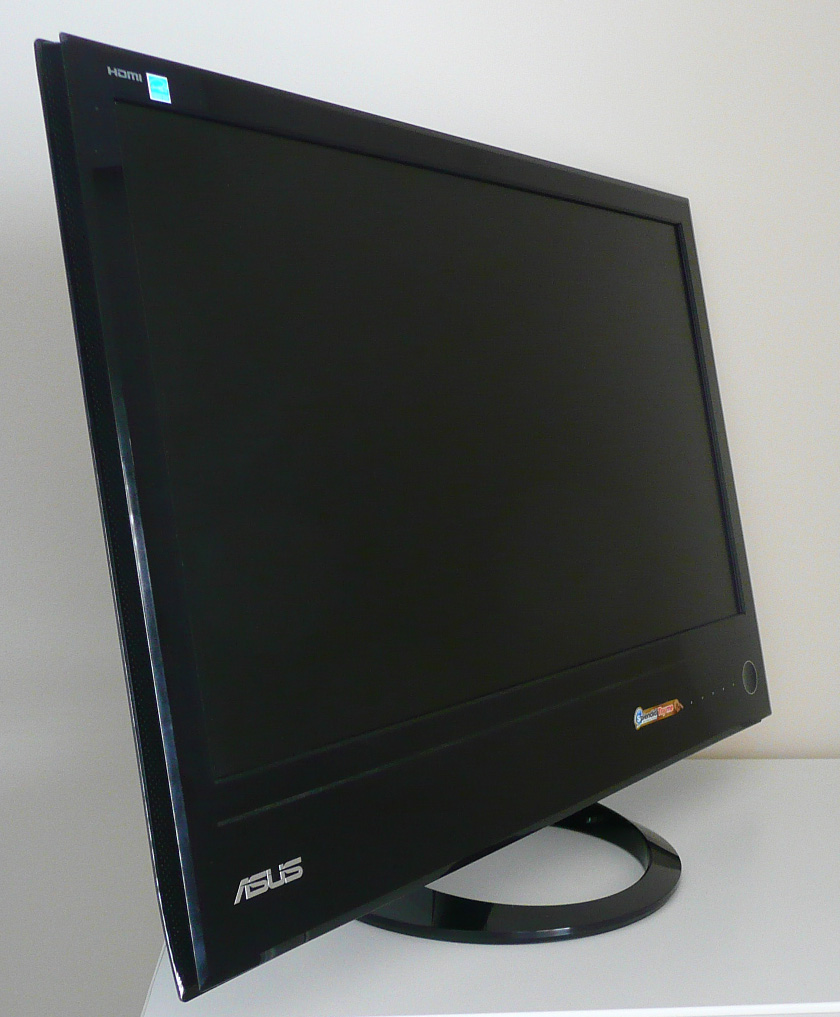
The 23" screen size and high 1920 x 1080 resolution were very pleasant for office working, and although you do lose a bit of height vertically compared with a 1920 x 1200 screen, it was nothing too bad. Image quality was very crisp and sharp using the DVI interface, and although D-sub (VGA) was also very good, it was not quite as sharp on text I didn't think. The 0.265 mm pixel pitch was slightly smaller than a 23.6" 1920 x 1080 screen of course (0.2715 mm) and 24" 1920 x 1080 screen (0.276 mm), and so text size felt about right for every day use. Default luminance of the screen was too high for prolonged office use, although even at 100% brightness control it did not reach anything too blinding with a maximum luminance of 217 cd/m2 being recorded. For comfortable use in normal lighting conditions a setting of around 25 - 30% should return you a luminance of ~120 cd/m2. Although there was a decent range of preset modes, there were none specifically aimed at office, text or internet use. You will probably want to set up your standard preset for normal office work and at least there are others available for gaming and multimedia. The ergonomics of the screen were a little limited sadly. The special ring stand did offer a reasonable range of tilt and a decent swivel adjustment. However there was no height adjustment available and so the screen does sit quite low to the desk. There is also no option to rotate the screen into portrait mode which some people might like for office document viewing. It was also a bit of a shame not to see some USB ports available and there are no extra features like ambient light sensors, integrated speakers and card readers which are often useful in office environments. These have been left off to keep production and retail costs down.
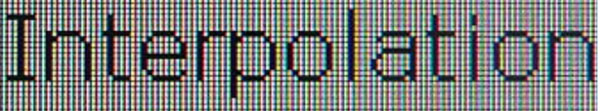
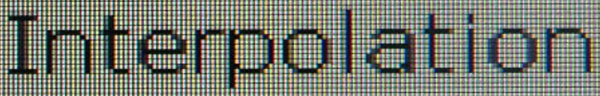
The screen is designed to run at its native resolution of 1920 x 1080 and at a 60Hz recommended refresh rate. However, if you want you are able to run the screen outside of this resolution. We tested the screen at a lower 1680 x 1050 resolution to see how the screen handles the interpolation of the resolution. At native resolution the text was very sharp as you can see from the top photograph. When you switch to a lower resolution the text is noticeably more blurry although not unusable. There is some overlapping of the text across sub-pixels as you can see in the photo which results in this blurring. Native resolution is recommended where possible.
Response Time Control
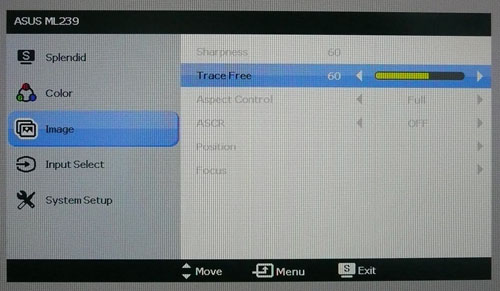
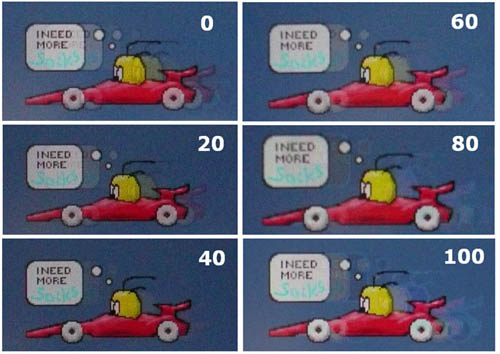
Before we get into the side by side screen comparisons I wanted to talk about the response time settings available from the ML239H. This function allows you to control the responsiveness of the panel in games and fast moving images. Being rated with a 5ms G2G response time, the e-IPS panel uses response time compensation (RTC) technology to boost pixel response times and improve responsiveness in practice. The panel itself (LG.Display LM230WF3) has a 14ms ISO response time (black > white > black) on paper but with an overdrive circuit applied the grey to grey transitions are improved. This RTC impulse is applied to speed up the pixel transitions which can help reduce motion blur and ghosting. Asus have allowed you to control the level of RTC impulse applied to the panel through their OSD, and through the 'Trace Free' option. We saw this same feature when we tested the Asus MS246H before and it proved useful. The Trace Free options are available in steps of 20, from 0 to 100. The higher the setting, the higher the level of RTC being applied to the liquid crystals. In theory this should boost response times, but let's see how it impacts real life performance. The screen was tested using the chase test in PixPerAn, a good bit of software for trying to quantify differences in real terms responsiveness between monitors. As a reminder, a series of pictures are taken on the highest shutter speed and compared. The images below show the best case example from each of the 6 trace free settings. This should only be used as a rough guide to comparative responsiveness but is handy for a direct comparison of the impact of this setting:
As you can see, there was certainly a variation in responsiveness as you changed the trace free setting. You could observe this easily with the naked eye as you switched between the different levels. The blurring and ghosting of the moving car improved as you increased the setting from 0 up to 40. At a setting of 40 there was very little ghosting evident at all and although there was still some motion blur it was not too bad. Unfortunately as you increased the trace free setting further above 40, the performance was adversely affected. At a setting of 60, a more pronounced blur was introduced as compared with 40. This was at a similar level to the 20 setting. When you reached 80 the blurring was improved again a little, but there was a slight RTC overshoot introduced. The RTC error was too high at this level and it resulted in a pale shadow behind the moving car. At a setting of 100 this RTC overshoot was exagerated even more producing a rather obvious and distracting pale and dark trail behind the moving car. So it seems that the optimum trace free setting on the ML239H is 40, where there is minimal motion blur and ghosting, and no noticeable RTC overshoot. Anything above this and the RTC impulse is applied too aggressively and it results in an unfortunate overshoot due to its poor control.
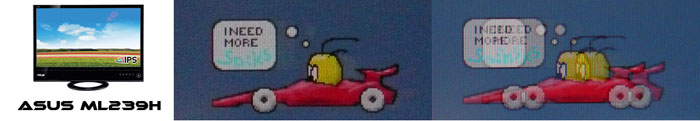
Display Comparisons The screen was tested again using PixePerAn and this time compared with the results we had obtained from other competing screens. The images below show the best case example on the left hand side, and the worst case example on the right hand side. This should only be used as a rough guide to comparative responsiveness but is handy as a way of keeping a constant test of each screen.
The Dell U2311H is e-IPS based as well but uses a slightly different panel (LM230WF2) to the Asus. Like the Asus, it also uses RTC technology to boost pixel transitions and is quoted with an 8ms G2G response time figure. It also shows much less motion blur than the non-overdriven models and a comparable performance to the ML239H. There is a very slight RTC overshoot evident on the U2311H in the form of a slightly pale halo behind the car, but this is nothing too severe. In practice there is perhaps a slight improvement in motion on the Dell but it is minute, and at the cost of a very slight overshoot of the RTC impulse. The Asus is a good alternative in the 23" IPS sector for gamers.
I've also provided some comparisons of the
ML239H against some of the popular and recent 24" models in the market we have
tested. As you can see, the ML239H is a lot faster than the AMVA based
BenQ
EW2420, which to be quite honest, did not perform very well in this test.
It is also faster than the cPVA based
Samsung F2380 we tested recently. The
Dell U2410 and
HP
ZR24W both use RTC and so their performance was better and much more like
the performance of the Asus ML239H.
I've also included a comparison above against two gamer-orientated screens, both featuring heavily overdriven TN Film panels, and 120Hz technology. The pixel responsiveness of both of these is a little ahead of the ML239H, and the 120Hz frequency allows for improved 120fps frame rates and the support of 3D content as well. The BenQ XL2410T does show some rather noticeable RTC overshoot in the form of dark trails behind the moving image (speech bubble and head) which is unfortunate, and a sign that the RTC impulse is too aggressive. The Samsung 2233RZ remains our champion in this test. The Asus ML239H was pleasing in these tests overall. The trace free option allows a good range of control over the level of RTC applied to the panel, although a setting of 40 does seem optimum in our tests. The performance was very comparable to the other IPS screens which have been impressive in these tests, namely models like the Dell U2311H and Dell U2410. The Asus also holds the edge over the non-overdriven IPS models in the 23" market so provides a good option for those wanting an IPS screen which is capable of a decent level of gaming.
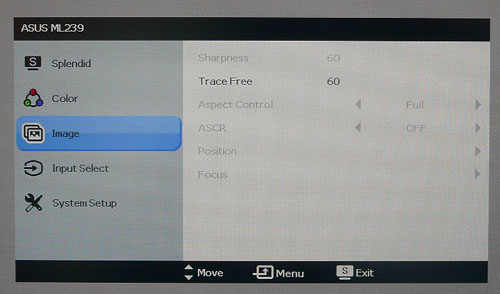
Apsect Ratio Control - The ML239H supports aspect ratio control options through the OSD 'image' menu. There are options for full, 4:3 and overscan (only available when using HDMI). Complete 1:1 pixel mapping is lacking here. Preset Modes - There is a 'game' preset mode available in the Splendid preset section for those who want to set up a preset based on their requirements. This boosted the brightness setting to 80% and made the colours a little more vivid. You can change the brightness and other settings within the preset and so save a different setup for each preset if you want which is good. The dynamic contrast ratio is also available in this preset although we have already seen that this does little to nothing in real use.
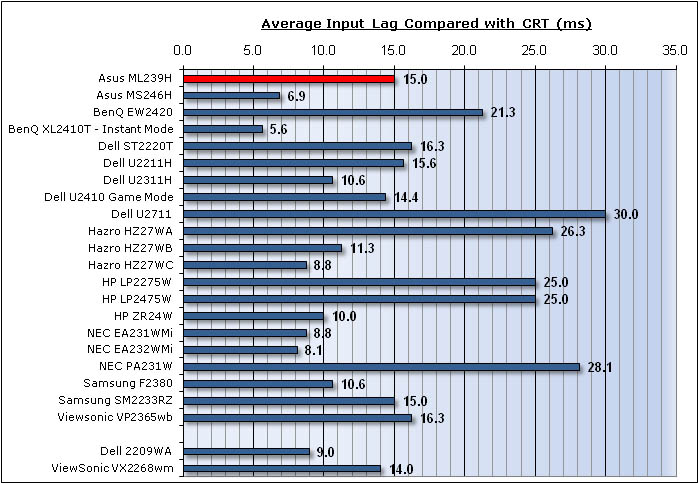
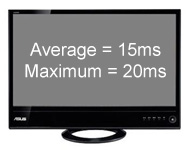
As usual I tested the screen in clone mode with a CRT to determine the level of input lag. This is something which can put off some gamers and is a delay between graphics card and monitor output. By hooking up a CRT you can show that the LCD lags behind somewhat, which can affect users in some situations where they rely on the screen image being as fast as their inputs (e.g. fast FPS shooting games). Often, input lag is very low and probably wouldn't represent too much of a problem in real terms. The ML239H showed a reasonably low level of input lag with an average lag of 15 ms, and a maximum of 20 ms. This was a little higher than some of the other 23" IPS models like the NEC EA232WMi (8.1 ms) and Dell U2311H (10.6 ms) for instance. It was similar to the ViewSonic VP2365wb at 16.3ms though. Overall this was a sufficiently low input lag and should not represent any real problems in practice.
The following summarises the screens performance in video applications:
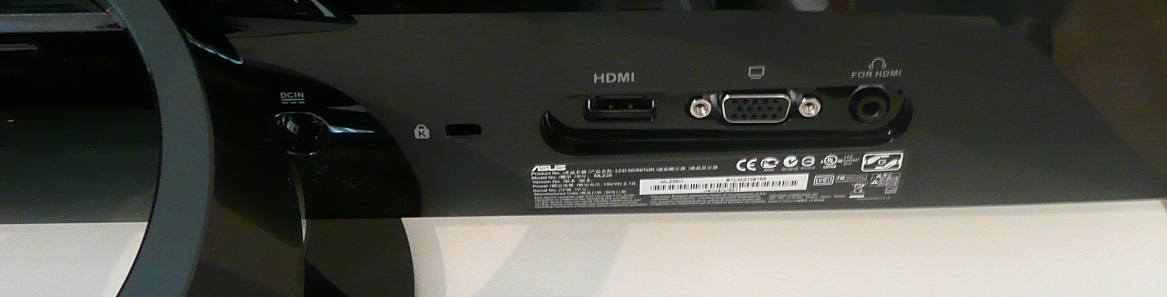
It's always interesting to take a look at a new IPS screen entering the market and Asus have done a good job here I think with the ML239H. Asus aren't traditionally a big player in the monitor market but are starting to release a few new models with interesting features and specs, and using the ever-popular IPS panel technology. The ML239H offers a good spec and a reasonable range of features and options for the price. Performance wise the screen was impressive in most cases. Colour accuracy and default set up were pretty good and should be adequate for most casual users out of the box. The black depth and contrast ratio are good for an IPS panel although not quite as good as a couple of other similar screens. Once calibrated the screen offered very reliable performance as you would hope. Viewing angles were wide thanks to the IPS panel and its use for office applications was pleasing. One area which might separate this model from its competitors is its pixel responsiveness. Thanks to the addition of an overdrive impulse the responsiveness is very good at the right settings and is comparable to the popular Dell U2311H. These two are a step apart from the other non-overdriven IPS panels we have discussed here so this screen would probably be a good choice for someone wanting to game on their new screen. This is combined with a low input lag as well which is pleasing. There are a couple of areas of disappointment however. The dynamic contrast is useless it seems in real life situations but to be honest, it's rare to find a DCR which works well or is practically useful. There was also a bit of backlight leakage which was a shame and quite noticeable, although this can of course vary depending on stock, manufacturing lines and other factors. It's good to see HDMI included but it would have been nice to offer DVI as well. Height adjustment is notable by its absence, but the rest of the ergonomic adjustments are decent and smooth and easy to use.
The ML239H is
priced at around £180 GBP (inc VAT) which makes it very competitively priced
compared with popular 23" IPS models like the Dell U2311H (£230) and NEC
EA232WMi (£250) for instance. If you don't need a couple of the extra features
of those models then this is certainly a good alternative and should offer some
very good all round performance for a reduced price.
Further reading: TestFreaks
|
|
|||||||||||||||||||||||||||||||||||||||||||||||||||||||||||||||||||||||||||||||||||||||||||||||||||||||||||||||||||||||||||||||||||||||||||||||||||||||||||||||||||||||||||||||||||||||||||||||||||||||||||||||||||||||||||||||||||||||||||||||||||