Last August we carried out a
full test of the professional grade
NEC PA271W monitor. The screen provided a massive range of options and
extras including some high end features such as hardware calibration support, a
14-bit 3D LUT, ColorComp uniformity correction and AmbiBright auto-brightness
control. The screen performed very well in our tests, and we also took the
opportunity to try out NEC's SpectraView II and SpectraView Profiler software
packages which allowed varying degrees of calibration of the screen.
You can read the full analysis in
that review of course, so I won't repeat
everything here.
In the review, we also discussed the other
version of the screen which is available in Europe, and is referred to as the
'SpectraView Reference' or 'SV' edition of the screen. As we covered at the
time, these models are designed for the European market and reportedly feature
a few extras including hand-picked A-grade panels, some performance tweaks, a
packaged monitor
hood and most importantly,
the support for hardware calibration via the European SpectraView Profiler software.
The regular PA271W model is also available in Europe, but this SV package comes
with some extra features for those really demanding users. We will carry out
some further tests of this SV edition here, with particular focus on the
hardware calibration. I won't carry out our full range of tests since results
from our original review are still relevant when it comes to response time,
office use, movies etc. We will also take a look at NEC's custom made wide-gamut
colorimeter package (MDSVsensor2) which they supply for calibration of these
screens.
Here's the spec of the PA271W-SV (as I will refer
to it as for ease) screen:
|
Size |
27"WS |
Colour Depth |
1.07 billion colour panel (10-bit), 14-bit 3D
LUT with 4.3 trillion colour palette. |
|
Aspect Ratio |
16:9 |
Colour Gamut |
102% NTSC colour gamut (97.1% Adobe RGB, 100%
sRGB) |
|
Resolution |
2560 x 1440 |
Viewing Angles |
178/178 |
|
Response Time |
7ms G2G (12ms ISO) |
Panel Technology |
p-IPS |
|
Contrast Ratio |
1000:1 static |
Interfaces |
DVI x2 (with HDCP), DisplayPort |
|
Brightness |
300 cd/m2 |
Colour |
Black bezel, base and stand |
|
Special Features |
Tilt, swivel, rotate and height adjustment. USB
2.0 ports (2 up, 3 down), Picture In Picture (PiP), Picture By Picture
(PbP), programmable 14-bit 3D LUT, ColorComp, AmbiBright ambient light sensor,
monitor hood |
|
Buy |
PCBuyIT.co.uk |
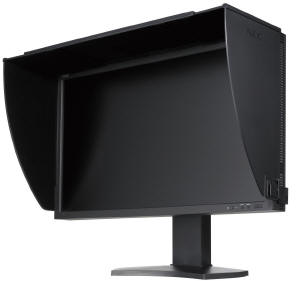
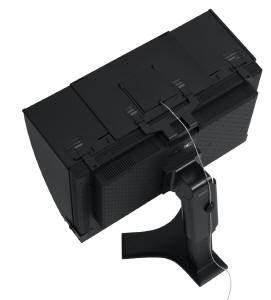
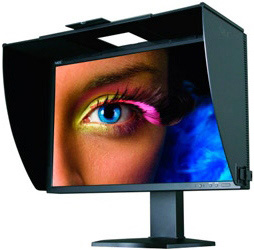
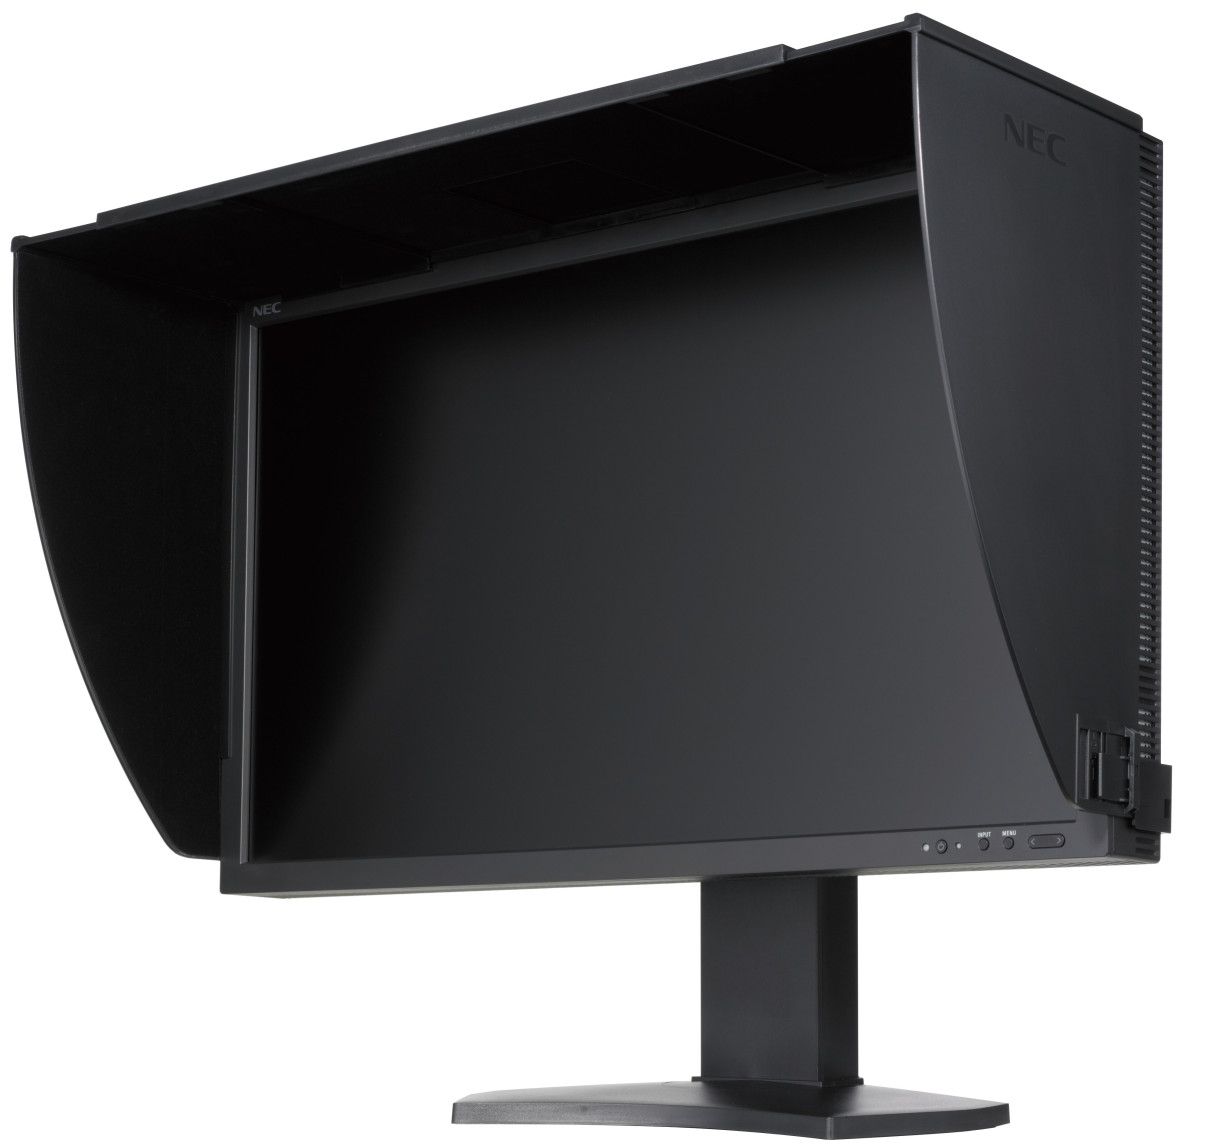
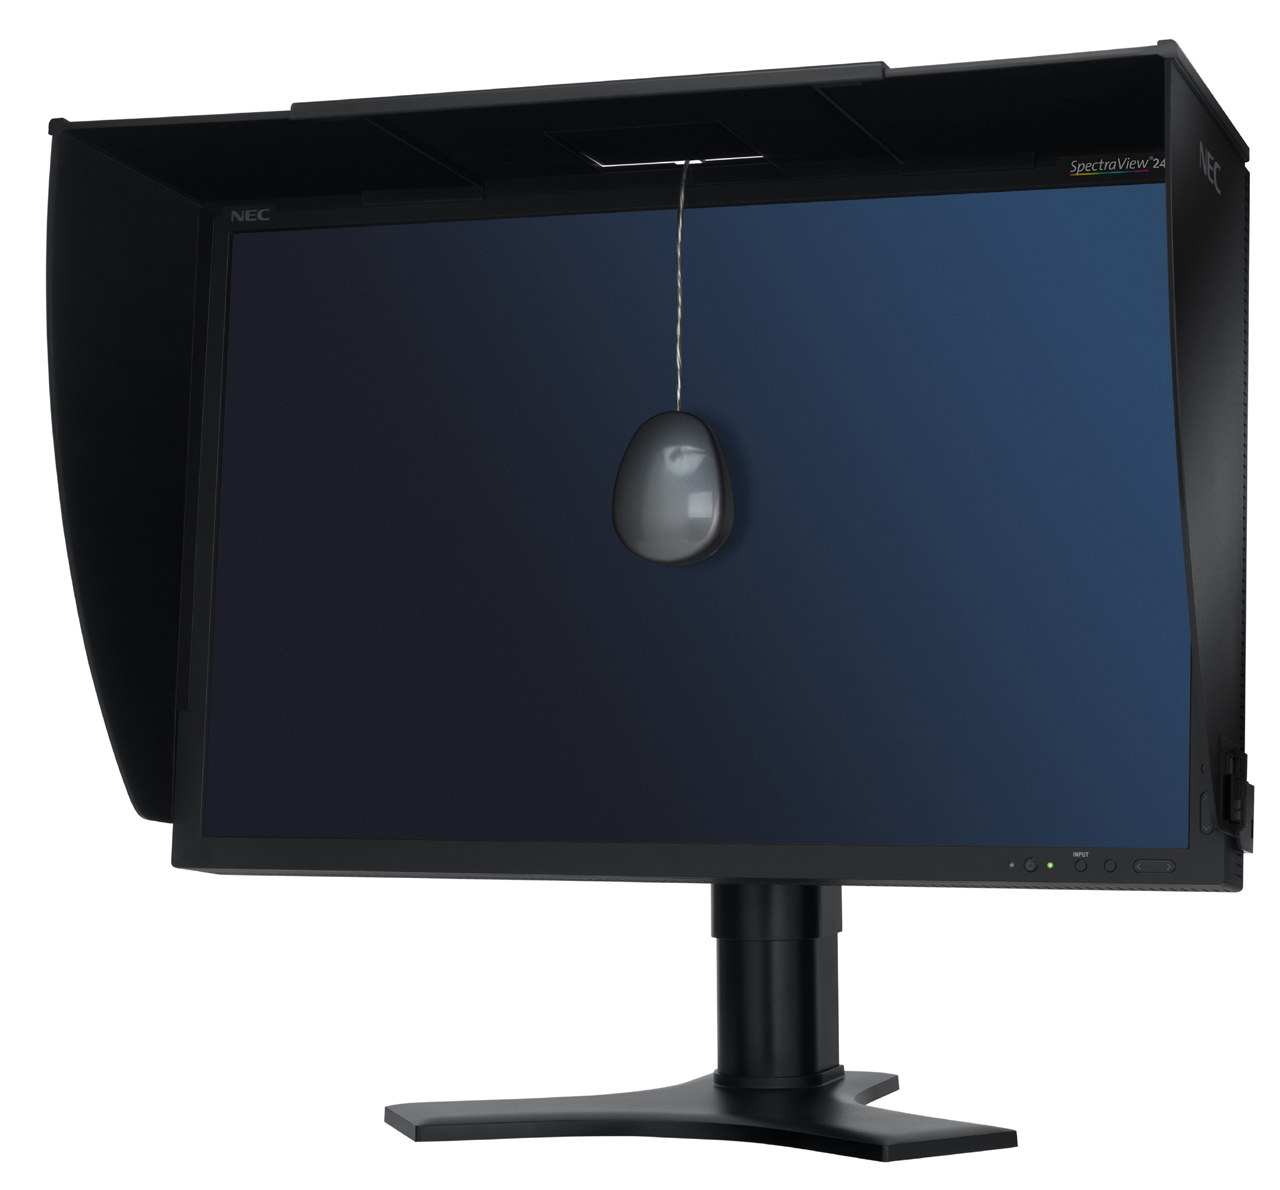
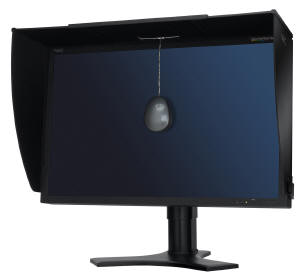
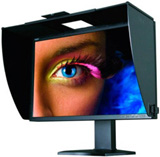
Above:
Front views of the screen with hood attached. Click for larger views
The PA271W-SV is obviously the same as the
regular edition in terms of appearance so I won't go over it in too much
detail again. You can read our
PA271W review for more information. I have provided some images here of
the screen with the calibration hood attached. This is packaged with the
SpectraView Reference version of the screen but you must clip the sections
together and assemble it yourself. There is a very good range of ergonomic
adjustments available from the stand and a reasonable range of interface
options with DVIx2 and DisplayPort. HDMI is missing sadly.
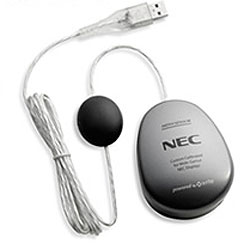
Although it is not provided as standard, NEC do
offer a colorimeter calibration package for use with this screen. The monitor
is packaged with their SpectraView Profiler software, something we will test
later. However, NEC have produced a customised X-rite i1 Display 2 colorimeter
for use with their wide gamut screens. This is referred to as the MDSVSensor2
(Medical Display SpectraView Sensor 2) device and again we will test this a
little later on. This has been specially calibrated for use with their wide
gamut displays including the PA series, so should offer a high level of
performance.
The screen is also packaged with an individual
display certificate confirming the screen meets the SpectraView Reference 271
standards. The certificate which came with our sample screen stated it had
been tested with a Gretag Eye One (meaning X-rite i1 Pro presumably), and met
various criteria and standards. It does also state that settings are native
and recommends you calibrate to your individual needs.
|
 |
|
State |
Power Usage (W) |
|
Factory Default |
99.2 |
|
Calibrated Settings (Hardware Calibration) |
83.9 |
|
Standby |
1.9 |
|
We tested the screen at factory settings and
once calibrated (see
calibration section). At default settings, and without external USB
devices connected, the screen used 99.2W of power. After calibration, when the
screens brightness was automatically controlled through the hardware
calibration to
achieve the target 120 cd/m2
luminance, the power consumption was 83.9W. In standby the screen uses only
1.9W which is good.
More images, OSD menu information and product
details are covered in our
PA271W review

Colour
Accuracy, Black Depth and Contrast
The Panel
The NEC PA271W-SV utilises a 10-bit (8-bit + AFRC) 'performance IPS'
(p-IPS) panel. This is a name given by NEC to the high end 10-bit IPS panels
being used in their PA series of screens, but technically the panel remains the
same as the so called H-IPS panels in terms of pixel structure. It's still an
H-IPS panel produced by LG.Display (the same LM270WQ2 module as used in the Dell
U2711 in fact), but NEC have chosen to refer to it as a 'performance IPS' panel,
hence the p-IPS. Technically this is an 8-bit panel with Frame Rate Control on
the panel side to boost the colour depth to 1.07 billion colours. 10-bit support
does require an end to end "10-bit journey" however so it is not always possible
to put this into practice. Have a read of
this article which discusses it in more detail.
It's all very well saying a panel is capable of
10-bit colour depth (1.07 billion colour palette) as opposed to an 8-bit colour
depth (16.7 million colours), but you need to take into account whether this is
practically useable and whether you're ever going to truly use that
colour depth. Apart from the requirements of your application, operating system,
graphics card and software, one more pertinent limitation is from a display
point of view, where there must be an interface which can support 10-bit colour
depth. Thankfully the
PA271W-SV does include a DisplayPort interface capable of handling a 10-bit colour
depth. If you use the DVI interface you can only take advantage of 16.7 million
colours.
14-bit 3D LUT
Regardless of whether you have a true
10-bit colour depth being displayed, a screen with 10-bit capabilities still has
its advantages. The monitor should still be capable of scaling the colours
well, even from 24-bit sources. Most of these 10-bit panels will also be coupled
with extended internal processing which will help improve accuracy and these are
better translated onto a 10-bit panel than they would be onto an 8-bit panel,
giving less deviation and less chance of banding issues. Simple LCD monitors
work with internal signal processing with 8-bit accuracy (256 steps per primary
colour). Depending on the desired white point the intensity of one or more
channels must be reduced considerably. This can result in a considerable loss in
the amount of steps in the colours that have been reduced and this in a loss of
display quality. The result is posterization. Highlights and shadows can also be
affected.
The PA271W-SV offers a
programmable 14-bit 3D LUT to help offer smooth gradients and provide
clarity in subtle detail. As well as being 14-bits per channel, the LUT is
described here as being 3D. Whereas a typical 1D LUT adjusts colour on separate
tables for each red, green, and blue, a 3D LUT accomplishes this on a single,
mixed-colour cubic table. A 3D LUT improves the monitor's additive colour mixture
(combination of RGB), a key factor in its ability to display neutral grey tones.
This 14-bit LUT means that you have a palette of 4.3 trillion colours when using
10-bit panel capability (DisplayPort), or 65 billion when using DVI.
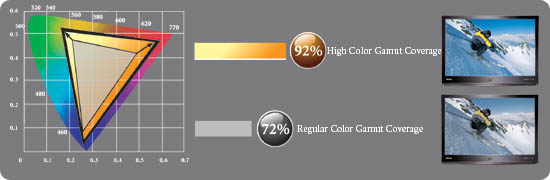
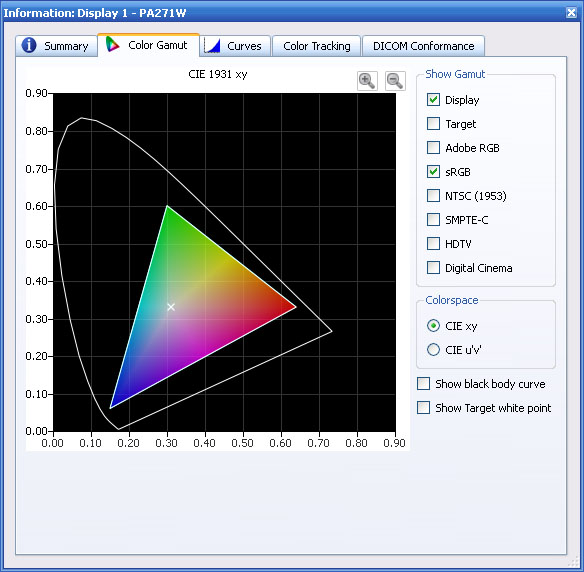
Colour Gamut
Like many modern displays, the screen uses
enhanced W-CCFL backlighting and can offer a colour gamut covering 102% of the
NTSC colour space. This also covers 97.1% of the Adobe RGB and 100% of the sRGB
gamut. The screen offers sRGB and Adobe RGB emulation modes as well which we
will look at shortly.
Testing Methodology
An
important thing to consider for most users is how a screen will perform out of
the box and with some basic manual adjustments. Since most users won't have
access to hardware colorimeter tools, it is important to understand how the
screen is going to perform in terms of colour accuracy for the average user.
I
restored my graphics card to default settings and disabled any previously active
ICC profiles and gamma corrections. The screen was tested at default factory settings using the DVI interface, and analysed using
an
X-rite i1 Pro spectrophotometer combined with
LaCie's Blue Eye Pro software suite. An X-rite i1 Display 2 colorimeter was
also used to verify the black point and contrast ratio since the i1 Pro is less
reliable at the darker end.
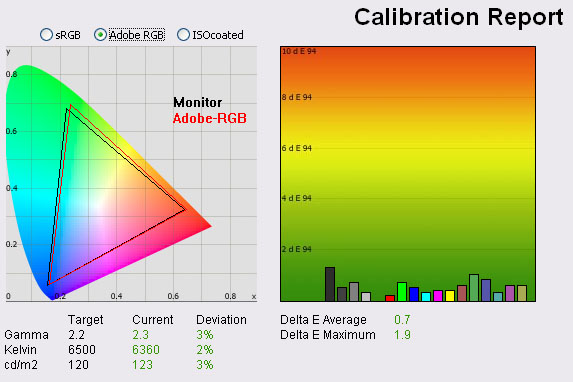
Targets for these tests are as follows:
-
CIE Diagram - validates the colour space
covered by the monitors backlighting with the black triangle representing the
display
-
Gamma - we aim for 2.2 which is the default
for computer monitors
-
Colour temperature / white point - we aim
for 6500k which is the temperature of daylight
-
Luminance - we aim for 120
cd/m2, which is
the recommended luminance for LCD monitors in normal lighting conditions
-
Black depth - we aim
for as low as possible to maximise shadow detail and to offer us the best
contrast ratio
-
Contrast ratio - we aim
for as high as possible. Any dynamic contrast ratio controls are turned off here
if present
-
dE average / maximum -
as low as possible.
If DeltaE >3, the color displayed is significantly different from the
theoretical one, meaning that the difference will be perceptible to the
viewer.
If DeltaE <2, LaCie considers the calibration a success; there remains a
slight difference, but it is barely undetectable.
If DeltaE < 1, the color fidelity is excellent.
It should be noted that I manually disabled the
ColorComp uniformity adjustment and Metamerism setting for these tests. All
other settings were left at default
Default settings of the screen were as follows:
NEC PA2471W-SV - Default Factory Settings (Adobe RGB mode)
|
Monitor OSD Option |
Default Settings |
|
Brightness |
160 |
|
Contrast |
--- |
|
Preset Mode |
Adobe RGB (1) |
|
White Mode |
6500k |


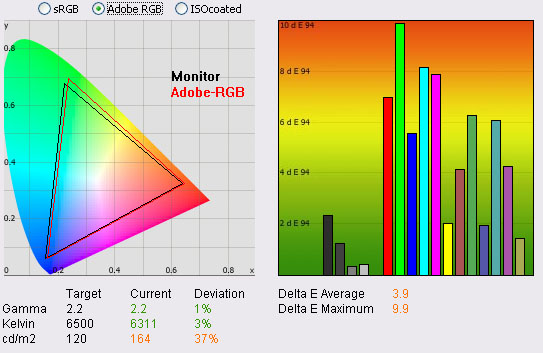
|
|
Default Settings |
|
luminance (cd/m2) |
164 |
|
Black Point (cd/m2) |
0.19 |
|
Contrast Ratio |
863:1 |
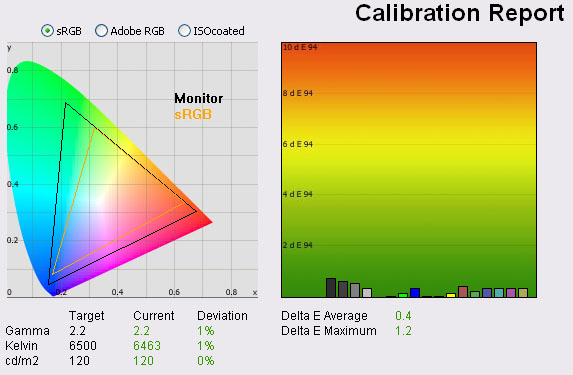
Default settings of the screen were tested first
and unlike the regular PA271W model, the default preset mode of this screen is
the Adobe RGB emulation mode. This mode is designed to slightly restrict the
screens native gamut, and bring it in line with the Adobe RGB reference which is
popular in the photography and professional image editing world. The results of
this default test were mixed. Gamma and colour temperature were well
set up and very close to the targets, being only 1% and 3% out respectively.
Unfortunately default luminance of the screen was a little too high, although
not overly bright or uncomfortable, being measured at 164
cd/m2. This
gave us a black depth of 0.19 cd/m2, and a very good static contrast
ratio of 863:1. The colour space coverage recorded by the i1 Pro
Spectrophotometer was very close to the Adobe RGB reference as well, being only
a little short in green shades. Compared to the standard full gamut of the
screen (which you can see in the 'High Bright' and 'Full' preset modes below),
the red coverage had been reduced a fair bit to bring it into the reference
space.
Colour accuracy was actually
not that great sadly, and perhaps we'd have hoped for a little more from a
professional grade screen. I suppose those buying this SV edition are certainly
going to want to carry out a full hardware level calibration and will have
access to a decent hardware calibration device. We'd seen an average dE of 2.5
from the regular PA271W in this preset mode at factory settings, but on the
PA271W-SV it was a little worse at 3.9. This ranged up to a maximum dE of 9.9.
You will certainly want to carry out a calibration of the screen to obtain a
better colour accuracy in this mode.
NEC PA2471W-SV - Default sRGB
Mode
|
Monitor OSD Option |
Default Settings |
|
Brightness |
80 |
|
Preset Mode |
sRGB (2) |
|
White Mode |
6500k |
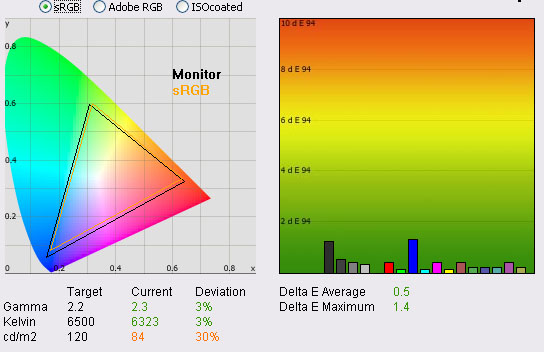
|
|
Default Settings |
|
luminance (cd/m2) |
84 |
|
Black Point (cd/m2) |
0.10 |
|
Contrast Ratio |
860:1 |
The default settings of the sRGB emulation mode
were however much better and remarkably good. The emulation mode produced a
restricted colour space which almost perfectly matched the sRGB reference as
recorded by the i1 Pro. Gamma was slightly out in this mode with a reading of
2.3 (3% deviation). White point was again within 3% of the target at 6323k, but
luminance was this time too low at only 84
cd/m2. This
gave us a low black depth of 0.10 cd/m2 and a static contrast ratio
of 860:1 which matched the Adobe RGB preset mode. Colour accuracy was excellent
in this preset mode, with a seemingly well calibrated starting point. This gave
us a dE average of 0.5 and a maximum of 1.4 which was very good. Calibration
could correct the slightly offset gamma and colour temperature but the colours
were already very accurate in this mode which was pleasing.
NEC PA2471W-SV - Default High
Bright Mode
|
Monitor OSD Option |
Default Settings |
|
Brightness |
220 |
|
Contrast |
--- |
|
Preset Mode |
High Bright (3) |
|
White Mode |
Native |
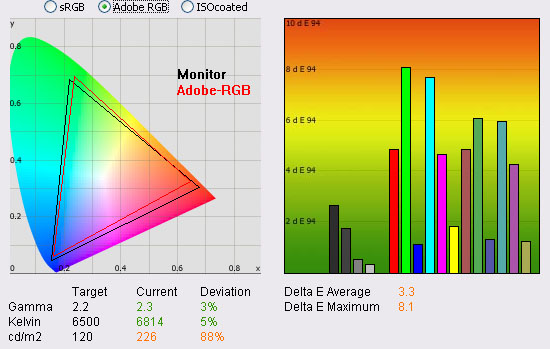
|
|
Default Settings |
|
luminance (cd/m2) |
226 |
|
Black Point (cd/m2) |
0.25 |
|
Contrast Ratio |
906:1 |
The 'High Bright' preset was just that - far too
bright at factory settings! The OSD menu brightness control was set at 220 which
yielded a luminance of 226
cd/m2 which
would definitely need adjusting to make it more comfortable. Gamma was a little
off again at 2.3 (3% deviance), and white point was 5% out at 6814k. As you can
see from the colour space CIE diagram, the red coverage was a little wider than
the Adobe RGB emulation mode had achieved, with the monitors black triangle
stretching now to cover the full range of the backlight's gamut. In this mode
black depth was 0.25 cd/m2 which gave us a slightly better contrast
ratio of 906:1. This preset mode seemed to return the best contrast ratio.
Colour accuracy was unfortunately more like the Adobe RGB mode again, with
average dE of only 3.3 and maximum of 8.1. Again calibration would be needed to
return better colour fidelity.
NEC PA2471W-SV - Default Full
Mode
|
Monitor OSD Option |
Default Settings |
|
Brightness |
160 |
|
Contrast |
--- |
|
Preset Mode |
Full (4) |
|
White Mode |
6500k |
|
|
Default Settings |
|
luminance (cd/m2) |
164 |
|
Black Point (cd/m2) |
0.20 |
|
Contrast Ratio |
834:1 |
The last mode we wanted to
test was the 'Full' mode which utilises the monitors full native gamut. I've
provided the CIE diagram of the gamut compared with the sRGB reference above as
we had compared it with the Adobe RGB reference in the 'high bright' report.
Gamma was only 2% out now with an average of 2.2. White point was a little
further off at 6114k (6% out) and luminance was again a little too high at 164 cd/m2.
This was not as severe as the high bright mode at least. With a black point of
0.20 cd/m2 we had a static contrast ratio of 834:1 which was slightly
lower than the Adobe RGB / sRGB emulation modes, and a bit further off from the
high bright mode which had returned 906:1. Colour accuracy was again poor sadly at 4.1 dE average
/ 11.6 maximum.
Software Calibration Results

I wanted to calibrate the screen in each of the
main preset modes to determine what was possible with optimum settings and
profiling. I used the
X-rite i1 Pro spectrophotometer combined with the LaCie Blue Eye Pro
software package to achieve these results and reports. An X-rite i1 Display 2
was used to validate the black depth and contrast ratios due to lower end
limitations of the i1 Pro device.
Please remember that these are all software based
graphics card profiling "calibrations" as opposed to hardware level true
calibration which we will come onto shortly. These are the normal calibration
methods we use for our monitor reviews which creates a profile which is
activated at a software level in the graphics card. This is more than adequate
for most users and is all you really need for nearly all the mainstream monitors
anyway. In fact, most don't even have the option for hardware level calibration,
so you have to make do with software profiling only. For professional use and
high end colour work these kind of profiles, although good, are not acceptable.
You need full hardware calibration which can make adjustments at a hardware
level and to the monitors extended internal LUT. This is what the high end professional
market need and want from a screen. The PA271W-SV offers the hardware capabilities
to do this form of calibration as well, which we will come onto shortly.
NEC PA271W - Software Calibrated Settings - Preset Mode 'Adobe
RGB'
|
Monitor OSD Option |
Adjusted Setting |
|
Brightness |
120 |
|
Contrast |
--- |
|
Preset Mode |
Adobe RGB (1) |
|
White Mode |
6500k |
|
|
Calibrated Settings, 'Adobe
RGB' Mode |
|
luminance (cd/m2) |
120 |
|
Black Point (cd/m2) |
0.15 |
|
Contrast Ratio |
824:1 |
Calibration in the Adobe RGB preset mode was a
good change from default settings. Colour temperature was less than 0.5%
deviation now at 6496k, and gamma was an average of 2.2 being only 1% out.
These settings had already been good at default anyway. Colour accuracy was
significantly improved, with dE average now 0.5 (down from 3.9 at default).
dE maximum was also only 1.2 (down from 9.9) which was again a great result.
LaCie would consider
colour fidelity to be excellent across the whole range. This was a very good
result and exactly what you would expect and hope for from a high end screen
such as this.
Black depth was still very good at 0.15
cd/m2 giving us
a static contrast ratio of 824:1. This shows calibration in the
Adobe RGB preset can produce some very good results if you want to work in this
colour space more closely.
Our calibrated settings and profile are available if you want to try them on
your PA271W-SV screen in
our ICC profile database.
NEC PA271W-SV - Software Calibrated Settings - Preset Mode
'sRGB'
|
Monitor OSD Option |
Adjusted Setting |
|
Brightness |
120 |
|
Contrast |
--- |
|
Preset Mode |
sRGB (2) |
|
White Mode |
6500k |
|
|
Calibrated Settings, 'sRGB'
Preset Mode |
|
luminance (cd/m2) |
120 |
|
Black Point (cd/m2) |
0.14 |
|
Contrast Ratio |
828:1 |
I calibrated the screen in the sRGB preset mode as
well. The gamma, colour temperature and luminance targets were met almost spot
on in every case. This process had improved the default luminance of 84
cd/m2 through
the adjustment of the OSD brightness control to 120. Contrast was retained as well and
at 828:1 was very similar to the Adobe RGB mode. Colour accuracy had improved
ever so slightly from the already excellent default settings, now down to 0.4 /
1.2 (from 0.5 / 1.4). This preset can be used if you want to work in the more
restricted sRGB colour space and the emulation is very good here. Again, ICC profile available if you want it in
our ICC profile database.
NEC PA271W-SV - Software Calibrated Settings - Preset Mode 'High
Bright'
|
Monitor OSD Option |
Adjusted Setting |
|
Brightness |
125 |
|
Contrast |
--- |
|
Preset Mode |
High Bright (3) |
|
White Mode |
Native |
|
|
Calibrated Settings, 'High
Bright' Mode |
|
luminance (cd/m2) |
120 |
|
Black Point (cd/m2) |
0.14 |
|
Contrast Ratio |
857:1 |
I then set the screen in its 'High Bright' mode. White
mode (colour temperature) was left in 'Native' mode as per the default settings
which we had already established was very close to the target of 6500k in this
preset.
Calibration was a great success. Gamma had already
been quite accurate at default factory settings (2.3) but was corrected to the
target of 2.2 after calibration
as one would hope. Colour temperature was excellent at 6522k (<0.5% out) although
this was already good out of the box in the native mode (5% out). Luminance was now a
perfect 120
cd/m2 with OSD
brightness set at 125. This gave us a good black depth of 0.14 and contrast
ratio of 857:1. Best of all, colour accuracy was now excellent, with
average dE at 0.4 and maximum only at 1.5. This was improved significantly from the
default of 3.3 average / 8.1 maximum in this preset mode.
You can use our settings and calibrated ICC
profile on your PA271W-SV as well if you want. See
our ICC profile database for more information.
NEC PA271W-SV - Software Calibrated Settings - Preset Mode 'Full'
|
Monitor OSD Option |
Adjusted Setting |
|
Brightness |
120 |
|
Contrast |
--- |
|
Preset Mode |
Full (4) |
|
White Mode |
6500k |
|
|
Calibrated Settings, 'Full'
Preset Mode |
|
luminance (cd/m2) |
120 |
|
Black Point (cd/m2) |
0.15 |
|
Contrast Ratio |
820:1 |
I changed back to the 'Full' preset mode and
calibrated the screen. Again, this produced pleasing results in most
regards. Gamma was spot on at 2.2 average. Colour temperature was now 6513k,
being only <0.5% out from the target of 6500k. This corrected the 6%
deviation we saw in colour temperature at default settings in this preset. With
a luminance at 120
cd/m2 as hoped,
black depth was a very good 0.15 cd/m2, giving a slightly lower static contrast
ratio than we had reached in the 'High Bright' mode of 820:1 but in keeping with
the Adobe RGB and sRGB modes. This was a similar
pattern to what we saw in the default high bright vs. full modes. Colour accuracy
was again corrected very nicely, with dE average of 0.4 (down from 4.1 default)
and a maximum of only 1.3 (down from 11.6). The colour accuracy matched the calibrated 'High Bright' preset,
and so both were very good in this regard. I'd
recommend using the 'High bright' mode instead of the 'full' mode to achieve the best results from a
graphics card LUT correction perspective as it offers a slightly better contrast.
If you want a smaller colour space the Adobe RGB and sRGB modes work very well
too.
Again, ICC profile available if you want it in
our ICC profile database.
I tested the screen using various colour gradients
in all of these preset modes
which showed smooth transitions and no apparent banding. There was some
slightly noticeable gradation in darker tones which I would expect are eliminated if you
can take advantage of the 10-bit panel depth (8-bit +AFRC). Unfortunately I do not
have the means to fully test the 10-bit capability of the p-IPS panel.
Hardware Calibration Results
We also now wanted to test the calibration
performance of the screen with the LaCie software carrying out full hardware
level alterations to the monitors LUT. This was not possible with the regular
PA271W when we tested it, but with the combination of the SV edition of the
screen, and LaCie's latest v4.5.6 software we could make these changes.
When you carry out the process, the software
detects you have a compatible monitor and you will notice in the above screen
shot that it includes a section verifying that it is connecting to the monitor.
I carried out the calibration using the i1 Pro spectrophotometer which took
around 10 mins 15 seconds to complete. Afterwards I verified the calibration
using the normal test and report function.
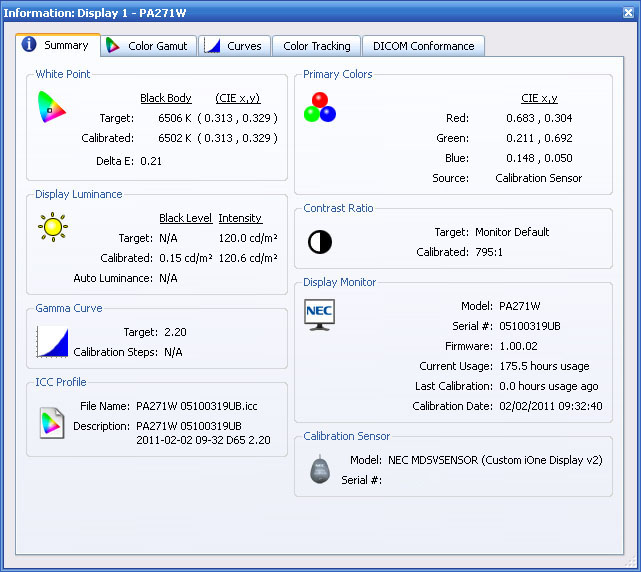
NEC PA271W-SV - Hardware Calibrated Settings
LaCie Blue Eye Pro + i1 Pro Spectrophotometer
|
Monitor OSD Option |
Adjusted Setting |
|
Brightness |
n/a |
|
Contrast |
--- |
|
Preset Mode |
SpectraView II (5) |
|
White Mode |
n/a |

|
|
Calibrated Settings,
Hardware LUT |
|
luminance (cd/m2) |
120 |
|
Black Point (cd/m2) |
0.16 |
|
Contrast Ratio |
765:1 |
Once the LaCie software detects you have a
compatible monitor it automatically switches to the programmable preset mode
(number 5) which gets named in the OSD menu as 'SpectraView II', after NEC's own
software. As you can see, the calibration was a great success, reaching the
targets very accurately. Contrast was a little lower than the software
calibrated tests, now being 765:1 (as opposed to ~825:1). dE was now 0.4 average
and 1.5 maximum which was very pleasing. We will talk more about the benefits of
hardware calibration and take a look at NEC's own software in the following
sections.
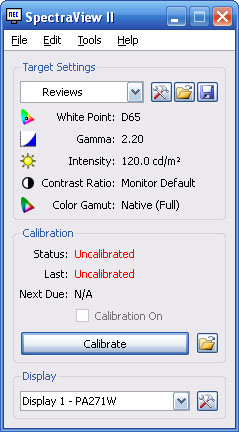
SpectraView
Profiler
To take full advantage of the screen for
calibration and profiling, NEC have built in a hardware calibration feature
which allows you to make corrections to the monitors 14-bit 3D LUT. This can provide even
better colour accuracy and allows you to store your calibration in the screens
hardware. Professional markets and those working with colour critical content
require this kind of high end hardware calibration so this is one of the reasons
this screen separates itself from the more mainstream models. NEC have their own specific software for this
hardware calibration which is called SpectraView.
There are actually two versions of this software, both offering different
capabilities in terms of the calibration possible.

In Europe the "SpectraView Profiler" software is
provided
by BasICColor who offer a free 14 day license for the full version of the
software. After speaking with NEC Europe to clarify we discovered that this
software allows three levels of calibration of the PA series, depending on
whether you have bought the regular PA monitor or the special SpectraView II edition
in European countries. The latter is referred to over here as the NEC PA271W-SV
or the 'SpectraView Reference 271". It comes at a higher cost but is aimed at
users who require that extra level of specialist performance and high end
professional application. I would like to emphasise that there are significant
differences between the regular PA271W and the SV edition of the screen,
something which every NEC representative highlighted to me during our
conversations.
The SV model in Europe was produced in addition to
the regular PA model because of the high demands of the European market and the
expectations they have when it comes to high end professional screens. NEC
therefore offer the SV version which include panels which have reportedly been hand picked
and selected to be the absolute top end in terms of dE performance, gamma
correction etc. These are then tuned and altered to enhance the performance even
further, with advanced adjustments being made in the factory to ensure these are
the absolute cream of the crop. The SV model is then packaged with a calibration hood,
SpectraView Profiler software and a factory report validating the
performance of the panel selected and confirming the tuning completed. It is not
packaged with a hardware colorimeter in Europe so you would need to already own
one or plan to purchase one for proper calibration. The SV models do come with a
6 month pixel defect guarantee as well. The normal PA version does not go
through this extra process and does not come with the additional extras.
Also, importantly for calibration the PA271W regular
edition and PA271W-SV have a slight firmware difference which allows for
different levels of calibration. The PA271W only allows you to use the European
software to calibrate at a software (graphics card LUT) level alone, or at a
hard/software level which also controls limited monitor settings such as
brightness and the RGB channels automatically. It does not however control the
monitors 14-bit LUT and the option for "hardware calibration" within the
software is greyed out. If you purchase the SV version of the screen, the
firmware communicates with the software automatically and the software will then
allow full calibration of the monitor's LUT. We of course have the SV edition of
the screen here so we are able to test the full hardware calibration with this
software now. I would also note that the SV Profiler software communicates with
the SV edition of the screen and will not request you to install a license file
or anything. It knows you are using the SV screen and the software just works.
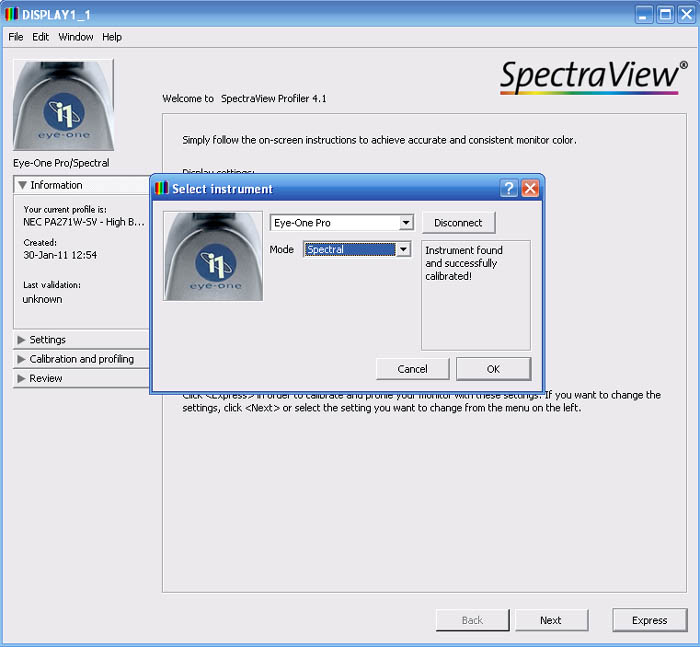
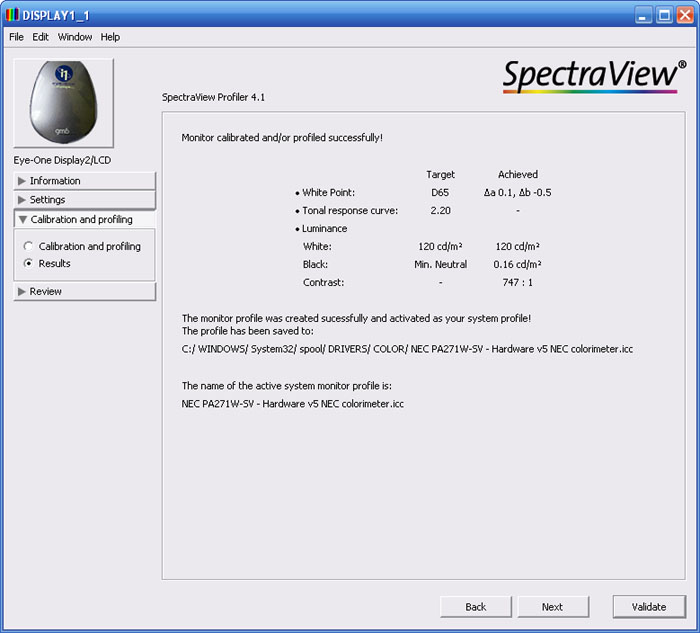
I installed the latest version of the SpectraView
Profiler European software which was v4.1.24 and I'll give you a quick tour as well as
some calibration results. When you load up the software you are presented with
various options which you can configure before carrying out a calibration of
your screen. The information section confirms your current active profile (here
just showing one I had just made with LaCie's software) along with your defined
calibration targets. You can select the device being used to calibrate the
screen from the top left, and here we have selected the i1 Pro
Spectrophotometer.
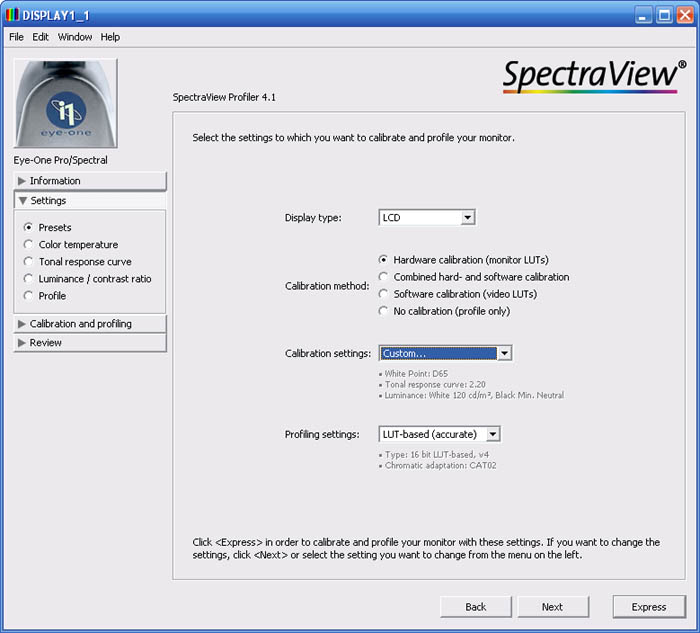
Entering the settings menu gives you a whole range
of options. I won't go through them all as they are self explanatory really. You
will see that within the 'presets' section you can choose the calibration
method. As I've already explained, full hardware calibration is now available as
we are using the SV edition of the screen so I have selected it here. Within the
luminance/contrast ratio section you can set the targets for white and black, as
well as do a quick simple measure of the current settings. You will see here that we are aiming for 6500k white point,
2.2 gamma and 120
cd/m2
luminance. Settings can be defined in the menu on the left. We took a look at a
few more sections of this software in our
PA271W review, so I won't repeat them here. I entered the calibration
section on the left and proceeded with the process to calibrate the
screen at a hardware level.
The screen automatically enters a preset mode
which is labelled as 'programmable 3'. The brightness and RGB settings are then
not available for manual adjustment in the OSD as the software has controlled
these while calibrating. The process itself takes around 8 mins 40 secs to
complete using the i1 Pro, with the sample window displaying the usual white,
black, grey and coloured images in front of the colorimeter in order to adjust
white point, luminance, grey balance etc. The entire process was automatic,
including adjustments of the backlight (brightness setting), RGB channels and
full adjustments to the monitors 14-bit 3D LUT.
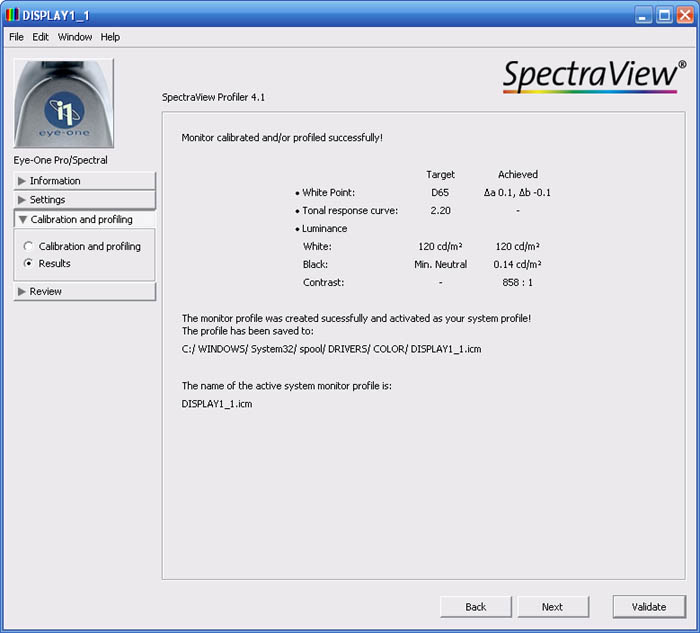
At the end you are presented with the above screen
which confirms the screen has been calibrated successfully. There is an option
there to further validate the results which will give you more measurements. A
note I would like to make is that the contrast ratio and black depth
measurements shown here may not be reliable as the i1 Pro has a measurement
limit at the low end of 0.20
cd/m2 and so we
will validate these readings using an i1 Display 2 colorimeter (which can
measure down to 0.02 cd/m2 with accuracy) in our tests in a
moment, using our usual LaCie reports. For now, ignore the black depth and
contrast ratio measurements from the SV Profiler software as the i1 Pro is too
limited at the lower end, and we are using that device to carry out this
calibration.
Note: From what I could tell, the SV
Profiler software does not allow you to change any of the monitor OSD settings
from within it. If you carry out this calibration it will enter you into the
Programmable preset mode. The default ColorComp (uniformity compensation)
setting for this preset is "level 5" and within the Programmable preset mode,
you cannot change this in the OSD, even from the advanced menu section. So what
I'm saying is, if you calibrate using this software you will be stuck on
ColorComp level 5 normally. This does improve uniformity (see
further down) but does negatively impact contrast ratio. To overcome this, you need to enter into the
SV II software which we will
look at in a moment, which does allow you to change the monitor settings from
within it. Here you can turn off the ColorComp within the Programmable preset
mode. The results above and below are based on ColorComp having being turned off
first, so as not to impact contrast ratio.
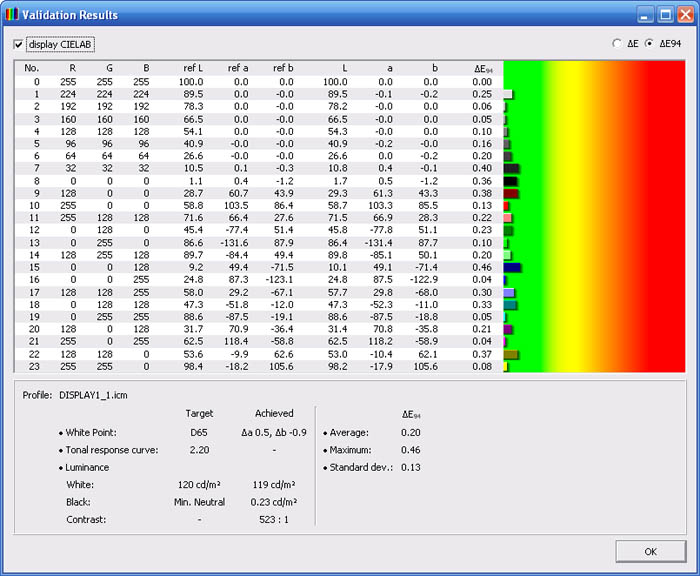
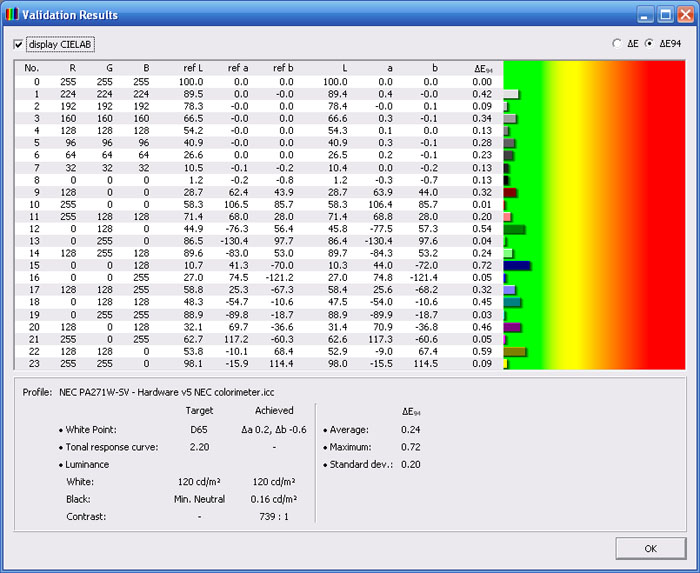
The validation process presents you with a summary
report like the above. As you can see, this report now includes details dE
information relating to colour accuracy. Average dE was recorded at 0.20, with
maximum of only 0.46. Colour fidelity would be considered excellent all round,
and the calibration seemed to offer excellent results. You may notice that the
contrast ratio / black point recorded here in this validation is significantly
less than the initial report above (which gave us a contrast ratio of 858:1).
This discrepancy can probably be put down to the low light accuracy of the i1
Pro which doesn't really read below 0.20
cd/m2 properly.
I will validate the results again using the i1 Display 2 colorimeter in a moment
but as I've already said, ignore the black depth/contrast ratio measurements
from the SV Profiler software for now. There is also a report showing the
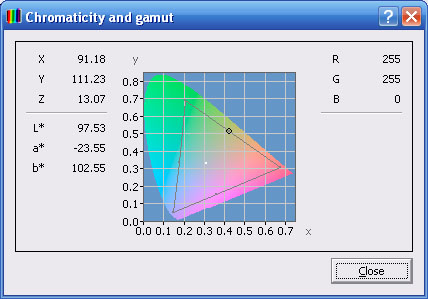
chromaticity and gamut of the screen accessible through the 'window' sub-menu of
the software which I've included above.
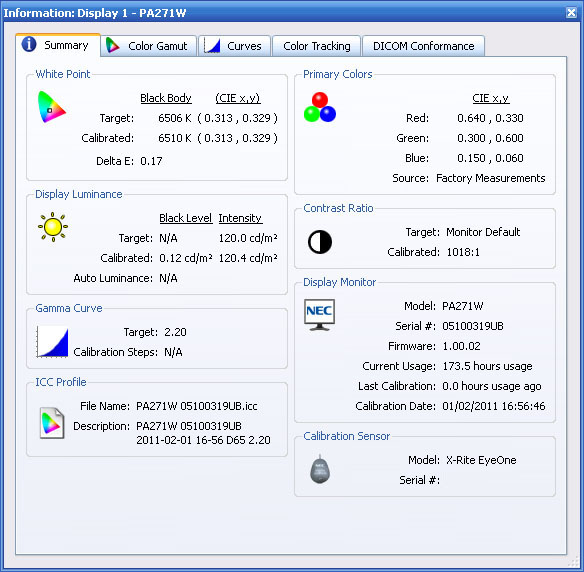
NEC PA271W-SV - Hardware Calibrated Settings
SpectraView Profiler + i1 Pro Spectrophotometer
|
Monitor OSD Option |
Adjusted Setting |
|
Brightness |
n/a |
|
Contrast |
--- |
|
Preset Mode |
Programmable 3 (5) |
|
White Mode |
n/a |

|
|
Calibrated Settings,
SpectraView Profiler Euro |
|
luminance (cd/m2) |
119 |
|
Black Point (cd/m2) |
0.15 |
|
Contrast Ratio |
773:1 |
I ran the LaCie test and report feature on our
newly calibrated profile to see what it thought of the results as well.
Obviously there will be some deviation between different sets of software and
it's probably arguable which is more accurate here anyway, but I include it for
reference since we have used it throughout all our reviews and tests. The LaCie
report confirmed the results shown from the SpectraView Profiler package. Gamma,
colour temperature and luminance were all corrected nicely. We had a black depth
of 0.15 validated by the i1 Display2 colorimeter, giving a contrast ratio of 773:1 which
is only a little less than the software calibrated profiles we'd created in the
'Full', Adobe RGB and sRGB preset modes (~820:1). Colour accuracy was confirmed to be very
good with average dE of 0.5. Maximum was listed up to 1.3, but overall an excellent and
impressive result. Colour gradients were very smooth with no visible banding or
issues.
For more information about this software you
may also want to see our
PA271W review
SpectraView II

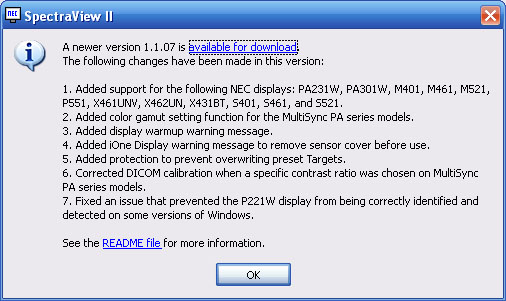
The other thing I wanted to take a look at is the
USA version of the SpectraView II software, available from
NEC's
US website. We tested this
with the PA271W before and this software does allow hardware level
calibration of both the regular and SV editions of the screen. The European
SpectraView Profiler software can only carry out full hardware calibration when
combined with the SV version of the screen, but the US SpectraView II software
can work with either fine. This is an NEC in-house piece of software.
I first
updated to the latest v1.1.07 of the software and then loaded it up for testing.
The above confirms the changes made in the latest version for those interested.
The addition of control over the colour gamut is an interesting new feature
which I'll test in a moment.
I won't go over all the options and features of this SV II software again as we
covered it in detail in our
PA271W review if you want to know more. We defined our target settings as
normal and within the settings we opted for the highest possible accuracy using
52 steps for profile creation and selecting best grey scale colour tracking as
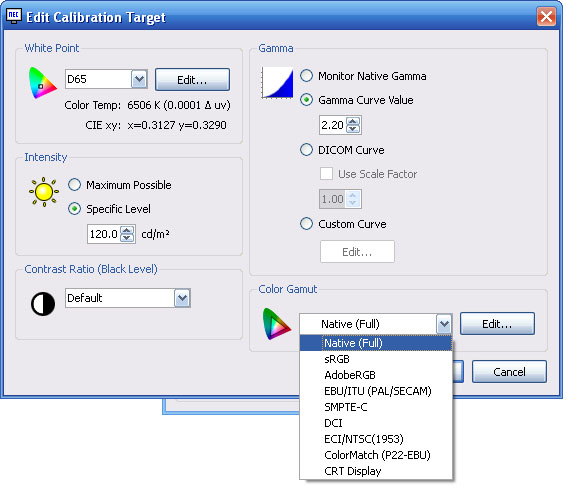
the calibration priority. You will see from the above screenshot that NEC have
added a function to define the target colour gamut, which includes options for
sRGB and Adobe RGB. For now I will calibrate with full native gamut, but will
test some other options afterwards. We did also disable the ColorComp feature
accessible through this software. As far as we can tell, this is the only way
you can control the ColorComp for the 'SpectraView / programmable' preset mode
as it cannot be controlled via the OSD menu once the screen has entered this
preset.
The left hand image confirms your target settings
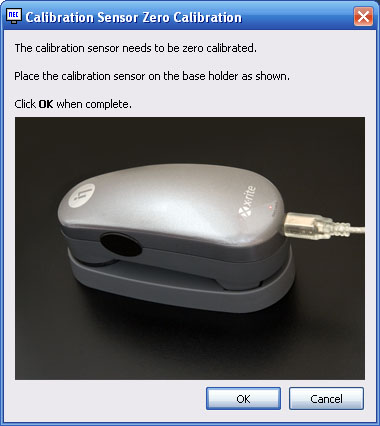
for the calibration. As with other software packages, if you use the i1 Pro it
must first be calibrated to a zero point using the provided white tile stand.
The SV II software asks you to do this (right hand image) as you set everything
up or before you start a calibration of your monitor.
I restored my graphics card and screen to default
settings to perform a calibration with the SpectraView II software. As you
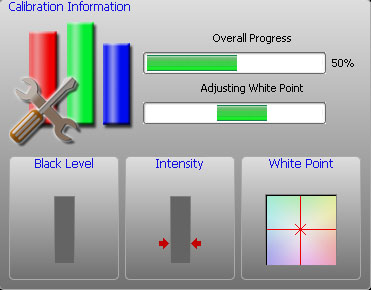
follow through the calibration process you are prompted to place your
calibration device in the centre of the screen to begin. A fairly small sample circle
appears to carry out the calibration behind where you have placed the device.
The rest of the screen is black and a progress indicator is shown in the top
left hand corner like the one above. This shows you an overall progress as well
as various steps to adjust brightness, white point etc. At a setting of 52 steps
this whole process took around 2 minutes 30 seconds to complete with the i1 Pro, but is all automated.
As with the
European software, the whole process is automated and the screen automatically
enters into the "5" preset mode which is then named 'SpectraView II'.
The options in the brightness and RGB menus are then not available. Like the
Euro software, the package makes these adjustments for you as well as a full
adjustment to the internal 14-bit LUT. As a reminder, that is only possible with
the Euro software when using the SV version of the screen as we have here, and
not with the regular PA271W model.
At the end of the process you are presented with
the above summary screen. It confirms your calibrated settings and the tabs in
this screen can be used to validate other aspects of the calibration. Again
ignore the black depth / contrast ratio measurements presented here as there are
limitations with the i1 Pro at the lower end. I will test these in the LaCie
reports using an i1 Display 2 instead.
The colour gamut is also shown relative to a
selected reference colour space, in this instance shown by the blue triangle of
the sRGB colour space.
The gamma curves are also available showing the
target and calibrated results. In this instances the lines are very accurate
showing a good calibration result.
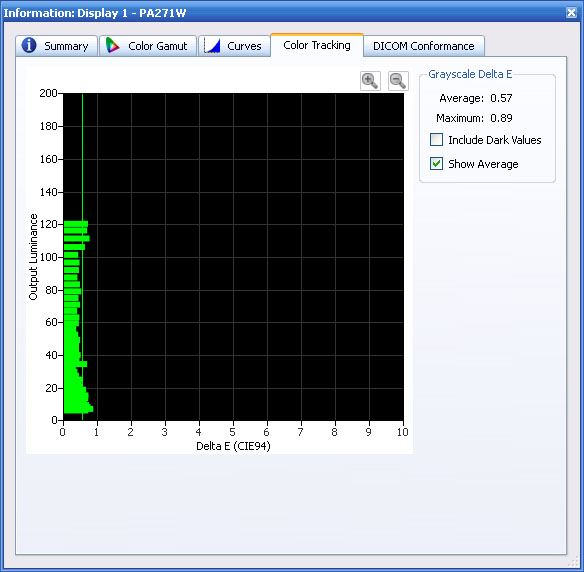
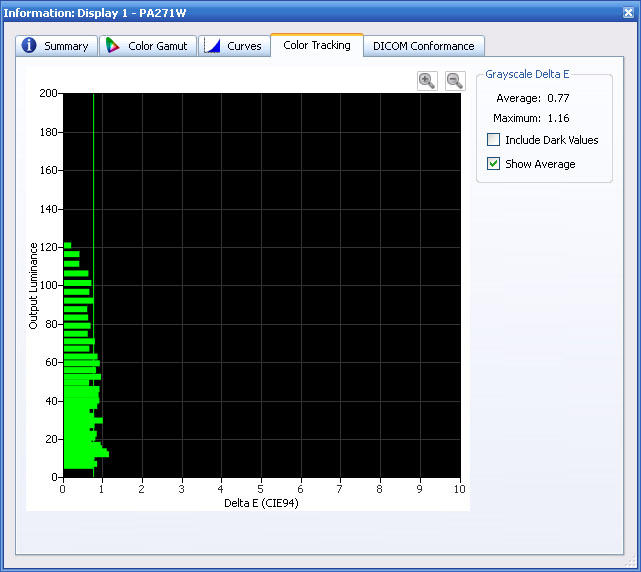
The color tracking tab gives you a report of the
greyscale deltaE achieved. On average dE was 0.57, ranging up to 0.89 maximum. A
very good result. I will run LaCie's test and report as well to see what that
software thinks of the calibrated state.
NEC PA271W-SV - Hardware Calibrated Settings
SpectraView II + i1 Pro Spectrophotometer
|
Monitor OSD Option |
Adjusted Setting |
|
Brightness |
n/a |
|
Contrast |
--- |
|
Preset Mode |
SpectraView II (5) |
|
White Mode |
n/a |

|
|
Calibrated Settings,
SpectraView II USA |
|
luminance (cd/m2) |
120 |
|
Black Point (cd/m2) |
0.16 |
|
Contrast Ratio |
756:1 |
Again LaCie's software confirms the calibration
was a great success with all targets met very well. Validation with an X-rite i1
Display 2 colorimeter allowed us to measure a black depth of 0.16 cd/m2
which gave us a static contrast ratio of 756:1. This was very similar to the
results we'd achieved with the SV Profiler software (773:1) but a little lower
than our software calibrated profiles, 857:1 being the highest when in the 'high
bright' preset. This was still a respectable performance though. Colour accuracy
was confirmed as being excellent, with average dE of 0.4 and maximum of 1.2.
Again this SV II software can produce very good results and is simple and easy
to use.
For more information about this software you
may also want to see our
PA271W review
Calibrating Colour Spaces
We have tested the software calibration using the
i1 Pro and LaCie's software in each of the standard preset modes of this screen
- High Bright, Full, Adobe RGB and sRGB. All returned accurate results once they
had been profiled at a software level and through the creation of an ICC profile
for the graphics card. The sRGB and Adobe RGB modes also gave us a decent
emulation of the smaller colour spaces which is very useful for those who need
to work with anything other than the full native gamut (102% NTSC coverage).
When we hardware calibrated the monitor using the i1 Pro again, the NEC Profiler
software does not allow you to define anything other than the native gamut of
the screen for your target. The software will allow you to successfully
calibrate the internal hardware LUT to a high standard, but you cannot do so
while also using a smaller colour space such as Adobe RGB or sRGB. Until now,
the same could be said for NEC's SpectraView II software. However, as we covered
briefly in the
SpectraView II section of this review, NEC have now introduced an option in
their latest v1.1.07 software to define the target colour space as well.
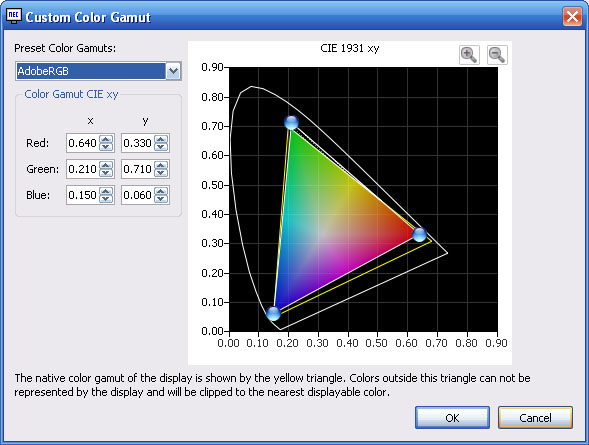
You can define the target colour space within the
'edit > target' menu. You can see the options available above, and we will test
the sRGB and Adobe RGB here as they are both common standards.
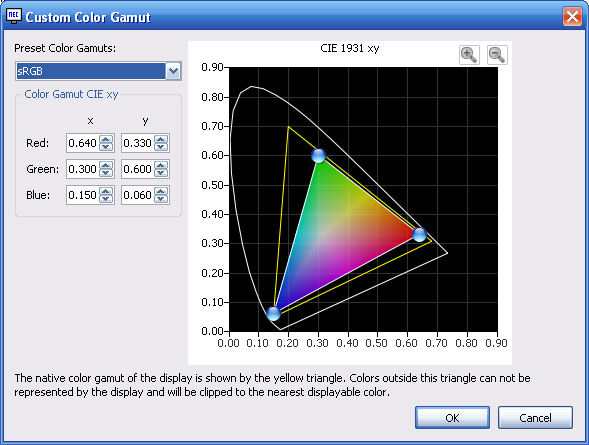
You can even edit each of these colour spaces at a
very precise x/y level for each of the RGB channels for absolute calibration
accuracy. For now we will stick with the pre-defined sRGB and Adobe RGB targets
in the software. I followed the process through as before and all changes were
automated, with the screen entering into the 'SpectraView II' mode in the OSD
menu.
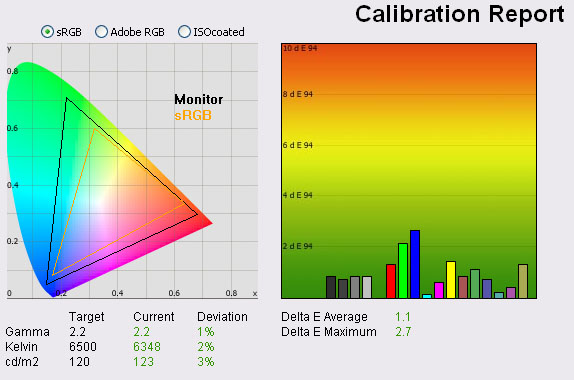
sRGB Gamut - I first calibrated to
the sRGB gamut. The above report confirms the results of the calibration. As
before, ignore the black level / contrast ratio figures here as the i1 Pro is
not reliable enough and the numbers are skewed a lot. I will validate in the
final LaCie report using an i1 Display 2 to get an accurate contrast figure.
This report confirmed the white point (colour temperature) was calibrated to
6510k so almost spot on to the target.
The colour gamut tab confirms that the calibration
had successfully set the screen at a hardware level to the sRGB colour space.
This was a very welcomed addition to the software and it should now allow you to
carry out a full hardware LUT correction with a defined colour space of your
choosing.
NEC PA271W-SV - Calibrated Settings - sRGB Colour Space
SpectraView II + i1 Pro Spectrophotometer
|
|
Calibrated Settings,
SpectraView II sRGB |
|
luminance (cd/m2) |
119 |
|
Black Point (cd/m2) |
0.16 |
|
Contrast Ratio |
759:1 |
As you can see, the LaCie report confirms the
reduction in the colour space to sRGB as we had hoped and was identical to that
we obtained from the monitors standard sRGB emulation mode. All other targets
were met nicely, although the colour accuracy was not quite as low as we had
seen when hardware calibrating to the native gamut. This could be minor software
discrepancies of course, but the results were still very good, with a dE average
of 1.0 here. We validated the black depth with an i1 Display 2 which returned us
a static contrast ratio of 759:1, practically the same as we'd seen from the SV
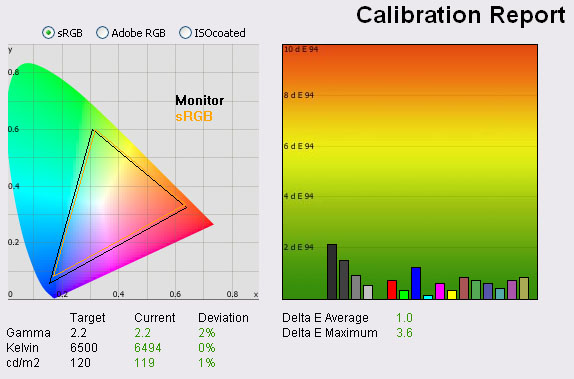
II calibration at native gamut.
Adobe RGB Gamut - I went back into
the target settings and defined the Adobe RGB colour space as our target for the
next calibration.
Again, you can manually adjust the parameters if
you wish or need to tweak anything.
The report after the calibration confirms the
white point was again very accurate at 6525k. This time black depth and contrast
ratio were not even listed, an indication that the i1 Pro is struggling at the
lower end. Again I'll confirm these figures in the LaCie report in a moment.

The colour gamut tab confirms the colour space has
been matched to the Adobe RGB reference. We will test this calibrated state with
the LaCie software as well now.
NEC PA271W-SV - Calibrated Settings - Adobe RGB Colour Space
SpectraView II + i1 Pro Spectrophotometer
|
|
Calibrated Settings,
SpectraView II Adobe RGB |
|
luminance (cd/m2) |
123 |
|
Black Point (cd/m2) |
0.16 |
|
Contrast Ratio |
784:1 |
Again the colour space has successfully been
reduced to be much closer to the Adobe RGB reference. The colour space of the monitor here (black triangle)
matches the report from the preset Adobe RGB emulation mode exactly, so again
this target in the SV II software had reached the same colour space
successfully. The other targets were met nicely, although there was some slight
variance in gamma (3%) and white point (2%) perhaps down to a difference between
the software. Colour accuracy was again confirmed as very good at 0.7 dE
average. Again, not quite as low as the hardware calibration at native gamut,
but still excellent. The i1 Display 2 confirmed contrast ratio was 784:1, again
very similar to the hardware calibrated native gamut and sRGB gamut modes.
Once calibrated it is easy enough to switch
between the colour spaces from within the SV II software without needing to go
through the whole calibration process again. You just choose your target
settings from the drop down box, and those with a green tick next to them show
they have been calibrated. The screen changes to the different state (and colour
space) quickly and you're away.
NEC Wide Gamut Colorimeter - MDSVSensor2
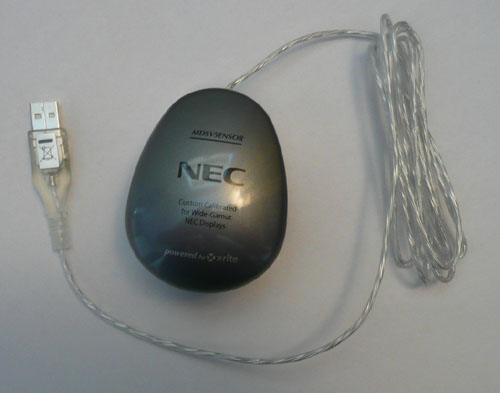
As an optional extra, NEC offer a special
colorimeter package for use with the PA series of screens (and other wide gamut
monitors in their range). This device is referred to as the 'MDSVSensor2' (Medical
Display SpectraView Sensor 2) and is a customised X-rite i1 Display 2
colorimeter. Unlike standard i1 Display 2 devices, which are set up for use with
standard gamut screens, this NEC device has been optimised for use with NEC's wide
gamut displays. On the front is an NEC logo and a sentence explaining it has
been "custom calibrated for wide-gamut NEC displays". Apart from that it looks
like a regular i1 Display 2. The customised device has been programmed
internally with correction matrices for use with NEC's wide gamut displays. As
such it has been tweaked to offer compatibility and accuracy with these
screens.
1) SpectraView Profiler Software - We wanted to test this device with the PA271W-SV,
again using the SpectraView Profiler software. This time within the settings
menu we selected the i1 Display 2 device and set the usual targets for
calibration. ColorComp was again disabled from within the SV II software as we
talked about earlier, as with this enabled it can impact contrast.
The calibration was carried out with full hardware
LUT adjustments and was totally automated as before. At the end we were
presented with the above summary report. We went into the validation function to
get more detail:
As you can see, the calibration was a great
success. Since we were now using the i1 Display 2 we could rely on more accurate
low level readings and so the black depth (0.16) and contrast ratio (739:1)
recorded here were reliable. The other targets were met very well also and dE was
very similar to the calibration using the i1 Pro had been. Average dE was 0.24
(0.20 with i1 Pro) and maximum was 0.72 (vs. 0.46). Very close of course,
but it does go to show that the device works very well with this screen.
NEC PA271W-SV - Hardware Calibrated Settings
SpectraView Profiler + NEC i1 Display 2

|
|
Calibrated Settings,
SpectraView Profiler |
|
luminance (cd/m2) |
119 |
|
Black Point (cd/m2) |
0.16 |
|
Contrast Ratio |
748:1 |
The LaCie software confirmed the results were
indeed very good. Targets were met nicely, and contrast ratio was also recorded
here at 748:1. This was pretty much the same result as we had achieved with the
i1 Pro + SpectraView Profiler hardware calibration (773:1). We had
achieved up to 857:1 through software calibration but this hardware calibration is obviously far more accurate and I suspect the
contrast is sacrificed a bit for better grey scale tracking and finer
adjustments to the LUT. Colour accuracy was confirmed as being excellent again,
actually being ever so slightly better than the readings from the i1 Pro tests
(0.3 vs 0.5 and 1.1 vs 1.3). This slight different could of course be software
discrepancies but the LaCie report does confirm the calibration was a great
success.
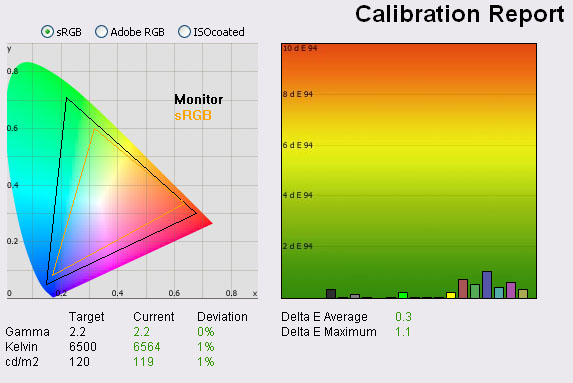
2) SpectraView II Software - We also
carried out a full hardware calibration using The USA SpectraView II software.
We stuck with the full native gamut of the screen and followed the process
through using the NEC i1 Display 2 device.
The above summary results confirmed targets were
met well, with an accurate white point and a good contrast ratio achieved of
795:1. This was slightly higher than we had reached with the NEC SV Profiler
software (~748:1) in fact. You will notice that the software identifies the
calibration sensor as the NEC MDSVSensor (custom iOne Display v2).
The colour tracking tab confirms colour accuracy
was again very good after calibration, with an average dE of 0.77 and maximum of
1.16. We had achieved slightly better results when using this software with the
i1 Pro (0.57 dE average / 0.89 max) which is a similar pattern to what we saw
when using the SV Profiler software. Nevertheless, calibration was excellent.
NEC PA271W-SV - Hardware Calibrated Settings
SpectraView II + NEC i1 Display 2
|
|
Calibrated Settings,
SpectraView II USA |
|
luminance (cd/m2) |
123 |
|
Black Point (cd/m2) |
0.16 |
|
Contrast Ratio |
771:1 |
The report from LaCie's software confirmed a good
result. There was a slightly lower white point at 6348k than we had aimed for in
the calibration, and colour accuracy was not quite as good as we had seen when
calibrated with the i1 Pro device and SV II software (1.1 dE average here vs.
0.4 before). Contrast was confirmed as being 771:1 which is very similar to that
achieved with the SV Profiler software and NEC colorimeter device.
3)
LaCie Blue Eye Pro Software - I also carried out a hardware calibration
using this device, but combined with the LaCie Blue Eye Pro software, again
calibrating at a hardware level for maximum performance and accuracy.
NEC PA271W-SV - Hardware Calibrated Settings
LaCie Blue Eye Pro + NEC i1 Display 2

|
|
Calibrated Settings,
SpectraView II USA |
|
luminance (cd/m2) |
120 |
|
Black Point (cd/m2) |
0.17 |
|
Contrast Ratio |
705:1 |
Again the results of this hardware calibration
were excellent. Targets were met very well indeed. We did have a slightly lower
contrast ratio when using the LaCie software of 705:1 but still this was good.
Colour accuracy was excellent as well, with average dE of 0.3 and maximum of
1.2.
Conclusions - Overall I was pleased with the results obtained
with the NEC customised i1 Display 2. It seems that when combined with a
compatible screen like the PA series, the results obtained are actually very
similar to the i1 Pro spectrophotometer. This is very impressive considering
it's about a 10th of the price of course. Being set up and calibrated for use
with a certain range of screens should ensure a high level of accuracy and so
this would make a good solution for someone purchasing the PA271W-SV or another
of the range and wanting to carry out calibration. If you're bothering to buy
the SV version of the screen then you will want some calibration device
certainly. Of course a high end spectrophotometer like the i1 Pro is more
versatile for a wide range of devices, technologies, backlights and screens, but
the i1 Display 2 is still a very capable colorimeter device at an affordable
cost.
Calibration
Performance Comparisons
I thought it would be useful to summarise the
results from each of these preset mode calibrations in one place. The results of
the SpectraView calibrations are recorded using the LaCie reports in order to
keep all of these uniform:
|
Calibration
Type and Instrument |
Preset Mode /
Software |
Deviance from target (%) |
Black depth
(cd/m2) |
Contrast Ratio |
Ave. dE |
Max dE |
|
Gamma |
Colour Temp |
Lum |
|
Software LaCie
with i1 Pro
|
High Bright |
0 |
0 |
0 |
0.14 |
857:1 |
0.4 |
1.5 |
|
Full |
0 |
0 |
0 |
0.15 |
820:1 |
0.4 |
1.3 |
|
Adobe RGB |
1 |
0 |
0 |
0.15 |
824:1 |
0.5 |
1.2 |
|
sRGB |
0 |
0 |
0 |
0.14 |
828:1 |
0.4 |
1.2 |
|
Hardware + i1 Pro |
LaCie Blue Eye |
0 |
0 |
0 |
0.16 |
765:1 |
0.4 |
1.5 |
|
Hardware + NEC |
LaCie Blue Eye |
0 |
0 |
0 |
0.17 |
705:1 |
0.3 |
1.2 |
|
Hardware + i1 Pro |
SV Profiler |
1 |
0 |
1 |
0.15 |
773:1 |
0.5 |
1.3 |
|
Hardware + NEC |
SV Profiler |
0 |
1 |
1 |
0.16 |
748:1 |
0.3 |
1.1 |
|
Hardware + NEC |
SpectraView II |
1 |
2 |
3 |
0.16 |
771:1 |
1.1 |
2.7 |
|
Hardware + i1 Pro
|
SpectraView II |
1 |
1 |
0 |
0.16 |
756:1 |
0.4 |
1.2 |
|
SV II - Adobe RGB |
3 |
2 |
3 |
0.16 |
784:1 |
0.7 |
1.9 |
|
SV II - sRGB |
2 |
0 |
1 |
0.16 |
759:1 |
1.0 |
3.6 |
-
Software Calibration - The software based
calibrations using just the LaCie software and i1 Pro all produced very similar
results. Remember, these are corrections only at a graphics card level, with
minimal hardware changes made only through limited controls like brightness and
RGB channels. This is the regular calibration which would be carried out on most
mainstream monitors we test, since most do not offer hardware level calibration
anyway. All preset modes offered excellent colour accuracy and all targets were
met properly as hoped. The high bright mode seemed to offer a slightly higher
contrast ratio (857:1 compared with ~825:1) but not by much. The Adobe RGB and
sRGB emulation modes provided pretty accurate representation of the smaller
colour spaces which was good.
-
Hardware calibration with LaCie - Once you
allow the software to fully calibrate the internal LUT you are improving
accuracy greatly. The process does take a long time at >10 minutes but does
produce some excellent results. The results when using the i1 Pro with LaCie
software were very similar to the results from the SV packages. The combination
of the NEC puck and LaCie software did seem to return a slightly lower contrast
ratio though for some reason. The puck is optimised to work with NEC's software
so perhaps it doesn't perform quite as well without it.
-
Hardware calibration with SV Profiler -
This software is very comprehensive and the results were again excellent.
Remember, this is making adjustments at a hardware level to the internal 14-bit
LUT so there is a far more accurate result produced. Both the i1 Pro and
customised NEC i1 Display 2 devices produced excellent results which were
pretty
comparable. Targets were met well, although contrast does drop a little when the
screen is hardware calibrated as opposed to software calibrated, to about 773:1. This is because of the added grey
scale tracking and improvements to the whole accuracy which impact contrast
slightly.
-
Hardware calibration with SV II - Again
this software allows full hardware level correction, and even allows you to
define a target colour space. The i1 Pro produced slightly better results than
the NEC i1 Display 2 but both were very good. Again contrast was around 771:1 so
slightly lower than the software calibrated profiles, but again with superior
grey scale tracking and accuracy. The calibration to the smaller Adobe RGB and
sRGB colour spaces worked very well and was an excellent new feature to the
software.
I tested the screen with colour gradients in each
of these calibrated preset modes. The gradients were very smooth and showed no
sign of banding. I was unable to test the full potential of the 10-bit colour
depth due to graphics card and software limitations but expect results will be
even better if you can really put it into practice. There was some very slight
gradation in darker tones in my gradient tests which is common to 8-bit
displays.
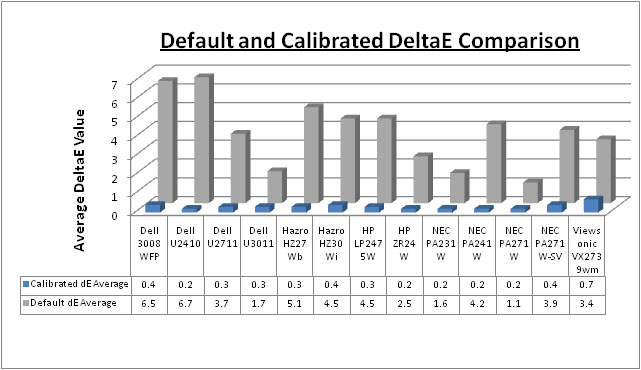
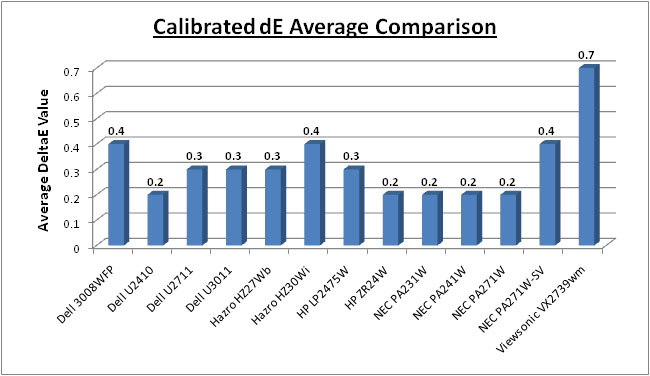
Above I have plotted the colour accuracy reports from the NEC PA271W-SV
against the results of other competing models in
this range we have tested. For the purposes of these comparisons the
measurements from the LaCie reports were all very similar. I have used the
results from the software calibrated 'High Bright' mode here since that produced
the best black depth / contrast ratio, and it is what we had used to plot the
results of the regular PA271W before.
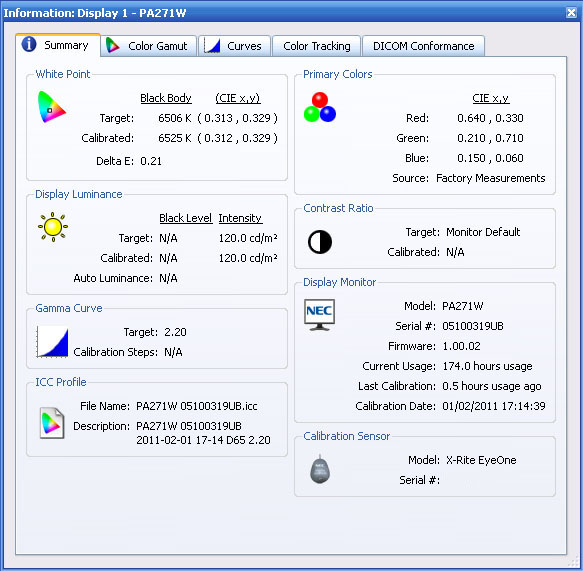
As you can see, default colour accuracy was
moderate with average dE of 3.9. This was similar to the PA241W mode (4.2) but
not as good as the very well factory calibrated regular PA271W (1.1). Once calibrated properly, colour accuracy is
much better. At an average dE
of 0.4 it offers excellent colour fidelity. Again keep in
mind there is more to this than just a validation of a colour profile and colour
accuracy reports, which does separate this screen from the more mainstream
models. Needless to say the other high end features of this
screen (and the PA series in general) like 3D 14-bit LUT's, hardware calibration, ColorComp etc separate it from the
lower cost mainstream models you see it compared against when it comes to high
end professional uses.
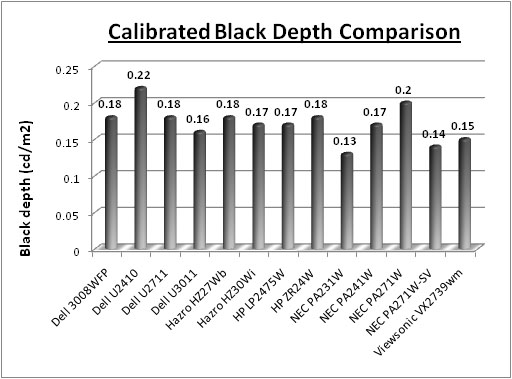
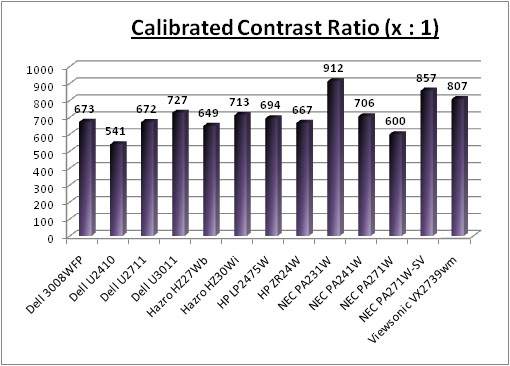
Calibrated black depth was actually very good
here, and a big improvement over the regular PA271W model we tested. We recorded
a black depth of 0.14 which was only bettered by the 23" PA231W in this
comparison (0.13). This gave us an excellent static contrast ratio of 857:1,
just behind the 912:1 of the PA231W. There was a big improvement over the
regular PA271W which only reached 0.20 / 600:1. Perhaps NEC have tweaked the
panel and backlighting operation in both models since its initial release, or
perhaps this is one of the 'tweaks' they have made for the higher priced SV
version. Either way, it's a welcomed improvement as previously this was a
weakness of the PA271W. If you carry out a full hardware calibration as you
would probably want to, the contrast ratio drops a little to around 770:1, which
is still very good. ColorComp will also have an impact on the contrast ratio as
we will test later.
Contrast
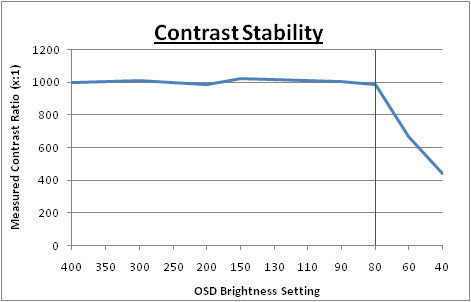
Stability
I wanted to see how much variance there was in
the screens contrast as we adjusted the monitor setting for brightness.
In theory, brightness and contrast are two independent parameters, and good
contrast is a requirement regardless of the brightness adjustment.
Unfortunately, such is not the case in practice. We recorded the screens
luminance and black depth at various OSD brightness settings, and calculated
the contrast ratio from there. Graphics card settings were left at default
with no ICC profile or calibration active. Tests were made using an X-rite i1
Display 2 colorimeter. It should be noted that we used the BasICColor
calibration software here to record these, and so luminance at default
settings varies a little from the LaCie Blue Eye Pro report. I carried out the
following tests in the 'high bright' preset mode.
|
OSD Brightness |
Luminance
(cd/m2) |
Black Point (cd/m2) |
Contrast Ratio
( x:1) |
|
400 |
382 |
0.38 |
1000 |
|
350 |
381 |
0.38 |
1002 |
|
300 |
324 |
0.32 |
1012 |
|
250 |
269 |
0.27 |
996 |
|
200 |
217 |
0.22 |
984 |
|
150 |
164 |
0.16 |
1025 |
|
130 |
143 |
0.14 |
1019 |
|
110 |
122 |
0.12 |
1013 |
|
90 |
100 |
0.10 |
1002 |
|
80 |
89 |
0.09 |
983 |
|
60 |
66 |
0.09 |
733 |
|
40 |
44 |
0.09 |
489 |
|
Luminance Adjustment Range = 338 cd/m2
Black
Point Adjustment Range = 0.29 cd/m2
Average
Contrast Ratio (backlight only) =
1004:1
|
There's a few things I wanted to talk about here.
First of all, the OSD brightness control is listed in
cd/m2 as
opposed to a percentage, and allows you to control the range from a maximum
setting of 400 cd/m2 all the way down to 40 cd/m2 minimum.
The control from 400 down to 80 cd/m2 adjusts the intensity of the
W-CCFL backlighting unit, and as you adjust the setting it stops at 80
initially. The 'regular' PA271W model actually adjusted the backlight down to a
setting of 90, and the 24" PA241W had the same feature but stopped at 130 cd/m2. You can see from the tests above that the contrast remains stable across the whole range from 400 - 80 as you would hope, being recorded at around
1004:1 on average. This was an excellent result and as you would hope from this
test and was also significantly better than the PA271W model we had
tested back in August. The black point and contrast ratio of that screen
then was mediocre really, with an average contrast ratio of 625:1. It seems that
NEC have made some improvements to the panel and backlighting unit to allow for
a superior black depth / contrast ratio here bringing it in line properly with
its advertised spec. Whether there was an issue with the test sample of the
PA271W or whether it affects all those models is hard to say without testing
further samples, but the PA271W-SV certainly offered a better contrast ratio in
our tests.
The luminance was recorded
at a maximum of 382 cd/m2 which is a fair way over the advertised maximum brightness of the screen
of 300 cd/m2 in fact. You probably wouldn't want to use the screen at
such a high brightness though as it was very intense and harsh on the eyes. The
luminance ranged down to 89 cd/m2 at the lowest backlight intensity which gives you a very
good range in which to adjust the screen without sacrificing contrast ratio. The
OSD menu figures are actually pretty close to the target luminance as well,
being only 10 - 20 cd/m2 out in most cases. You
will probably want to adjust the setting to about 110 in the OSD for a
comfortable luminance of around 120 cd/m2. Black depth also
decreased from 0.38 to 0.09 cd/m2 at the lowest end as these
adjustments were made. These results were plotted on the graph below.
The control of the backlight intensity stops when
you reach the OSD setting of 80
cd/m2, and for
all intents and purposes you are at a setting of 0% here. However, the PA271W-SV (like
the other PA series screens)
does allow you to reduce the luminance of the screen even further down to a
setting of 40 cd/m2. As you go below the 80 setting, the OSD shows
the value in pink, and indicates that you are no longer making backlight
adjustments, but you are making digital alterations at the controller board
level. This has the effect of lowering the luminance of the screen even more,
but since this is a digital white level adjustment only, it does affect contrast
of the screen. Black depth cannot go any lower since you are not able to reduce
the backlight intensity any more, and so even though white level is changing
with the digital alterations, black depth remains at ~0.09 cd/m2.
Therefore the contrast ratio drops from ~1004:1 to as low as 489:1 at the lowest
luminance reading.
Compared with most other
monitors you would only normally have access to the backlight intensity control
so the PA271W-SV's performance from the 400 - 80 setting is in keeping with other
models we have tested. All NEC have done is add an additional digital control
should you wish to reduce luminance even further. If you don't want to use this
digital adjustment, but need a lower luminance than the 89
cd/m2 we
achieved at 80 OSD setting, remember you can achieve lower results through
calibration procedures and adjustments at a graphics card LUT level.
Panel Uniformity
Measurements of the screens luminance were taken
at 35 points across the panel on a pure white background. The measurements were
taken using BasICColor's calibration software package, combined with an X-rite
i1 Display 2 colorimeter. The above uniformity diagram shows the difference, as
a percentage, between the luminance recorded at each point on the screen, as
compared with the reference point of a calibrated 120 cd/m2. This is
the desired level of luminance for an LCD screen in normal lighting conditions,
and the below shows the variance in the luminance across the screen
compared with this point. It is worth noting that panel uniformity can vary from
one screen to another, and can depend on manufacturing lines, screen transport
and other local factors. This is only a guide of the uniformity of the sample
screen we have for review.
Uniformity of Luminance - ColorComp Off
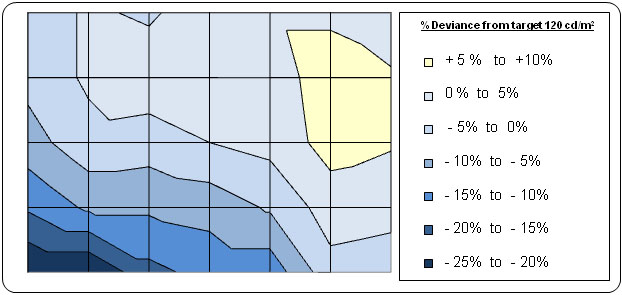
The above results were recorded using the
screen with the 'uniformity' mode disabled. We will look at that
technology in a moment. The results of this test were moderate.
Luminance did drop down by around -25% in the lower left hand area of the
screen, down to a minimum of 96
cd/m2 in the
corner area and was a little darker in the bottom left hand region. In the
top right hand region the luminance reached up to 130 cd/m2 with
a +8% deviation. On the whole
though two thirds of the screen area was less than 10% out from the target luminance
which was ok. I tested the screen with various coloured backgrounds and saw
no colour tinting issues. On a light grey / white background you could just
about pick out this uniformity variance if you looked closely.
Uniformity Mode - ColorComp

The PA271W-SV manual explains what this function does
quite well: "This function electronically compensates for the slight variations in the white
uniformity
level as well as for deviations in colour that may occur throughout the display
area of
the screen. These variations are characteristic of LCD panel technology. This
function
improves the colour and evens out the luminance uniformity of the display. Note
that using the 'Uniformity' feature does reduce the overall peak luminance of the
display. If greater luminance is desired over the uniform performance of the
display, then this option should be turned off. A higher number produces a better effect,
but
may also reduce contrast ratio."
Uniformity of Luminance - ColorComp Level 5
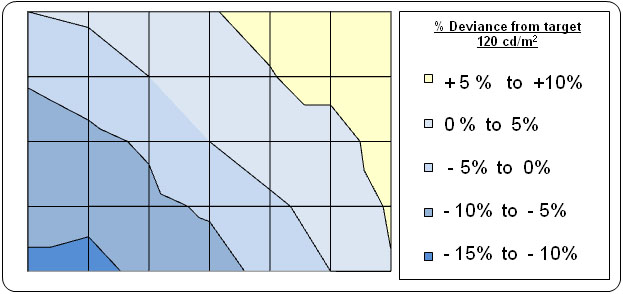
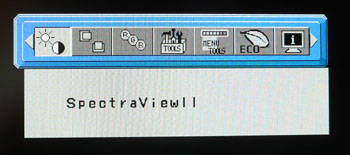
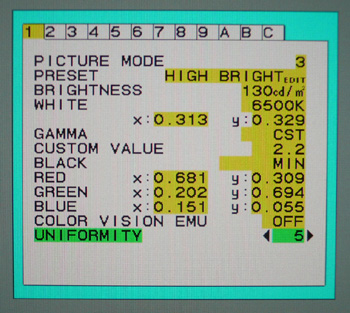
Uniformity mode is accessible via the advanced
OSD menu as shown in the image above. I tested this feature set at level '5' to see
whether it worked well or not. I had tested the feature on the
PA241W and
PA271W as well which had returned excellent results. The outcome was
similar with the PA271W-SV. Uniformity was improved nicely across the screen,
although we did not have quite as good a starting point as with the other
models. Luminance ranged down to 108 (bottom left hand corner) and up to 133 (top right hand corner), but
the extremes of the variance were not as bad as before.
This technology did a good job and is an excellent feature to include
for those who worry about uniformity of images and colour. Unfortunately
since the variance in the panel was quite a lot to start with, it still
couldn't quite offer a very uniform luminance. Although the panels in the SV
are reportedly hand picked, it seems that this does not necessarily
guarantee a great uniformity. Results will vary from one model to another as
always, but this was still an adequate result.
Uniformity - Impact on Contrast
We discussed this a little during our
calibration sections, but thought it might be useful to take a few
measurements as well. When you enable the ColorComp mode, either via the OSD
menu or the SV II software, it does help improve panel uniformity very well.
However, it can have an impact on contrast ratio of the screen. I took
measurements of luminance, black depth and contrast ratio at each of the 5
ColorComp settings. These were taken while in the High Bright preset mode
after software calibration.
|
ColorComp Setting |
Luminance (cd/m2) |
Black
Point (cd/m2) |
Contrast Ratio |
|
Off |
119.8 |
0.14 |
855:1 |
|
1 |
120.0 |
0.14 |
857:1 |
|
2 |
119.9 |
0.15 |
799:1 |
|
3 |
119.8 |
0.16 |
749:1 |
|
4 |
119.9 |
0.17 |
705:1 |
|
5 |
119.6 |
0.18 |
664:1 |
As you can see, the luminance reading of our
calibrated profile was rounded to 120
cd/m2 at each setting and the ColorComp
does a good job of stabilising this value across the screen. However, black
depth was impacted to varying degrees and as a result, contrast ratio ranged
from 855:1 when set to off, down to 664:1 at setting 5.
Above: All black screen in a darkened room
As usual we also tested the screen with an all
black image and in a darkened room. A camera was used to capture the result.
There was some slight uniformity differences noticeable in the top right and
bottom right hand corners, but these were quite hard to detect with the naked
eye to be honest. The camera picked out these differences. Overall there was no
serious backlight bleed which was good.
Other Tests
I won't repeat the results from our other tests
here as you can read our
NEC
PA271W review for that information. The findings and analysis for the
following sections apply to the PA271W-SV as well as nothing has changed between
the two models.
Conclusion
A lot of what I said about the regular PA271W
screen applies here of course, but I will try to concentrate on the differences
between that and the SV / Reference version here. Firstly there is a significant
price difference between the two models, with the regular edition retailing for
around £1050 (inc VAT) and this SpectraView Reference version retailing for
around £1600 GBP. There are a couple of tangible differences here of course.
Firstly the screen comes with a calibration hood which you do not get with the
regular version. Secondly, this model allows for hardware level calibration
using NEC's advanced SpectraView Profiler software; something which the regular
screen did not allow. If you're going to spend this money on a professional
grade screen then you are certainly going to want to calibrate it at a hardware
level, and so it's great to see that the SV Profiler now gives that full access.
It's a decent piece of software and the provider, BasICColor, are highly
regarded in this field.
However is this really necessary when you can
calibrate either screen at a hardware level using the USA SpectraView II
software? That's debateable really as it can happily calibrate the regular and
SV versions of the screen. The Profiler software is perhaps a little more
advanced and has some nice extra reporting features and testing functions. It
also seemed to produce better results from the screen when it was combined with
NEC's own wide-gamut i1 Display 2 puck than the SV II software did. However, the
SV II software is very easy to use and offers some very impressive results as
well. The added functionality of gamut calibration is also very welcome in this
latest version and something which the Profiler software cannot offer at the
moment. The value of the hardware calibration in Europe is undoubted of course,
but when there are very good alternatives with the regular screen anyway, is it
really worth that extra money?
It's also quite hard to really determine the
impact in practice of the reported 'hand picked' and 'tweaked' panels to be
honest. We didn't see quite as good a performance in uniformity as we had with
the regular PA271W even and factory colour performance was not quite as accurate
either. Testing these tweaks in the real World doesn't really show any massive
benefit in my opinion.
Having said that I was suitably impressed by some
of our tests here. The SV II software updates were excellent and very welcome.
The NEC branded i1 Display 2 worked very well and at a fraction of the cost of a
high end spectrophotometer, would make a good choice if you want to calibrate
one of NEC's wide-gamut and PA series screens. There were also some big
improvements in black depth and contrast ratio from our tests of the PA271W-SV.
I don't know if they have improved this with the regular model as well since our
original review, but this could just be a tweak with the SV edition. If it's a
'feature' of the SV edition then that is obviously a big plus for this model as
it was an area of weakness in our PA271W review. The fact still remains that
this is a very high end screen which offers a wealth of features, options and
professional grade performance. I would recommend the SV edition to anyone who
has a very high end requirement.
|
Pros |
Cons |
|
Massive range of calibration
potential at a hardware level |
High price point due to
product positioning |
|
Improved black depth and
contrast ratio, now very good |
Uniformity not quite as good
as hoped (may vary) |
|
Updated SV II software and NEC
i1 Display 2 device are very effective |
Average input lag (see
PA271W review) |