|

Introduction
We've never really taken much of a look at AOC
monitors since they often tend to be lower cost models aimed at office users.
They are normally TN Film technology and don't really spark our interest. However,
recently they have released some new models which do look interesting including
their 23" i2353Fh / Ph. This is an IPS based model with W-LED backlighting and a
pretty unique design. We are always keen to test new and interesting models like
this and so we have the i2353Ph with us for a full review.
It should be noted that there are two model
numbers for this i2353 screen. The Fh model is available in Europe (including
EMEA) while the Ph
is the model available in America and Asia. The two models are
identical and feature the same panel, features, electronics and specs. We actually have the Ph model
with us (which is odd since we are based in the UK). I'll refer to the screen as
the i2353 throughout the review to avoid confusion.
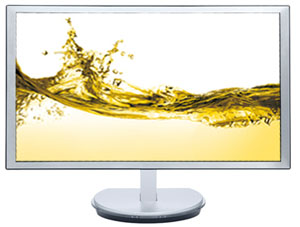
The i2353 is marketed on AOC's website as follows:
"The revolutionary i2353 monitor has a brushed-metallic surface texture, a super
slim display body measuring just 9.2mm thin and a slim, transparent crystal
stand to further enhance its futuristic styling. The base has illuminated
soft-touch controls, and can tilt to transform into a sleek wall mount (VESA
standard), allowing the panel to seemingly float in space. So i2353Ph won the "if"
design award China 2010".
Specifications and Features
The following table gives detailed information
about the specs of the screen:
|
Monitor
Specifications |
|
Size |
23"WS (58.4 cm) |
Panel Coating |
Anti-glare (matte) |
|
Aspect Ratio |
16:9 |
Interfaces |
1x D-sub, 2x HDMI (HDCP) |
|
Resolution |
1920 x 1080 |
|
Pixel Pitch |
0.265 mm |
Design
colour |
Metallic aluminium bezel and stand |
|
Response Time |
5ms G2G |
Ergonomics |
-4° ~ 14° Tilt only |
|
Static Contrast Ratio |
1000:1 |
|
Dynamic Contrast Ratio |
50 million:1 |
VESA Compatible |
Yes 100mm |
|
Brightness |
250 |
Accessories |
D-sub cable, HDMI
cable, Power cord, audio cable |
|
Viewing Angles |
178/178 |
|
Panel Technology |
e-IPS |
Weight |
With stand: 2.85Kg |
|
Backlight Technology |
W-LED |
Physical Dimensions
|
(WxHxD with
stand)
549.5 x 187.7 x 388.3 mm |
|
Colour Depth |
16.7m
(6-bit + AFRC) |
|
Colour Gamut |
Standard gamut (~sRGB)
73% NTSC, 96.9% sRGB, 76% Adobe RGB |
Special
Features |
2x
2W Integrated speakers, ultra-slim design |
The i2353 offers a reasonable set of features. In
terms of video connections there are 2x HDMI and 1x D-sub. For some reason AOC
have opted for 2x HDMI interfaces instead of providing a DVI which is a shame.
Not everyone has a graphics card with HDMI or access to an HDMI > DVI adapter
even. If AOC wanted to stick with only HDMI for a digital connection they could
have at least provided an adapter cable for those who need it. HDMI is useful
for external devices of course, but I would have personally preferred to see 1x
HDMI and 1x DVI. It was also a shame not to feature DisplayPort which is
increasingly popular as an interface. The digital HDMI ports are HDCP certified
at least for protected content. Cables are provided for HDMI (x1) and D-sub.
The display does offer some integrated 2x 2W
speakers as well but these aren't up to much. They are very quiet even at 100%
volume and only really suitable for the odd 'office sound' or alert I think.
There are no further features here such as ambient light sensors or card readers
here. Sadly there are no USB ports either which I think are very useful and
feature on many modern screens.
Below is a summary of the features and connections of
the screen:
|
Feature |
Yes / No |
Feature |
Yes / No |
|
Tilt adjust |
 |
DVI |
 |
|
Height adjust |
|
HDMI |
|
|
Swivel adjust |
|
D-sub |
|
|
Rotate adjust |
|
DisplayPort |
|
|
VESA compatible |
|
Component |
|
|
USB Ports |
|
Composite |
|
|
Card Reader |
|
Audio connection |
|
|
Ambient Light Sensor |
|
HDCP Support |
|
|
Touch Screen |
|
Integrated Speakers |
|
|
Hardware calibration |
|
Uniformity correction |
|
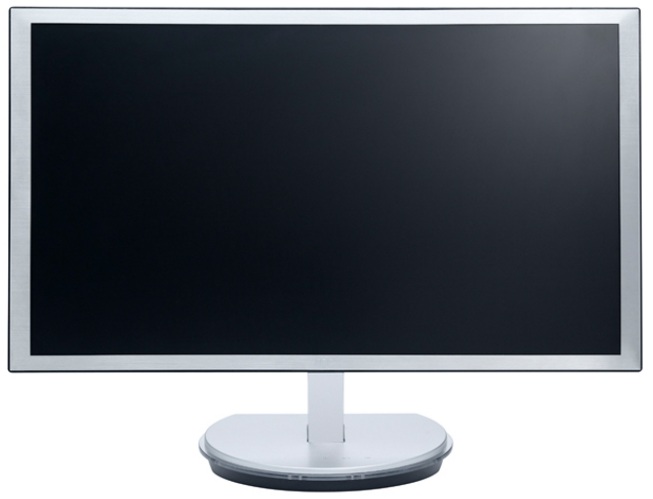
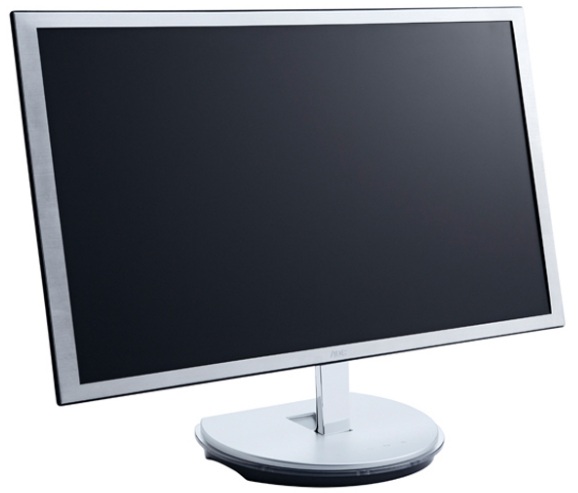
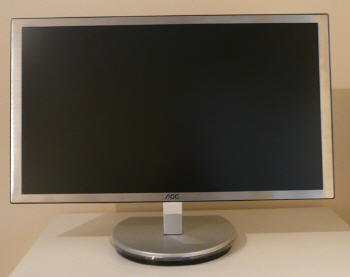
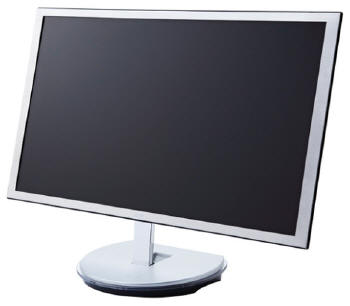
Design and Ergonomics
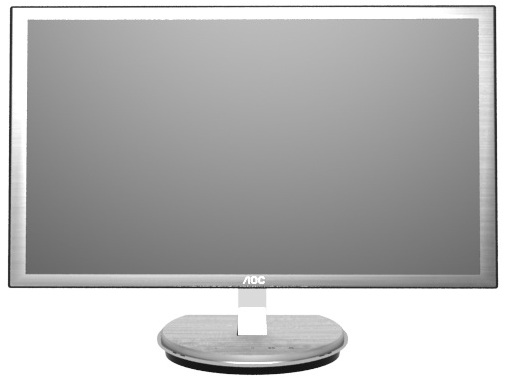
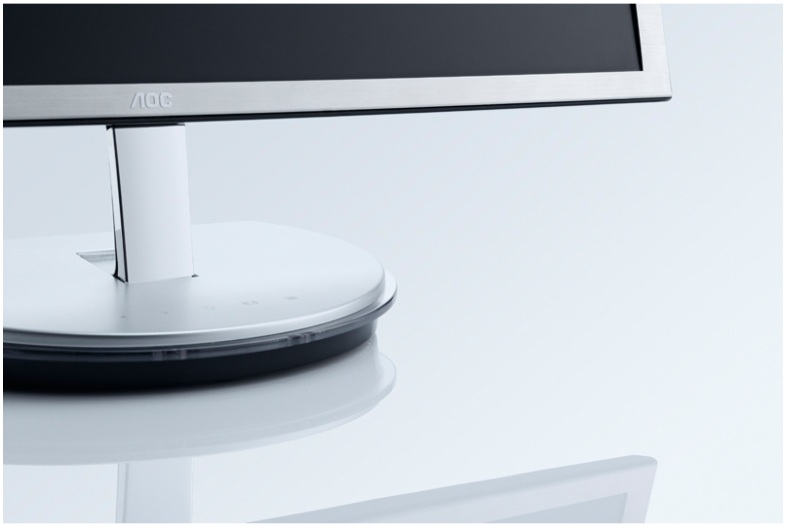
Above:
front view of the i2353 showing aluminium design to bezel and base
The AOC i2353 comes in an attractive
metallic aluminium finished bezel with a very thin black trim along the
outer edges. This bezel is a little thicker on the sides where it measures
22mm, as compared with the top and bottom where it is 17mm. In the middle
of the bottom bezel is a small shiny silver coloured AOC logo. The monitor
arm is also a shiny silver colour while the base is a brushed aluminium
colour again like the bezel.
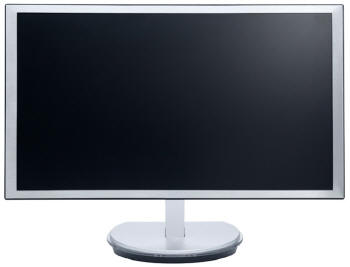
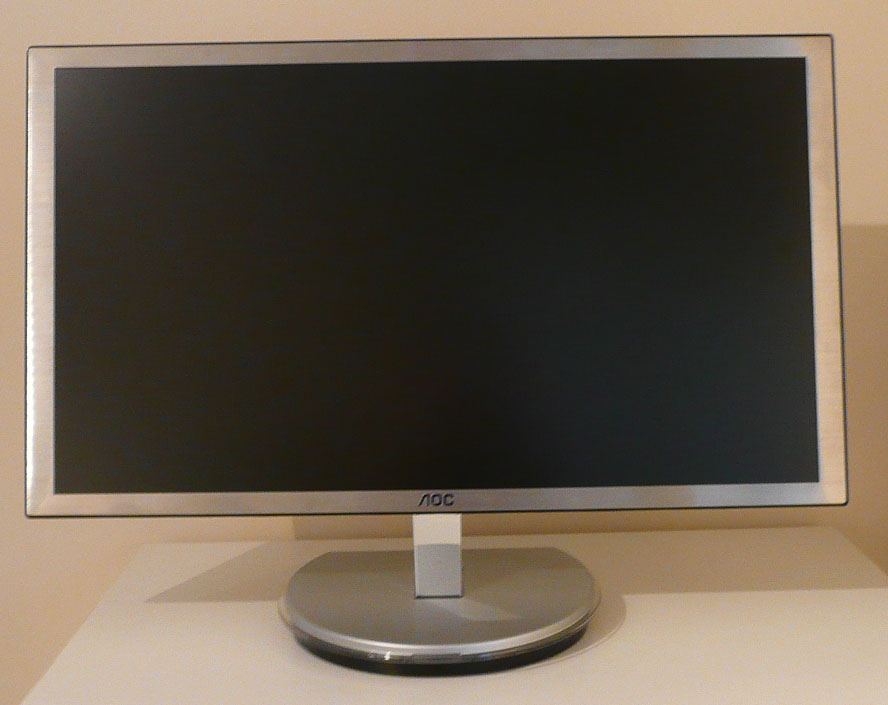
Above:
front view of the screen. Click for larger version
Above: some
photos of the front and back of the screen. Click for larger versions
The above photos give you more views of the
front and back of the screen. The screen features a normal anti-glare (AG)
coating but this is not as heavy or sparkly as some other competing
screens which is pleasing. It seemed to be a low level of coating used
here.
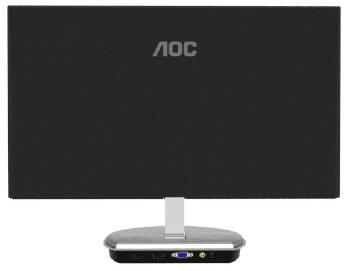
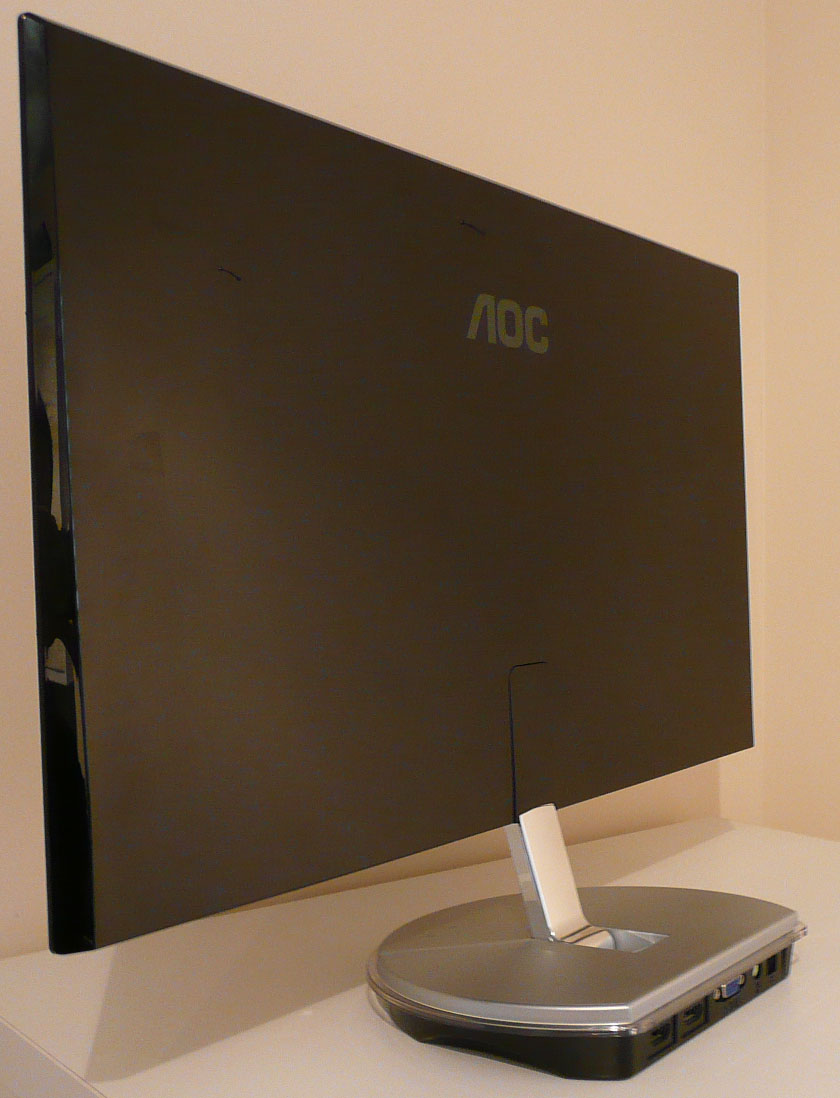
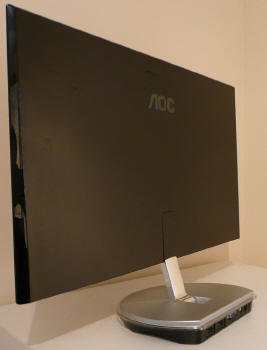
Above: rear
view of the screen
The back of the screen is encased in a flat
glossy black plastic and looks attractive. There is a grey coloured AOC
logo here near the top as well. The interface connections are situated on
the back of the base as shown.
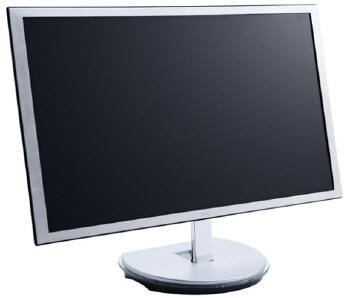
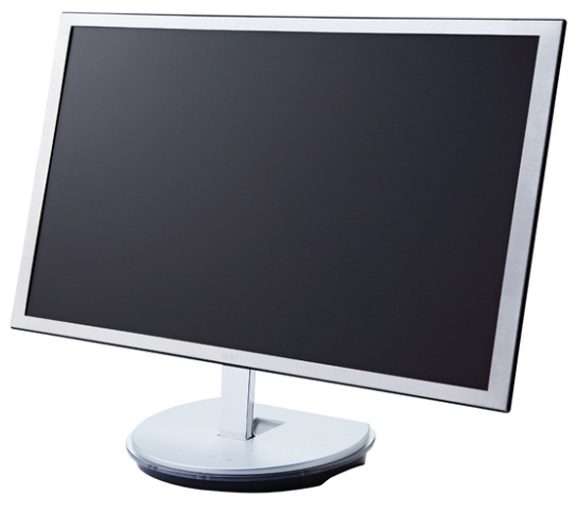
Above:
further front views of the screen from an angle. Click for larger versions
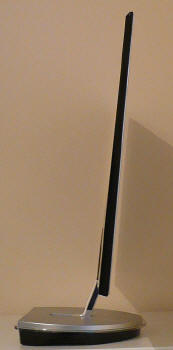
The i2353 looks very sleek and minimalist I
must say, helped by its incredibly thin profile. The screen measures only
9.6mm thick thanks to its use of W-LED backlighting and an external power
brick.
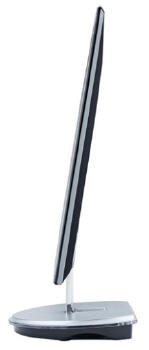
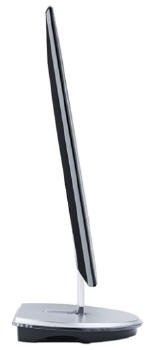
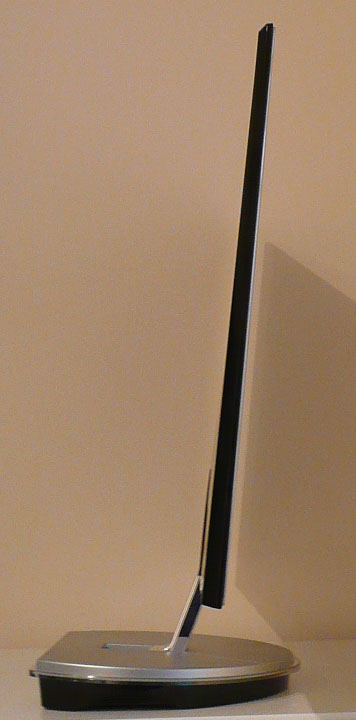
Above: side
views of the screen. Click for larger versions
You can see here the incredibly thin profile
of the i2353 from the side.
The screen has only a tilt ergonomic
adjustment which does offer a good range of adjustment forward and
backward. This is quite stiff though and difficult to move, partly because
of its thin arm and light base. Sadly there is
no height, pivot or rotate adjustments available. Perhaps its
classification as being part of their "ergonomic" range is a little
adventurous.
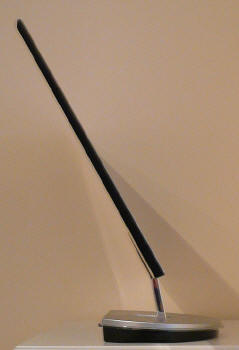
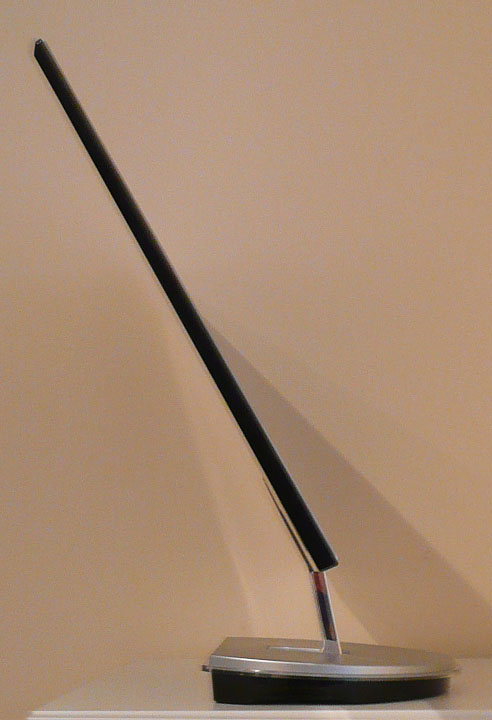
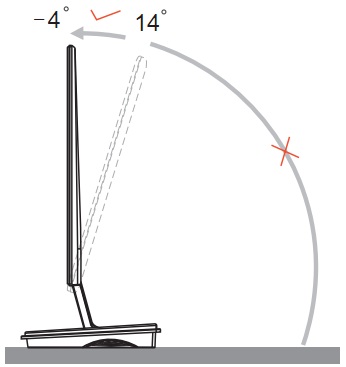
Above: side
view showing maximum range of tilt adjustment. Click for larger versions
The tilt range is shown above. The stand
will allow you to tilt the panel back even further than shown in the
second photo but at that point it becomes unstable and will fall over as
the base is not heavy enough to support it. It only folds back further to
allow you to wall mount it with the stand folded all the way back. The
images above are the actual useable range of the tilt adjustment in normal
conditions.
A summary of the screens ergonomic adjustments
is shown below:
|
Function |
Range |
Smoothness |
Ease of Use |
|
Tilt |
-4° ~ 14° |
Stiff |
Quite hard |
|
Height |
n/a |
- |
- |
|
Swivel |
n/a |
- |
- |
|
Rotate |
n/a |
- |
- |
|
Overall |
Limited range of adjustments with only tilt
available. This is difficult to use and stiff unfortunately. |
The screen materials are of a good quality
and the design is attractive in my opinion. There is no audible noise from
the screen and it stays cool during operation on the most part. The
lower edge does become quite hot which is where the W-LED backlighting is
situated (edge-lit display). The power brick also becomes quite warm as you
might expect.
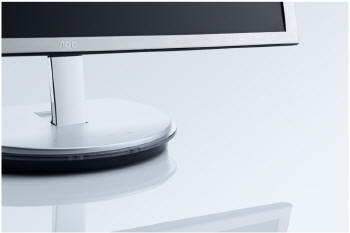
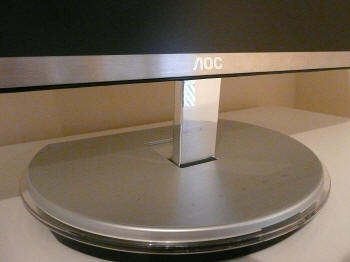
Above: view
of the base of the screen. Click for larger version
The base is a circular shape. It has a black
bottom section with a thin clear plastic trim around it (referred to as 'transparent
crystal' in their marketing). Above this there is a
bushed aluminium coloured base which matches the bezel of the screen.
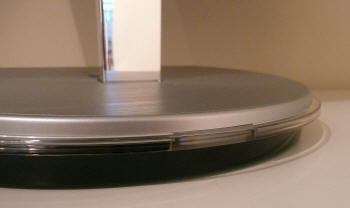
Above: view
of the transparent crystal edge on the base, and location of the power LED
(left image). Click for larger versions
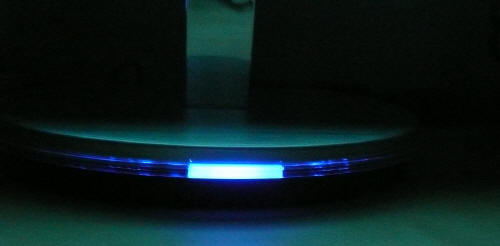
Above: the
power LED glows blue during normal operation. Click for larger version
The
power LED is a fairly attractive bar which glows in the centre of this
base, and is accentuated by the plastic trim going around the edge. In
normal operation this glows a blue colour, and in standby it glows amber.
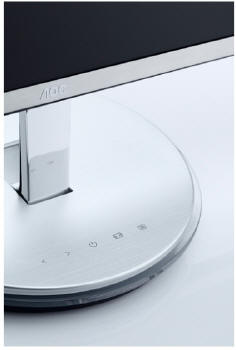
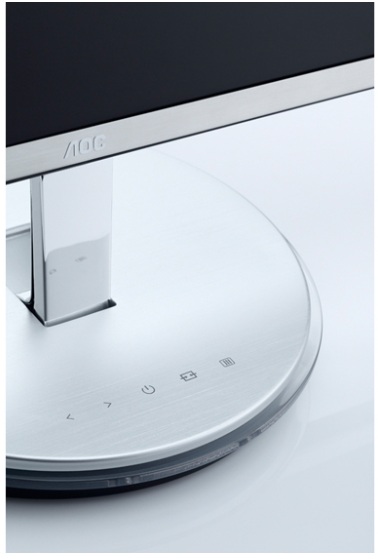
Above: view
of the base of the screen. Click for larger version
On the top of the base there are small
subtle labels for the OSD menu. The buttons for this are not located on
the screen itself, but on the base. These are touch sensitive and there is
a bit of give in the top of the base as a result. In some places this
makes it feel a little separated and creaky, but overall the buttons work
quite well.
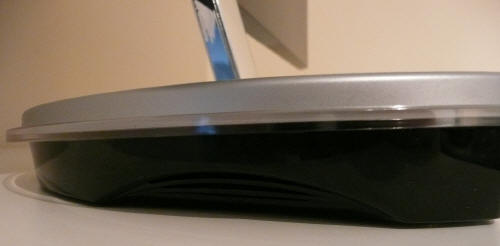
Above: view
of the small speaker grill on the side of the base. Click for larger
version
The base also incorporates the 2x 2W
speakers. There is a small grill on the side of the base where the sounds
emanates. They aren't up to much unfortunately. They are very quiet even
at 100% volume and only really suitable for the odd 'office sound' or
alert I think.
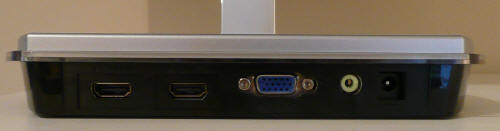
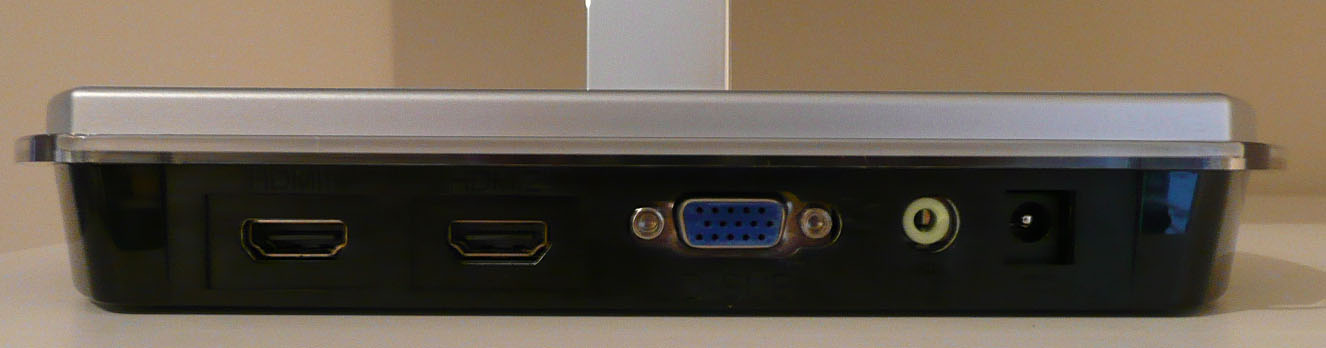
Above: rear
view of the stand showing interface connections. Click for larger version
The back of the base offers the connections
for HDMI (x2), D-sub VGA, audio in and power. There is an external power
brick provided with the screen as opposed to it being integrated into the
display. The cables for HDMI and D-sub are provided as well. It was a
shame not to see DVI present here, or even a DVI > HDMI adapted perhaps.
Not every user will have an HDMI output on their graphics card and so if
you want to use the digital connection you must use and adapter, or
otherwise stick with D-sub. I'd have rather seen 1x HDMI and 1x DVI
personally. It was also a shame not to feature DisplayPort which is
increasingly popular as an interface.
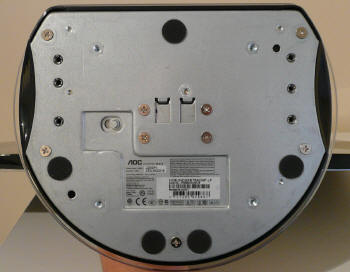
Above: view
of the bottom of the stand. Click for larger version
You can wall mount the screen which is VESA
100mm compliant. Since the interface and power connections are located on the
base you must leave this attached however. The stand folds back as shown which
can then be mounted. I would have liked to have been able to mount the panel
on its own given its appearance and very thin profile. It would have looked
very sleek on its own I'm sure.
OSD Menu
The OSD menu is accessed via the touch sensitive
buttons on the top of the base as shown. There is quick access to the Clear
Vision modes via the left hand arrow, volume level via the right hand arrow, and
input selection via the fourth button along.
The menu itself is a wide bar which appears across
the screen as shown above. It is split into 6 separate sections which you can
navigate through using the left/right arrows. Once on a section you want to
view, you just press the menu button to enter it, and then the arrows move you
through each option. A press of the 'input' button takes you back up a level.
It's fairly easy to use although not as intuitive as some other OSD menus we
have used before. The location of the buttons on the top of the base are also a
bit annoying as you are forever reaching over and behind your keyboard to access
them.
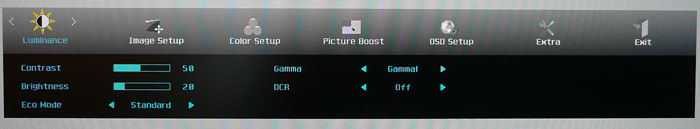
The first section of the menu is labelled as
'luminance' and features options to control the brightness and contrast as
normal. You can also control the ECO mode option which offers a range of preset
brightness levels ranging from 20 to 100. They are text (20), internet (40),
game (60), movie (80) and sports (100). A standard mode also offers you your own
customisable brightness level. This luminance section also allows you to control
three preset gamma modes which we will
test later on as well as
turning the dynamic
contrast ratio (DCR) option on and off.
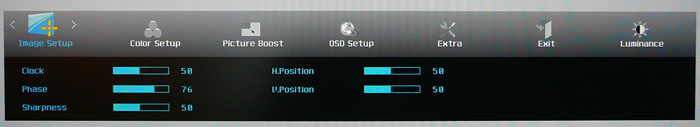
The second section is the 'image setup' section as
shown above, allowing you to control some features when using the analogue D-sub
interface.
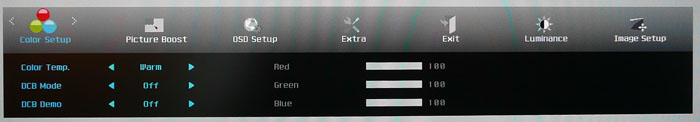
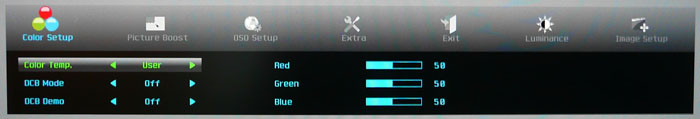
The 'color setup' section allows you to control a
series of preset colour temperature modes which we will
test later on as well. You
can also control their 'DCB mode' which is designed to bring out certain aspects
of the images you are viewing, and enhance things like skin tones, green fields
and blue skies. There is even an auto-detect feature available here. The DCB
demo option splits the screen vertically in two so you can see a before and
after view of what this is doing to the content. The RGB sliders are visible
here but only accessible when in the 'user' colour temp mode.
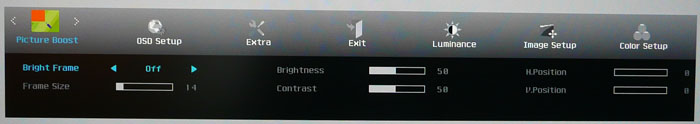
The picture boost section allows you to create a
small window within your image which is then 'boosted' to your liking. You can
control the size, position, brightness and contrast of this window, although I'm
not sure whether this would be useful in practice to many people.
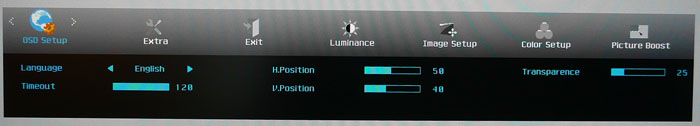
The OSD setup section allows you to control some
usual features relating to the menu itself as shown above.
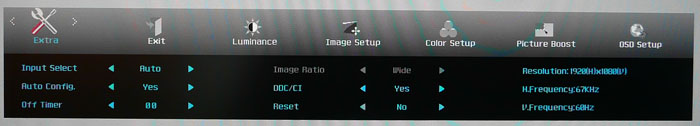
The 'extra' section controls a few other features
including input selection, an off timer. The image ratio (aspect ratio control)
option is also available here with options for 'wide' and '4:3'.
Overall the menu offered a reasonable set of
adjustments and options and was ok to use. It wasn't as intuitive as some other
menus I've used and the movement between sections had a slow animation too.
Power Consumption
In terms of power consumption the manufacturers spec states
typical
usage of 25W in normal operation. In standby the screen apparently uses 0.5W and
when switched off it uses 0.3W. Not sure why it would still draw power when
switched off really but we'll test that ourselves.
|
 |
|
State and Brightness
Setting |
Power Usage
(W) |
|
Factory Default (90%) |
35.4 |
|
Calibrated (25%) |
22.7 |
|
Maximum Brightness (100%) |
37.4 |
|
Minimum Brightness (0%) |
18.4 |
|
Standby |
0.7 |
|
Off |
0.7 |
|
We tested this ourselves and found that out of the
box the screen used 35.4W of power while at its default 90% brightness setting. After calibration, where we
had adjusted the brightness control to 25% in the 'user' mode, and therefore
decreased the backlight intensity, this
was reduced to 22.7W. In standby the screen uses only 0.7W of power. The screen
even used this power when manually switched off via the power button which was
odd.
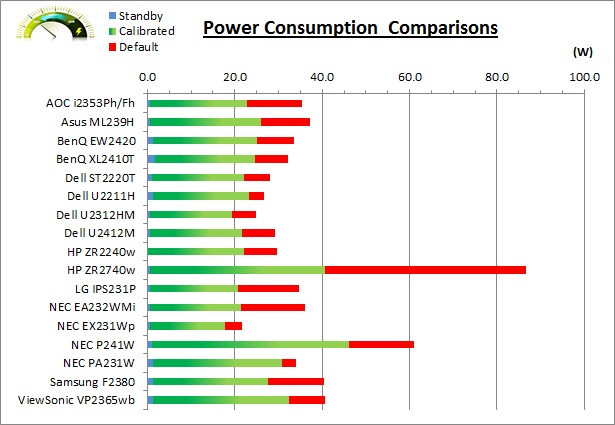
The i2353 is very comparable to the other W-LED
based screens we have used. I have plotted the results of these measurements
on the graph below:
Colour Accuracy, Black
Depth and Contrast
The Panel and Backlighting Unit
The AOC i2353 utilises an LG.Display
LM230WF3-SJC1 e-IPS panel which is
capable of producing 16.7 million colours. The panel itself actually uses a
6-bit colour depth with Advanced
frame rate control
(A-FRC) to produce the 16.7m colours. This is different to regular 8-bit IPS
matrices, but this is a measure taken to achieve a lower price point for these
modern lower-cost displays. We have not seen this specific revision of the panel
used elsewhere before but it is very similar to the other LM230WF3
revisions.
The screen uses
White-LED (W-LED) backlighting. The colour space of this screen is
approximately equal to the sRGB reference and is considered a 'standard gamut'
backlight type. Studying the detailed panel spec confirms the screen covers 73%
of the NTSC reference, 76.0% of the Adobe RGB reference and 96.9% of the sRGB
colour space. While a 96.9% coverage of the sRGB
space is decent enough and in line with most W-LED backlit screens, some higher
end uses may require a wider gamut with a full 100% sRGB coverage (and beyond)
for graphics and colour work. A wide gamut screen is another option for those
wanting to work outside of the sRGB colour space.
Testing Methodology
An
important thing to consider for most users is how a screen will perform out of
the box and with some basic manual adjustments. Since most users won't have
access to hardware colorimeter tools, it is important to understand how the
screen is going to perform in terms of colour accuracy for the average user.
I
restored my graphics card to default settings and disabled any previously active
ICC profiles and gamma corrections. The screen was tested at default factory settings using the DVI interface, and analysed using
an
X-rite i1 Pro spectrophotometer combined with
LaCie's Blue Eye Pro software suite. An NEC branded and customised X-rite i1 Display 2 colorimeter was
also used to verify the black point and contrast ratio since the i1 Pro is less
reliable at the darker end.
Targets for these tests are as follows:
-
CIE Diagram - validates the colour space
covered by the monitors backlighting in a 2D view, with the black triangle representing the
displays gamut, and other reference colour spaces shown for comparison
-
Gamma - we aim for 2.2 which is the default
for computer monitors
-
Colour temperature / white point - we aim
for 6500k which is the temperature of daylight
-
Luminance - we aim for 120
cd/m2, which is
the recommended luminance for LCD monitors in normal lighting conditions
-
Black depth - we aim
for as low as possible to maximise shadow detail and to offer us the best
contrast ratio
-
Contrast ratio - we aim
for as high as possible. Any dynamic contrast ratio controls are turned off here
if present
-
dE average / maximum -
as low as possible.
If DeltaE >3, the color displayed is significantly different from the
theoretical one, meaning that the difference will be perceptible to the
viewer.
If DeltaE <2, LaCie considers the calibration a success; there remains a
slight difference, but it is barely undetectable.
If DeltaE < 1, the color fidelity is excellent.
Default settings of the screen were as follows:
|
Monitor OSD Option |
Default Settings |
|
Brightness |
90 |
|
Contrast |
50 |
|
Gamma mode |
Gamma 1 |
|
Colour Temp |
Warm |
AOC i2353 - Default Factory Settings


|
|
Default Settings |
|
luminance (cd/m2) |
262 |
|
Black Point (cd/m2) |
0.28 |
|
Contrast Ratio |
922:1 |
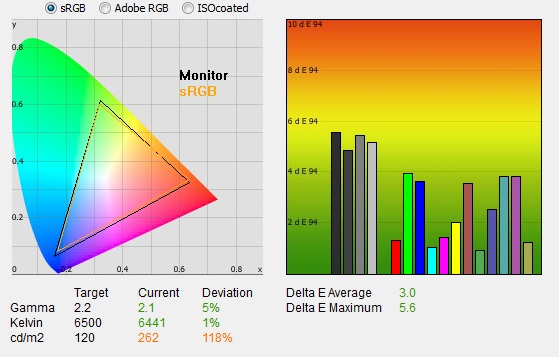
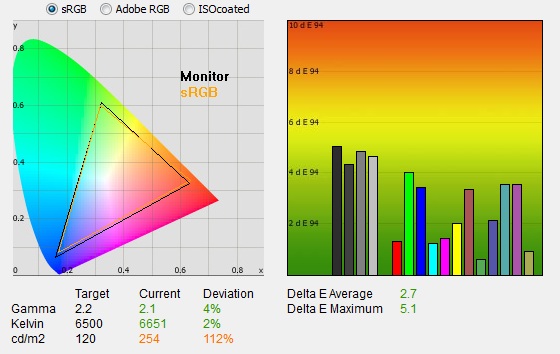
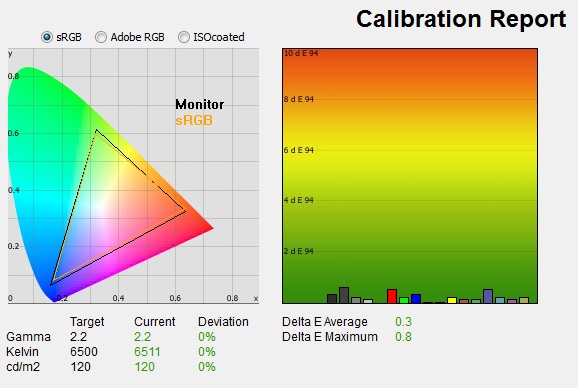
The out of the box performance of the i2353 was
reasonable. The
CIE diagram on the left confirms that the monitors colour gamut (black
triangle) very closely matches the sRGB colour space (orange triangle). It
extends a little past the sRGB space in greens and blues in this 2D view of gamut but is a
little short in reds.
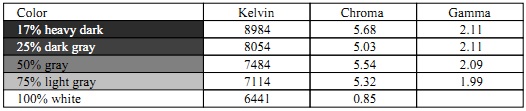
Default gamma was recorded at 2.1 average, leaving
it 5% out from the target of 2.2. Gamma was actually closer to the target 2.2 in
the darkest greys where it was recorded at 2.11. This
deviated as low as 1.99 in other lighter shades however. White point was a
practically spot on here at 6441k which was only 1% out from the target. This
was a pleasing setup in terms of white point. Note that we are using a
Spectrophotometer to make these measurements which is not sensitive to the W-LED
backlight as some colorimeter devices can be. When using a colorimeter with a
W-LED backlit screen there can be a typical deviance of 300 - 600k in the white
point measurement which is why some sources may refer to a different white point
in this test incorrectly.
Luminance was recorded at a high 262
cd/m2 which is
too high for comfortable use. The OSD is set at 90% brightness and this is far
too much. At this high 262 cd/m2 luminance, the black depth
was 0.28 cd/m2. This gave us a static contrast ratio of
922:1 which is very good for an IPS panel.
Colour accuracy was moderate but not great at default factory
settings with an average DeltaE (dE) of 3.0, ranging up to a maximum of 5.6. The
screen felt pretty even to the naked eye but was overly bright at these default
settings. Some minor OSD adjustments to the brightness can hopefully help
improve the default set up for casual users who don't have access to a hardware
calibration device. To be fair though this kind of out of the box set up should
be fine for most casual users anyway, and they can just adjust the brightness
control to suit their working environment.
|
Monitor OSD Option |
Default Settings |
|
Brightness |
90 |
|
Contrast |
50 |
|
Gamma mode |
Gamma 1 |
|
Colour Temp |
sRGB |
AOC i2353 - Default Settings, sRGB mode
|
|
Default Settings,
sRGB mode |
|
luminance (cd/m2) |
254 |
|
Black Point (cd/m2) |
0.28 |
|
Contrast Ratio |
897:1 |
I also wanted to test the default performance of a
couple of other preset modes. Here we have tested the sRGB mode. As you can see,
overall the performance remains very similar to the 'warm' preset. Gamma was
ever so slightly closer on average with 4% deviance from the 2.2 curve we
wanted. White point was very close but a little further out by 1% compared with
before. Colour accuracy was a little better with average dE of 2.7. No real
differences in this mode to shout about really.
|
Monitor OSD Option |
Default Settings |
|
Brightness |
90 |
|
Contrast |
50 |
|
Gamma mode |
Gamma 1 |
|
Colour Temp |
User |
|
RGB levels |
50, 50, 50 |
AOC i2353 - Default Settings, User mode
|
|
Default Settings,
User mode |
|
luminance (cd/m2) |
119 |
|
Black Point (cd/m2) |
0.28 |
|
Contrast Ratio |
415:1 |
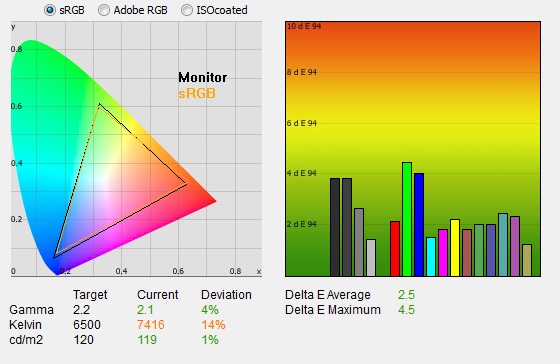
I also reverted the screen to the 'user' mode
which had an immediate impact on the luminance of the screen. The brightness
control was still at 90% but the luminance had dropped here to 119
cd/m2. This was
now very close to the desired 120 cd/m2, but had a major impact on
the contrast ratio, reducing it from 922:1 to 415:1. Closer inspection of the
rest of the OSD menu showed us that at default, the RGB levels were now set at
50 each as opposed to 100. This has the same effect as lowering the contrast
control of the screen and so an adjustment has been made to the digital white
level. This has produced a lower luminance, but impacted contrast ratio
significantly. When we come to calibrate the screen we will want to raise these
RGB levels higher to restore the CR as best we can.
Other than that rather
significant change, the colour temperature was also a bit further out now and
the image was a bit cooler at 7416k (14% out). Colour accuracy had improved a
little as well with dE average now 2.5, maximum of 4.5. This mode might be a
good option for calibration when we get to that section, but we would need to
ensure that contrast ratio was improved. I wouldn't recommend using it at its
default setup though.
Testing Gamma Mode
I also wanted to briefly test the three gamma
modes which are available via the OSD menu. All other settings were left at
factory default, and we simply changed the gamma option in the menu.
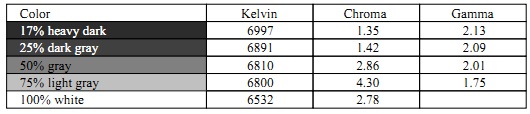
The default mode is gamma 1 and this
produced a gamma of 2.1 average and a 5% deviance from our target of 2.2. As you
can see, the gamma is closest to 2.2 in the darkest grey shades, but does drop
down to 1.99 in the lighter shades.
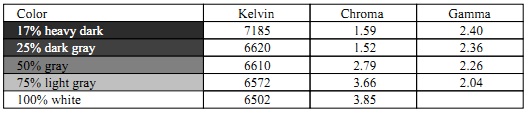
Switching to gamma 2 gave us an average
gamma of 2.0 and an 8% deviance. This had only made the darkest shades a little
closer to the 2.22 target, while all the other shades were now further out from
the ideal. The lightest shades dropped down to 1.75 which left a significant
difference.
Finally gamma 3 gave us an average gamma of
2.3 and a deviance of 3%. On average, this was the mode which was closest to the
2.2 target of our tests, that being the default for computer monitors. The
darker tones had actually exceeded the 2.2 gamma here, but the lighter tones
were closer than they had been before. This would probably act as an optimum
starting point for the gamma of the screen before calibration.
Testing Colour Temperatures
The i2353 features a range of preset modes
accessible via the OSD menu. We measured the colour temperature of the screen
with the X-rite i1 Pro spectrophotometer in each of the preset modes to establish
the white point / colour temperature for each. All other settings were left at factory defaults and no
ICC profile was active. The results are recorded below:
|
Selected
Preset Mode |
Measured Colour Temperature |
|
Warm |
6584 |
|
Normal |
7253 |
|
Cool |
9494 |
|
sRGB |
6595 |
|
User |
7423 |
As you can see, the 'warm' preset mode is
actually very close to the 6500k mark which is our target during these tests,
that being the temperature of daylight. The 'normal' mode was a fair bit
cooler at 7253k, while the 'cool' mode was 9494k. The sRGB preset was very
close to the 'warm' mode, again being ~6500k. The user mode was cooler and was
close to the 'normal' temperature preset at 7423k. You will probably want to
use either the 'warm' or sRGB modes if you want to obtain a white point of
~6500k out of the box.
Calibration Results
I wanted to calibrate and profile the screen to determine what was possible with optimum settings and
profiling. I used the
X-rite i1 Pro spectrophotometer
combined with the LaCie Blue Eye Pro software package to achieve these results
and reports. An NEC branded and customised X-rite i1 Display 2 was used to
validate the black depth and contrast ratios due to lower end limitations of the
i1 Pro device.
AOC i2353 - Calibrated Settings, User Mode
|
Monitor OSD Option |
Adjusted Setting |
|
Brightness |
25 |
|
Contrast |
50 |
|
Gamma mode |
Gamma 3 |
|
Preset Mode |
User |
|
RGB Controls |
93, 97, 99 |
|
|
Calibrated Settings,
Standard Mode |
|
luminance (cd/m2) |
120 |
|
Black Point (cd/m2) |
0.15 |
|
Contrast Ratio |
794:1 |
I first of all switched the the user preset mode
which would allow me to make the maximum amount of change to the screens
settings, including the RGB channels. I changed these from their default 50
settings however to 100 before the calibration process as we had already seen
that the default had a major impact on contrast ratio that we wanted to avoid. I
followed LaCie's calibration process through, adjusting the OSD brightness and
RGB settings in line
with the recommendations made in the process, and then letting the software
carry out the LUT adjustments at a graphics card level and create an
ICC profile. The screen does not feature a hardware LUT calibration option
so other than the OSD alterations, the rest of the process is carried out at a
graphics card level in profiling the screen.
Gamma setting = 3
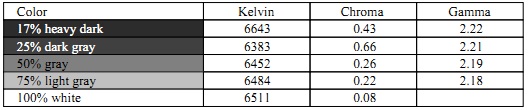
The calibration was a great success. I had
initially calibrated the screen when using the gamma mode of 3 since that seemed
to return the closest accuracy out of the box to the 2.2 average we were looking
for. Average gamma was now corrected with 0% deviance from the average. You can
see that the gamma was ever so slightly higher in darker tones than the target,
and ever so slightly lower in the lighter tones but this did average out to 2.2
exactly.
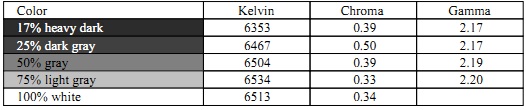
Gamma setting = 1
For those interested, I also
followed the same process when in gamma mode 1 which yielded the above results.
At the 75% light grey level gamma was spot on at 2.2, but it did deviate down to
2.17 in darker shades. Overall gamma was a little further out, with an average
of 2.175. This was still only 1.1% out from the target on average.
White point had been corrected from the 14%
deviance we had seen out of the box in this 'user' mode. It was now <0.5% out at
6511k. A luminance of 120
cd/m2 had been
achieved, but with the RGB levels now set a lot higher than default, we had a
vastly improved contrast ratio from this user mode, improving it from 415:1
default to 794:1. This was reasonable for an IPS panel.
Colour accuracy had also been corrected nicely
through this profiling with an average dE of 0.3 and a maximum of 0.8 now. LaCie
would consider colour fidelity to be excellent here. I tested the screen using
various colour gradients which showed very smooth transitions and no apparent
banding. There was some slightly noticeable gradation in darker tones which is
normal for most screens but was very slight here. There was
also some very slight temporal noise evident, particularly in darker tones if you
look very closely. This is a result of the FRC algorithm used to produce the
16.7 million colour palette. It's not something you'd notice in practice, and you do have to look very closely to see it.
In reality although the panel used is a 6-bit + A-FRC module, there is no
noticeable issue with this in terms of colour gradation and performance.
You can use our settings and
try our calibrated ICC profile if you wish, which are available in
our ICC profile database. Keep in mind that results will vary from one
screen to another and from one computer / graphics card to another.
AOC i2353 - Calibrated Settings, Warm Mode
|
Monitor OSD Option |
Adjusted Setting |
|
Brightness |
20 |
|
Contrast |
50 |
|
Gamma mode |
Gamma 3 |
|
Preset Mode |
Warm |
|
RGB Controls |
n/a |

|
|
Calibrated Settings,
Warm Mode |
|
luminance (cd/m2) |
120 |
|
Black Point (cd/m2) |
0.14 |
|
Contrast Ratio |
835:1 |
I switched to the 'Warm' preset mode as well
to see what could be achieved through profiling in this setting. Since this did
not allow you to change the RGB levels at a hardware level yourself, the only
change I was making to the screen was to the brightness control. I started in
gamma mode 3 since that had returned us the closest gamma curve to 2.2
previously.
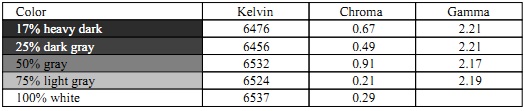
The calibration was again a success. The
performance pretty much matched that of our calibrated 'user' preset. Gamma was
1% out with an average of 2.2. White point was 1% out at 6537k. With a luminance
of 120
cd/m2 after
calibration we had a black depth of 0.14 cd/m2 and a static contrast
ratio of 835:1. This was a little higher than the user mode where we had also
lowered the RGB controls a little to aid calibration. Colour accuracy was again
very good with dE average of 0.4 and maximum of 0.8. You may want to stick with
the user mode however for optimum control over the hardware.
Again, you can use our settings and
try our calibrated ICC profile if you wish, which is available in
our ICC profile database. Keep in mind that results will vary from one
screen to another and from one computer / graphics card to another.
Calibration
Performance Comparisons
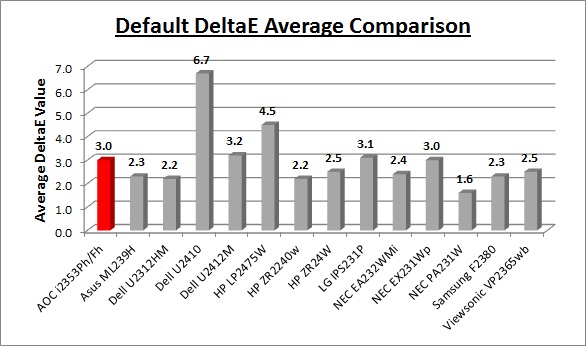
I've provided a comparison above of the i2353
against some of the other screens we have tested in a similar size range. Out of
the box average dE was 3.0 on the i2353 which was moderate.
The default colour accuracy of the i2353 was a little behind, but quite comparable to some of the other
23"
IPS + W-LED models we have tested including the
Dell U2312HM (2.2),
NEC EA232WMi (2.4),
LG IPS231P (3.1) and the
Asus ML239H (2.3). The slightly larger 24"
Dell U2412M was quite similar as well at 3.2 average dE. The professional grade 23"
NEC PA231W was better still at 1.3 dE average. A reasonable performance in
terms of default colour accuracy from the i2353 and only a little behind
most of the competition really. Some form of software profiling using a colorimeter
would of course be beneficial to correct some of the colours.
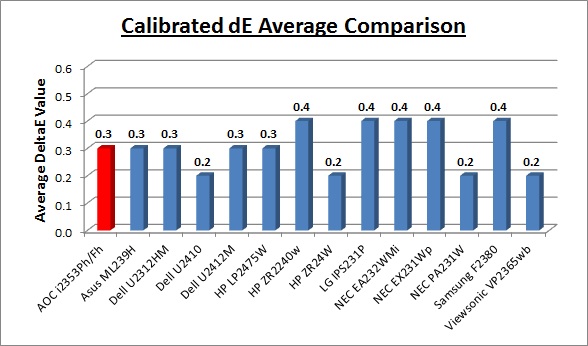
Once calibrated the dE average was reduced to 0.3.
This would be classified as excellent colour fidelity by LaCie. It was not quite
as low as some of the other screens here which reached down to 0.2 average, but
in practice you would not notice any difference here. Some of the
professional range models from NEC are even more accurate. Professional grade
monitors like the NEC PA series also offer other high end features which
separate them from some of these other models, including extended internal
processing, 3D LUT's and hardware calibration. These comparisons are based on a
small selection of tests, so it should be remembered that other factors do come
into play when you start talking about professional use. For further information
and tests of a high end professional grade screen with hardware LUT calibration,
you may want to have a read of our
NEC SpectraView Reference 271 review.
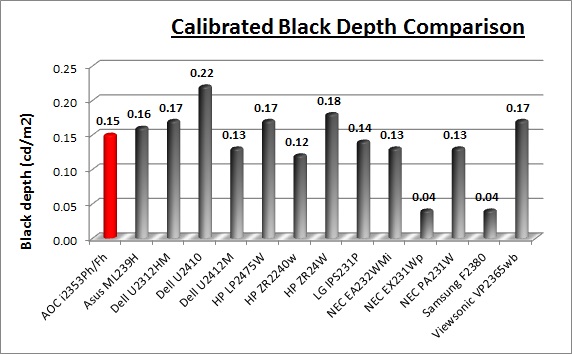
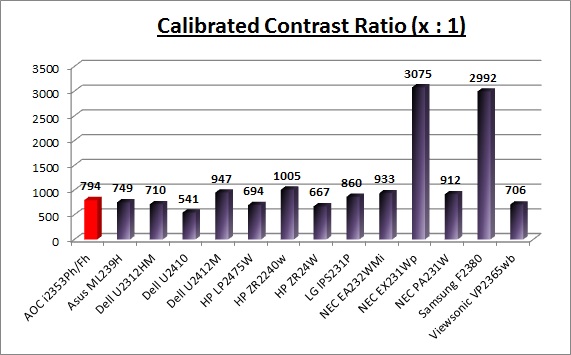
The black depth and contrast ratio of the i2353
were ok, but not great for an IPS panel. Calibrated black depth was 0.15
cd/m2 (user
mode) which
left it a little behind some of the other models we have tested and gave us a
static contrast ratio of 794:1. I have used the black depth from the calibrated
'user' mode since that had returned the best performance in our tests and
allowed us most control over the screen hardware settings. The black
depth and CR were a bit ahead of some other similar IPS + W-LED models like the
Asus ML239H (749:1) and Dell U2312HM (749:1). It was however behind others
though like the NEC EA232WMi (933:1) and Dell U2412M (947:1).
The Samsung F2380 and NEC EX231Wp with their cPVA panels offered some fantastic contrast ratios of ~3000:1
which IPS cannot compete with at the moment.
Contrast
Stability
I wanted to see how much variance there was in the screens contrast as we
adjusted the monitor setting for brightness.
In theory, brightness and contrast are two independent parameters, and good
contrast is a requirement regardless of the brightness adjustment.
Unfortunately, such is not always the case in practice. We recorded the
screens luminance and black depth at various OSD brightness settings, and
calculated the contrast ratio from there. Graphics card settings were left at
default with no ICC profile or calibration active. Tests were made using an
NEC branded and customised
X-rite i1 Display 2 colorimeter. It should be noted that we used the
BasICColor calibration software here to record these, and so luminance at
default settings may vary a little from the LaCie Blue Eye Pro report.
|
OSD Brightness |
Luminance
(cd/m2) |
Black Point (cd/m2) |
Contrast Ratio
( x:1) |
|
100 |
276.1 |
0.30 |
920 |
|
90 |
257.3 |
0.28 |
919 |
|
80 |
238.9 |
0.26 |
919 |
|
70 |
220.4 |
0.24 |
918 |
|
60 |
201.9 |
0.22 |
918 |
|
50 |
183.2 |
0.20 |
916 |
|
40 |
164.3 |
0.18 |
913 |
|
30 |
145.6 |
0.16 |
910 |
|
20 |
126.1 |
0.14 |
901 |
|
10 |
106.8 |
0.12 |
890 |
|
0 |
87.1 |
0.10 |
871 |
|
Luminance Adjustment Range = 189 cd/m2
Black
Point Adjustment Range = 0.20 cd/m2
Average
Contrast Ratio = 909:1
|
The luminance range of the screen was fairly
decent. At the top end of the scale the luminance reached 276.1
cd/m2 which was
a little higher than the specified maximum brightness of 250 cd/m2.
At 0% brightness the screen could reach as low as 87.1 cd/m2 which
should be ok for most users, even in darker lighting conditions. This wasn't as
low as some other models we have tested but should suffice. There was a total
adjustment range of 189 cd/m2.
Black depth was lowered as you
reduced the backlight intensity as it should be, ranging from 0.30 to 0.10
cd/m2.
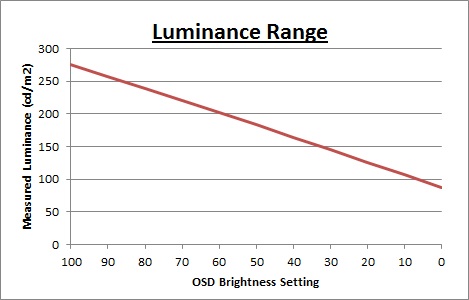
We have plotted the
luminance trend on the graph above. The screen behaves as it should, with a
reduction in the backlight intensity controlled by the reduction in the OSD
brightness setting. This is a straight linear behaviour.
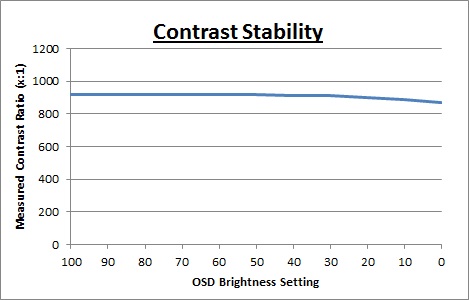
Static contrast ratio
remained very stable across the adjustment range, with an average figure of 909:1 which was
very good. These
contrast measurements were plotted on the graph shown above.
Dynamic Contrast
|
 |
The AOC i2353 features a dynamic contrast ratio
(DCR) control, which boasts a spec of 50,000,000:1 (50 million:1).
Dynamic contrast ratio involves controlling the
backlight of the screen automatically, depending on the content shown on the
screen. In bright images, the backlight is increased, and in darker images, it
is decreased. For this test I would use the colorimeter to record the
luminance and black depths at the two extremes. Max brightness would be
recorded on an almost all white screen once the DCR has caught up. Black depth would
be recorded on an almost all black screen. In real use you would never get a
100% all white / black screen, and even these tests were an extreme really for
the purposes of measuring a potential maximum useable dynamic contrast ratio. |
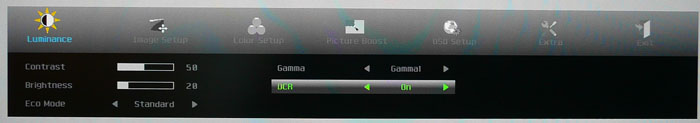
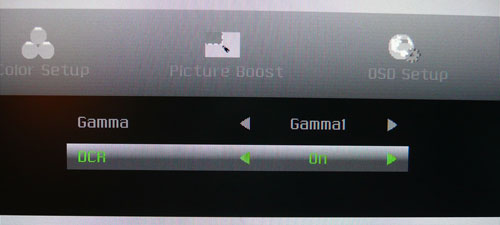
The DCR feature is only available in the 'luminance'
section of the OSD menu as shown above, with a setting for on and off
available. This is available no matter which colour temperature preset you are
in. If you are in any ECO mode other than 'standard' though, it will
automatically revert you back to standard when you turn DCR on. The rest of
the controls in the 'luminance' section then become greyed out.
|
|
Dynamic Contrast |
|
Specified DCR Range |
50 million : 1 |
|
Available in Presets |
All colour temp modes |
|
Settings |
On / Off |
|
Max luminance (cd/m2) |
264.01 |
|
Min Black Point (cd/m2) |
0.13 |
|
Max Dynamic Contrast Ratio |
2031:1 |
The tests that we carry out to measure dynamic
contrast ratio involve an almost completely white and almost completely black
screen. In real use you are very unlikely to ever see a full black or full white
screen, and even our tests are an extreme case to be honest. Carrying out the tests in this
way does give you a good indication of the screens potential maximum dynamic contrast ratio in
real life situations however.
The DCR did seem to work reasonably well which was
a pleasant change from most modern screens we test. The transitions are very
smooth and quite slow to happen. It takes around 8 - 9 seconds to change between
the maximum and minimum brightness levels as controlled by the DCR it seems.
It's quite hard to spot these but you can see a gradually dimming luminance of
the screen as you switch between light and dark content. The OSD menus
brightness setting remains greyed out and does not change, so it's not possible
to spot via the menu how fast or slow the changes are, and to what brightness
levels the screen is being set.
Maximum luminance was recorded at 264.01
cd/m2 and
minimum black point was 0.13 cd/m2. This gave us a useable dynamic
contrast ratio of 2031:1 which was reasonable. Obviously nowhere near the
specified 50 million:1 figure though. Even if we assumed the DCR feature could
control the maximum range of brightness adjustments from 0 - 100%, we wouldn't
arrive at a figure any where near that. If we take the maximum luminance
(276.1) and minimum black point (0.10) from our contrast stability section we
would only achieve a DCR figure of 2761:1. The real life figure in practice is
not far off this at 2031:1.
To be able to achieve a figure
anywhere near the 50 million:1 the black depth would need to be able to reach as
low as 0.000006
cd/m2 which
obviously it can't do. In fact you'd have to be turning the backlight off to
achieve this but that black would then effectively be 0 cd/m2 and you
might as well quote 'infinity:1' as a spec. Some screens do even switch the
backlight off when there is a 100% black screen (which you'd never see in real
use admittedly) which would explain how some manufacturers get to these crazy
specs. In the case of the i2353 that doesn't happen. We'd rather see a modest
figure like this 2031:1 which is useable in practice than some crazy spec which
you can never even achieve apart from in a lab or extreme tests.
Viewing Angles
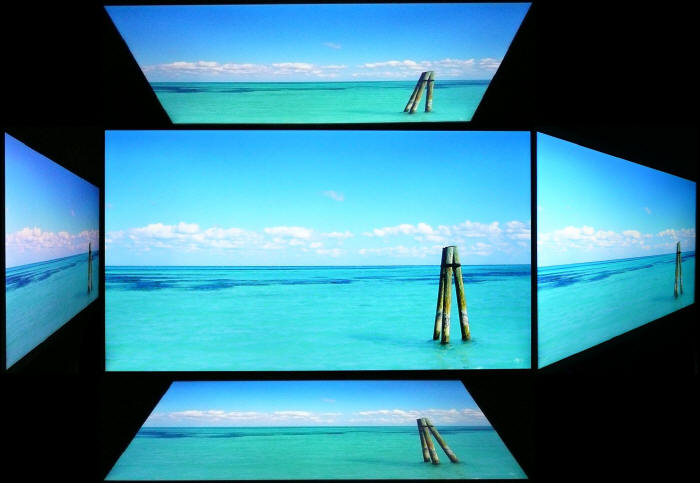
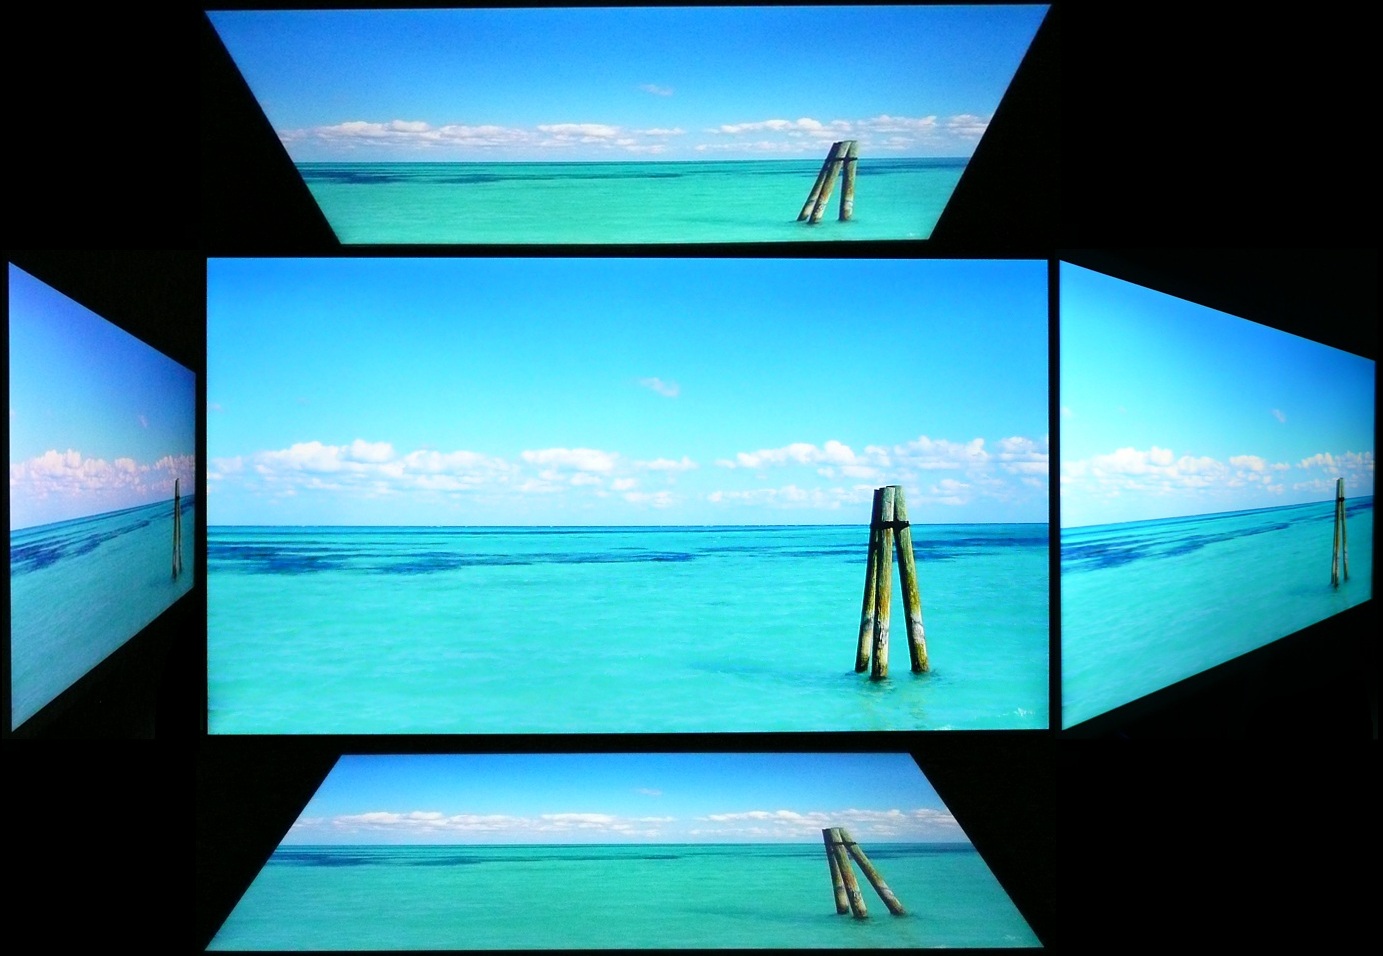
Above: Viewing
angles shown from front and side, and from above and below. Click for
larger image
Viewing angles of the i2353 are very good,
as you would expect from a screen based on an e-IPS panel. Horizontally there
are very wide fields of view with a small contrast shift only really becoming
noticeable from a fairly wide angle of about 45°. Vertically, the contrast shift
was more obvious and appeared at smaller angles away from a central point.
The
panel is free from any off-centre contrast shift which you see from VA matrices,
and this is why IPS technology is so highly regarded in the colour enthusiast
and professional space. It is also free of the very noticeable contrast and
colour tone shifts you see from TN Film panels vertically.
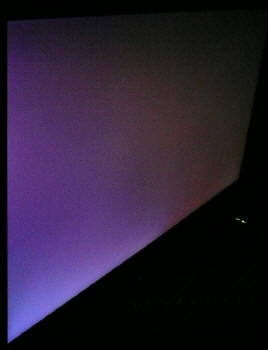
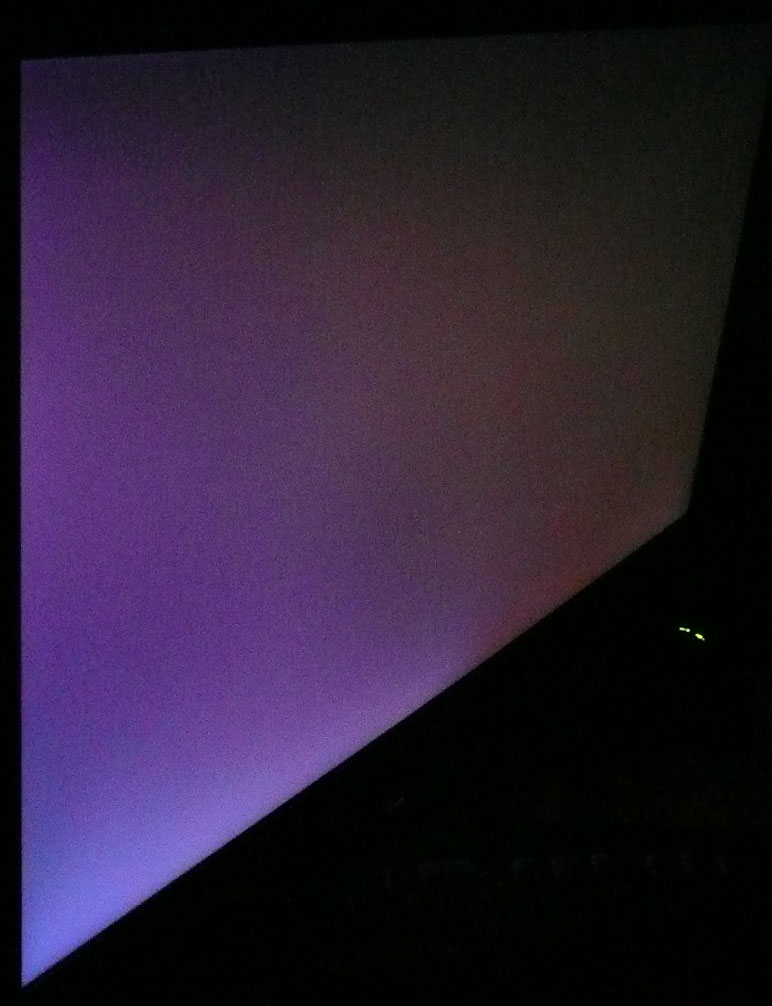
Above: View of an
all black screen from the side. Click for larger version
On a black image there is a rather noticeable
purple glow from the panel as you can see from the image above. This becomes
more pronounced from a wider angle. From a normal line of sight you can see this
purple glow towards the corners of the screen as you view from head on, but it
is not too bad. In normal working conditions you don't really notice this, but
if you were working in darkened room conditions or with a lot of dark content
this might prove a problem. There is no A-TW polarizer on this panel which is
rarely used now in the market but was implemented on some older screens to
improve the off centre black viewing.
Panel Uniformity
Measurements of the screens luminance were taken
at 35 points across the panel on a pure white background. The measurements were
taken using BasICColor's calibration software package, combined with the NEC
customised X-rite
i1 Display 2 colorimeter. The above uniformity diagram shows the difference, as
a percentage, between the luminance recorded at each point on the screen, as
compared with the reference point of a calibrated 120 cd/m2. This is
the desired level of luminance for an LCD screen in normal lighting conditions,
and the below shows the variance in the luminance across the screen
compared with this point. It is worth noting that panel uniformity can vary from
one screen to another, and can depend on manufacturing lines, screen transport
and other local factors. This is only a guide of the uniformity of the sample
screen we have for review.
Uniformity of Luminance
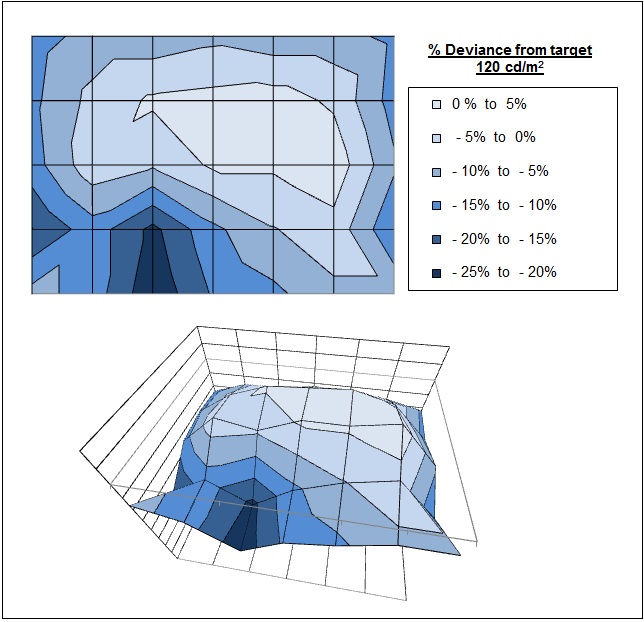
The luminance uniformity of the i2353 was
moderate, but did show some areas of concern. Around 63% of the screen was
within 10% deviance from the 120
cd/m2 central point. However the top
and right hand half did seem to be closer to this
luminance than the other areas. There was some significant deviance in the
luminance in the bottom left hand area where it dropped down to 96 cd/m2
in the most extreme case. This result overall was a little disappointing and
something to perhaps be wary of. Results may of course vary.
Backlight Leakage
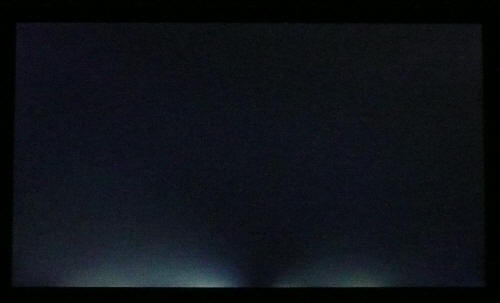
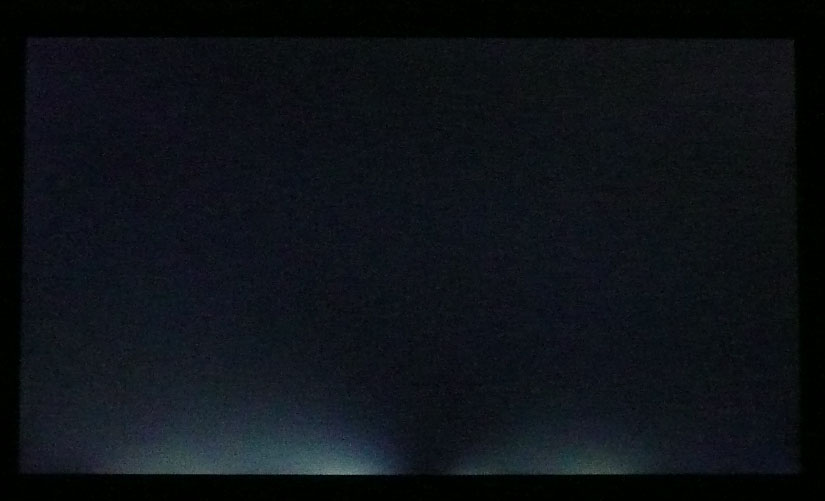
Above: All black screen in a darkened room. Click for larger version
As usual we also tested the screen with an all
black image and in a darkened room. A camera was used to capture the result. You
will immediately notice two rather noticeable areas of backlight leakage from
the bottom edge of the panel. This is a shame since the rest of the panel showed
very little leakage in this test. This issue along the bottom edge is quite
obvious in practice if you are viewing dark content, but not an issue with
normal day to day work. Perhaps this is an issue with producing such a thin
profile screen as it must be difficult to implement the panel and backlighting
in such a small case.
General and Office Applications
The i2353 has a nice high resolution of 1920 x
1080 which is good for side by side office work. I don't think it's as practical
as a 16:10 format screen with 1920 x 1200 resolution though as you do lose a bit
vertically and the screen did feel smaller than a 'normal' 24" model. The aspect
ratio of this screen is a pretty common trend in today's market with the move to
multimedia orientated displays and widescreen formats. With a pixel pitch of
0.265mm, the text was comfortable and of a decent size for prolonged office use.
Picture quality was very good using the HDMI and D-sub connections, with HDMI
providing a slightly sharper image. As I've already said earlier in the review,
it would have been good to see DVI provided as well.
You will want to turn down the default brightness
setting for the screen as the luminance is too high out of the box. A reduction
from 90% to around 20 - 25% should return a more comfortable luminance around the
120 cd/m2
mark out of the box. The screen can offer a decent luminance adjustment range
from the brightness control which is good, and can reach as low as ~87
cd/m2 which should be ok for most
users, even in darkened working conditions. There is a preset mode available for
'text' from the ECO mode option and this locks the brightness control at 20%.
The 'internet' option is a little brighter with a 40% brightness setting. These
might be useful to some people depending on how they have their normal mode set
up.
Ergonomically the screen was limited, with only a
stiff tilt option available. It would have been nice to see height, pivot and
rotate available from the stand which can be useful in office situations. It
would have also been good to see some USB ports included on this model which are
sadly missing. These are useful for connecting external devices like cameras and
printers and it was a shame there were none available. The integrated 2x 2W
speakers are very quiet and so only really suitable for the odd 'office' noise,
or maybe the occasional Youtube video or mp3. They aren't up to much though.
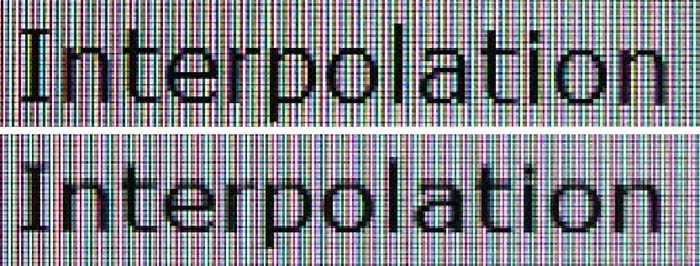
Above: photo of
text at 1920 x 1080 (top) and 1680 x 1050 (bottom)
The screen is designed to run at its native
resolution of 1920 x 1080 and at a 60Hz recommended refresh rate. However, if
you want you are able to run the screen outside of this resolution. We tested
the screen at a lower 1680 x 1050 resolution to see how the screen handles the
interpolation of the resolution. At native resolution the text was sharp as
you can see from the top photograph. When you switch to a lower resolution the
text is quite a bit more blurry. There is some overlapping
of the text across sub-pixels as you can see in the photo which results in this
blurring. Native resolution is recommended where possible.
Responsiveness and Gaming
Display Comparisons
The screen was tested again using the chase test
in PixPerAn for the display comparisons. As a reminder, a series of pictures
are taken on the highest shutter speed and compared, with the best case example
shown on the left, and worst case example on the right. This should
only be used as a rough guide to comparative responsiveness but is handy for a
direct comparison of the impact of this setting:
23" 5ms G2G
LG.Display e-IPS (W-LED)
23"
5ms G2G LG.Display e-IPS (W-LED)
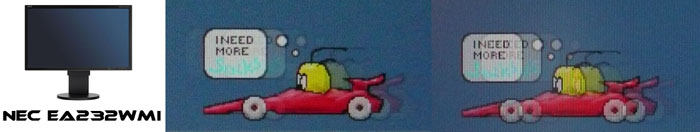
23"
14ms LG.Display e-IPS (W-LED)
23" 8ms G2G
LG.Display e-IPS (W-LED)
23"
5ms G2G LG.Display e-IPS (W-LED) - Trace Free setting 40
The i2353 is rated by AOC as having a 5ms G2G response time which implies the use of
overdrive /
response time compensation (RTC) technology, used to boost pixel
transitions across grey to grey changes. The panel
being used is an LG.Display LM230WF3-SJC1. There is no specific control over the
overdrive impulse via the OSD menu as there is with some screens and so you will
have to rely on the factory set up. Have a read about response time in
our
specs section if any of this is new to you.
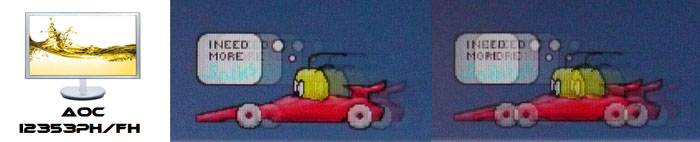
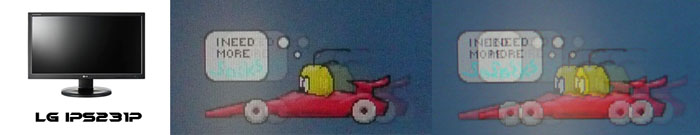
I have provided a comparison of the i2353 first of
all above against 4 other 23" screens we have tested which use IPS panel
technology and W-LED backlighting. The i2353 performed quite similarly to the LG
IPS231P and NEC EA232WMi in practice. This might seem counter-intuitive since
the LG and AOC models are listed with a 5ms G2G response time, suggesting a
heavy dose of overdrive is being used. On the other hand the NEC has a quoted
14ms response time and does not use any form of overdrive technology. In
practice however the AOC and LG models show quite a noticeable amount of motion
blur and do not show the kind of smooth, sharp movement you might expect from a
fast IPS panel. They both perform more like the NEC in real use. This goes to
show that you can't always trust a reported spec. It seems that the overdrive
impulse is very light on the AOC i2353, if it is even used at all. There are at least no
overshoot or dark/pale artefacts caused by the overdrive impulse which can cause
an issue if the overdrive technology is applied too aggressively or poorly
controlled.
The Dell U2312HM and Asus ML239H show less motion
blur in practice and do have a faster response time. The Dell dos introduce a
small dark overshoot as you can see from the above images. Both of those screens
are more suited to gaming than the i2353 however due to their faster response
time.
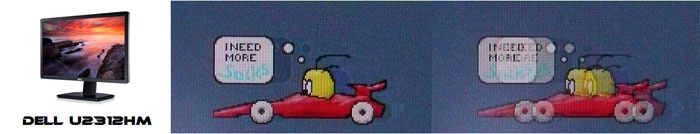
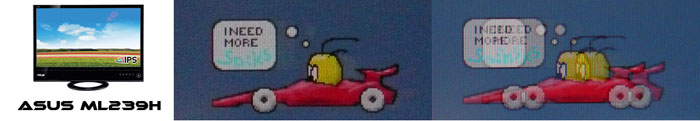
23" 5ms G2G
LG.Display e-IPS (W-LED)
23"
8ms G2G LG.Display e-IPS (CCFL)
24" 8ms G2G
LG.Display e-IPS (W-LED)

24" 6ms G2G LG.Display H-IPS (WG-CCFL)
21.5" 8ms G2G
LG.Display e-IPS (W-LED) - Video OverDrive = On
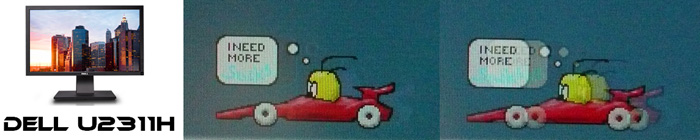
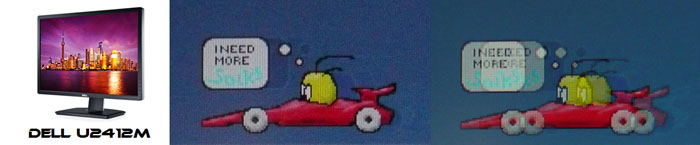
I have also provided a comparison of the i2353 against some other popular IPS
models in a similar size, ranging from 21.5 to 24". As you can see the i2353 is
not as fast as the Dell U2311H which is a highly regarded screen in terms of its
responsiveness. The Dell U2412M was also good although like the smaller
U2312HM there was a dark artefact and overshoot present. The Dell U2410 and HP
ZR2240w also showed low levels of motion blur and no obvious overshoot. The AOC
does unfortunately fall behind a bit in pixel response times in practice
compared with these other IPS models. It's not super-slow and doesn't show any
severe ghosting or anything, but it does show more motion blur than some of
these other competing models. It doesn't live up to its 5ms G2G spec certainly.
23" 5ms G2G
LG.Display e-IPS (W-LED)
23.6" 2ms G2G CMO TN Film (120Hz)
22" 3ms G2G Samsung TN Film + 120Hz
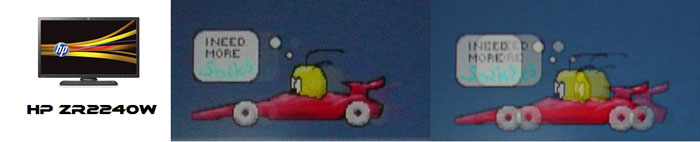
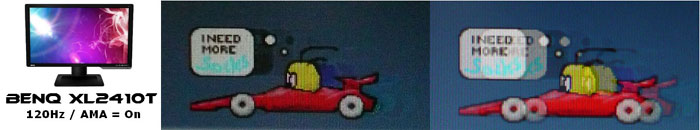
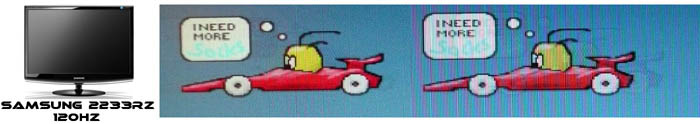
I've also included a comparison above against two
gamer-orientated screens, both featuring heavily overdriven TN Film panels, and
120Hz technology. The pixel responsiveness of both of these is ahead
of the i2353, and the 120Hz frequency allows for
improved 120fps frame rates and the support of 3D content as well. The BenQ
XL2410T does show some even more obvious RTC overshoot in the form of very dark
trails behind the moving image (speech bubble and head) which is unfortunate,
and a sign that the RTC impulse is too aggressive. The Samsung 2233RZ remains
our champion in this test.
The responsiveness of the i2353 should be ok for some moderate gaming but it is
not as responsive as many of the other IPS screens in this size range which show
less motion blur and smooth movement of images. The 5ms G2G quoted spec is a bit
misleading and the screen seems to behave more like a screen without an
overdrive impulse applied. There are faster options for more serious gaming
available but it can certainly still handle some light to moderate gaming
without issue.
Additional Gaming Features
Aspect Ratio Control - The i2353 supports
aspect ratio control options through the OSD 'extra' menu. There are options
for wide and 4:3 aspect only. There is no defined 1:1 pixel mapping mode or an
automatic detection of the aspect ratio.
Preset Modes - There is a 'game' preset
mode available in the menu if you want it which basically acts as a preset
brightness setting which sets the monitor at 60%. This might be useful as a
quick access to a higher brightness rather than changing your customised normal
mode all the time if you want brighter conditions for gaming. The dynamic contrast ratio
is available in the OSD menu as well although it will revert you back to the
standard preset mode (from game) and will control the backlight intensity from
there. This does work reasonably well with a DCR of up to ~2031:1 available.
Input Lag
We've had some reader enquiries recently about
input lag and so thought we would give a bit more information here before we
discuss the results obtained for this display:
What is Input Lag?
Input lag is described as the lag between the output from a graphics card and
the image which is displayed on the screen you are using. This should not be
confused with pixel response time which describes the speed at which a pixel can
change from one orientation to another. Pixel response times impact aspects such
as motion blur and ghosting, whereas input lag is a delay between what is sent
to the monitor, and what you actually see. Of course both do contribute to the
overall performance and experience of the display when used for gaming.
Input Lag Measurement Techniques - The Stopwatch Program
Traditionally input lag has been widely measured by hooking up a CRT screen to
the same graphics card and PC as the TFT display. By cloning the output, the
user could provide a comparative test of the output of the CRT vs. the output of
a TFT. A CRT would show no lag on top of the output from the graphics card which
is vital for those wanting to play fast games, where reaction times are key.
This is what many users are used to, having come from older CRT displays. Many
high end gamers still use CRT's as well for high refresh rates and frame rates
and so the move to a TFT can be worrying, especially when you start throwing in
a conversation about lag of the output image.
By running the screens side by side in this way in clone mode, you can often see
that the TFT lags behind the CRT. This is sometimes noticeable in practice even,
but stopwatch programs have been used for many years to give a way to record and
synchronise the output so that the difference could be recorded. High shutter
speed photographs can then be taken to show just how much the TFT lags compared
with the CRT. The level of lag really depends on the TFT display, and is
controlled by many signal processing factors including, but not limited to the
internal electronics and scaling chips. Some manufacturers even take measures to
help reduce this, providing modes which bypass scaler chips and options which
reduce the input lag. These are often reserved for gamer-orientated screens but
the results are often quite noticeable.
This stopwatch method has been used for many years by many review websites and
end users. It's easy to set up, doesn't cost anything and allows a reasonable
comparative view of a CRT output vs. a TFT output. It can also be useful for
providing a comparison between different models over time.
The method is admittedly not 100% accurate however. There are areas of
inaccuracy inherent to this method. Some stopwatch programs are based on flash
which can introduce issues with frame rate support, especially when viewed from
an internet source and browser. The programs can introduce a degree of error if
vsync is active and due to 2D native refresh rate settings of 60Hz. There's
never been a defined standard for measuring input lag and so this has been used
for a long time and widely accepted as a decent enough representation of what a
user may experience.
More Advanced Measurement
Techniques
Some websites take this whole area one step further and even use an oscilloscope
and photosensor to measure the input lag of a display. This is of course an even
more precise measurement and can help you show the true image lag along with the
typical response times of a pixel transition. This is then used to give you both
the overall experienced 'lag' of the image and the lag specifically between the
electronics and the pixel change instruction (the pure signal processing time).
We do
not have access to such a method at this time and of course it would not come
cheap.
We are investigating alternative means to measure input lag in the future for
our reviews in an effort to help provide even more accurate results. We did not
want to completely remove this section since I know it is useful to many readers
and it would be missed. While it might have varying degrees of accuracy, I will
say that this method has been used for many years by many sources and although
there is likely a varying degree of error introduced in this method, it can
still allow you to give a reasonable comparison between displays.
Classification of the lag into low, medium and high for instance is possible and
the method can help give you an idea of the relative output of a TFT compared
with a CRT. It's an indication though as opposed to a precise measurement.
If you are particularly bothered about input lag then I would encourage you to
compare results between sources and refer to other review sites as well where
methods like this are used. In many cases the figures are actually quite
comparable but by all means if you need absolute measurements refer to other
sources as well to help with your decision.
Input Lag
Classification
To help in this section we will also introduce a broader classification system
for these results to help account for some of the remaining error in the method
and classify each screen as one of the following levels:
-
Class 1)
Less than 16ms / 1 frame lag - should be fine for gamers, even at high levels
-
Class
2)
A lag of 16 -
32ms / One to two frames - moderate lag but should be fine for many gamers.
Caution advised for serious gaming and FPS
-
Class
3)
A lag of more
than 32ms / more than 2 frames - Some noticeable lag in daily usage, not
suitable for high end gaming
|
 |
 |
Class
2 |
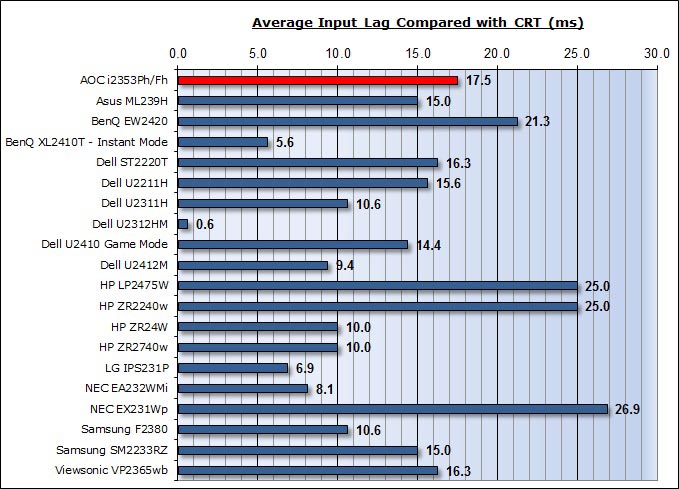
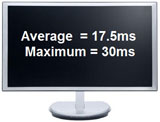
On to our tests then in their current form. The
AOC i2353 showed 17.5ms of input lag on average in these tests, ranging up to
30ms maximum. This was a moderate level of lag and quite similar to some of the
other screens we have tested like the Asus ML239H in this test (15ms). A lag of
17.5ms average would put this in class 2. For reference,
Prad.de have also tested this screen using the aforementioned oscilloscope
methods for added accuracy, and have measured an overall lag in the image which
coincides with this number well at 18.1ms.
Movies and Video
The following summarises the screens performance
in video applications:
-
23" screen size makes it a reasonable option for
an all-in-one multimedia screen, although quite a bit smaller than modern LCD
TV's of course
-
16:9
aspect ratio is more suited to videos than a 16:10 format screen, as it leaves
smaller borders on DVD's and wide screen content.
-
1920 x
1080 resolution can support true 1080 HD resolution content
-
Two digital
HDMI interfaces supports HDCP for any encrypted and protected content
-
Good to see 2x HDMI available for connecting multimedia devices easily.
Additional DisplayPort is missing which might have been useful as it is
increasingly popular for external Blu-ray / DVD player connectivity.
-
Black depth and contrast ratio are good for an IPS panel although not as good
as some other models we have tested. Detail
in darker scenes and shadow detail should not be lost due to these measurements.
-
Dynamic contrast ratio is available and works to a moderate level, up to about
2031:1 maximum.
-
'Movie'' preset brightness mode is available from the preset menu which
automatically sets the screen at 80% brightness.
-
Moderate pixel responsiveness which should be able to handle fast moving
scenes in movies without real issue.
-
Wide
viewing angles thanks to e-IPS panel technology meaning several people could
view the screen at once comfortable and from a whole host of different angles.
-
Limited
and stiff ergonomic adjustments available from the stand meaning it could be
difficult to obtain a comfortable position for movie viewing in some
scenarios.
-
Some
noticeable backlight leakage from the sample we had along the bottom edge.
Leakage along any of the edges has the potential to become distracting when
watching movies, especially where black borders are present.
-
2x 2W
integrated stereo speakers on this model but these are quiet and not up to
much for movie viewing
-
No
picture in picture (PiP) or picture by picture (PbP) modes available on this
model.
Conclusion
The AOC i2353
offered a lot on paper but I did feel it ended up being a fairly modest offering
in the 23" IPS market to be honest. That's not to say it's a bad screen, I just
think it could have been a bit better in some areas. On a positive note, the
design is very attractive and the brushed aluminium finish, ultra-thin profile
and attractive base and stand looked very nice on the desk. It was certainly a
nice looking piece of kit. In some ways the features and extras were good, and
it was nice to see 2x HDMI available, some integrated speakers and a nice set of
options from the OSD menu. On the other hand it felt like a few things were
missing such as a DVI interface (or at least a DVI > HDMI cable), USB ports and
a better range of stand adjustments. Height adjustment was missed and even the
tilt was not really very easy to use. Although stereo speakers were available
they were very quiet and not really that good. Again maybe a little more
attention and these could have been useful. It just felt like a few corners were
cut here I think.
Performance wise
the default setup was reasonable and at least offered a pretty good gamma and
white point. The luminance was too high as normal, but not hard to change and
the backlight range was good. Once calibrated the screen performed well and
offered some of the good all round performance you would expect from an IPS
panel. Black depth and contrast ratio were pretty good although not quite as
good as some other competing models. At least there was a dynamic contrast ratio
which worked here, if only to a moderate degree.
Uniformity of our
test sample was not perfect unfortunately and the backlight bleed we saw was an
issue. Hopefully this will vary from sample to sample so it may not be an issue
if you are considering purchasing this model. Responsiveness did not live up to
its advertised spec at all which was a shame, although it was ok for moderate
levels of gaming.
I think to
summarise overall, the i2353 is a decent general all-round screen, not excelling
in any particular area, but offering reasonable performance in most uses. It has
a nice design and would perhaps best fit in a modern office environment for
general day to day use, some web and text work and maybe some occasional light
gaming and movies.
|
Pros |
Cons |
|
Attractive and quite unique
aluminium, ultra-thin design |
Some noticeable backlight
leakage along the bottom edge (may vary) |
|
Decent all round performance
in most areas thanks to IPS panel |
Moderate responsiveness not
living up to its spec |
|
Good range of options and
settings available |
Limited ergonomic adjustments
from the stand |
Further reading:
TestFreaks
|