Introduction
The ultrawide monitor market seems to have
grown and grown over the last few years, with most manufacturers now producing a
screen in this large size and format. Philips have just released their new
349X7FJEW display which offers some interesting specs and features. Some of the
34" models out there stick to a relatively low 2560 x 1080 resolution, but
others including this new Philips display opt for the higher 3440 x 1440
resolution. This helps produce a sharper and crisper image, giving you more
desktop real estate to work with as well. This particular screen is based on a
Samsung SVA technology panel, with a strong 3000:1 contrast ratio specification offered as a
result. It's compatible with AMD FreeSync and can support refresh rates up to
100Hz as well for gaming needs.
If you appreciate the review and enjoy reading and like our work, we would welcome a
donation
to the site to help us continue to make quality and detailed reviews for you.
|
Check Pricing and Buy - Direct Links
|
|
Amazon
|
|
TFTCentral is a participant
in the Amazon Services LLC Associates Programme, an affiliate
advertising programme designed to provide a means for sites to earn
advertising fees by advertising and linking to Amazon.com, Amazon.co.uk,
Amazon.de, Amazon.ca and other Amazon stores worldwide. We also
participate in a similar scheme for Overclockers.co.uk. |
Specifications and Features
The following table gives detailed information
about the specs of the screen:
|
Monitor
Specifications |
|
Size |
34"WS
with 1800R curve |
Panel Coating |
Light AG coating |
|
Aspect Ratio |
21:9 |
Interfaces |
1x DisplayPort,
1x HDMI 2.0, 1x HDMI 1.4
|
|
Resolution |
3440 x 1440 |
|
Pixel Pitch |
0.232 mm, 109.68 PPI |
Design
colour |
Glossy white bezel and
rear, with shiny silver stand feet |
|
Response Time |
4ms G2G |
Ergonomics |
Tilt, 150mm height |
|
Static Contrast Ratio |
3000:1 |
|
Dynamic Contrast Ratio |
50 million:1 |
VESA Compatible |
Yes 100mm |
|
Brightness |
300 cd/m2 |
Accessories |
Power cable and brick,
HDMI, DisplayPort, USB and audio cables |
|
Viewing Angles |
178 / 178 |
|
Panel Technology |
Samsung SVA |
Weight |
with stand: 8.21 Kg |
|
Backlight Technology |
W-LED |
Physical Dimensions |
(WxHxD)
810 x 444 x 292 mm |
|
Colour Depth |
16.7m (8-bit) |
|
Refresh Rate |
40 - 100Hz (inc FreeSync) |
Special
Features |
4x
USB 3.0 ports (1 with fast charging), audio in, headphone out, 2x 5W
speakers, PiP/PbP support |
|
Colour Gamut |
Slight beyond standard
gamut
117.3% sRGB |
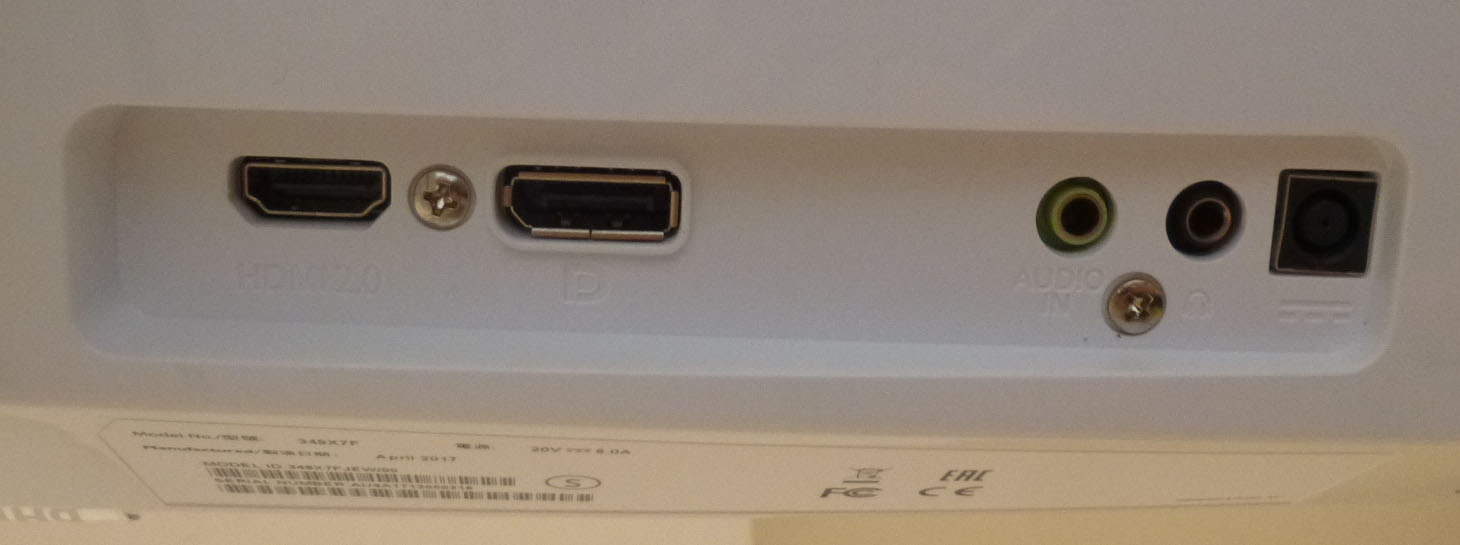
The 349X7FJEW offers a decent range of
modern connectivity
options with 1x DisplayPort 1.2, 1x HDMI 2.0 and 1x HDMI 1.4
connections offered. The
digital interfaces are HDCP certified for encrypted content and the video cables
are provided in the box for DisplayPort and HDMI which is handy.
The screen has an external power supply and comes
packaged with the power brick and cable you need. There are also 4x USB 3.0 ports located
on the back of the screen with the video connections, one offering fast charging
support. An audio-in and headphone-out connection are also provided
if you need them.
Below is a summary of the features and connections
of the screen:
|
Feature |
Yes / No |
Feature |
Yes / No |
|
Tilt adjust |
 |
DVI |
 |
|
Height adjust |
|
HDMI |
|
|
Swivel adjust |
|
D-sub |
|
|
Rotate adjust |
|
DisplayPort |
|
|
VESA compliant |
|
Component |
|
|
USB 2.0 Ports |
|
Audio connection |
|
|
USB 3.0 Ports |
|
HDCP Support |
|
|
Card Reader |
|
MHL Support |
|
|
Ambient Light Sensor |
|
Integrated Speakers |
|
|
Human Motion Sensor |
|
PiP / PbP |
|
|
Touch Screen |
|
Blur Reduction Mode |
|
|
Factory calibration |
|
G-Sync |
|
|
Hardware calibration |
|
FreeSync |
|
|
Uniformity correction |
|
Wireless charging |
|
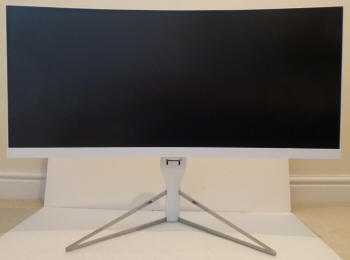
Design and Ergonomics
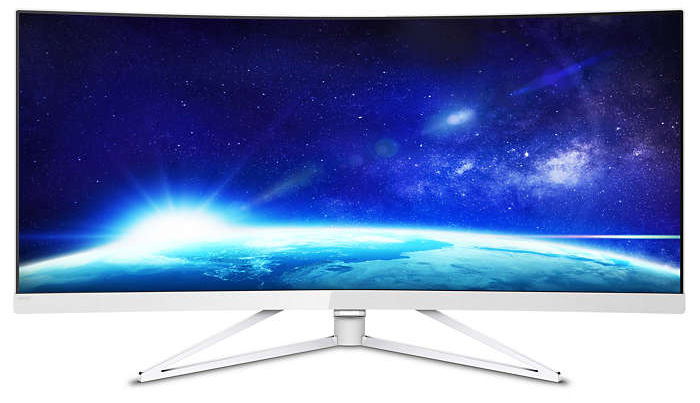
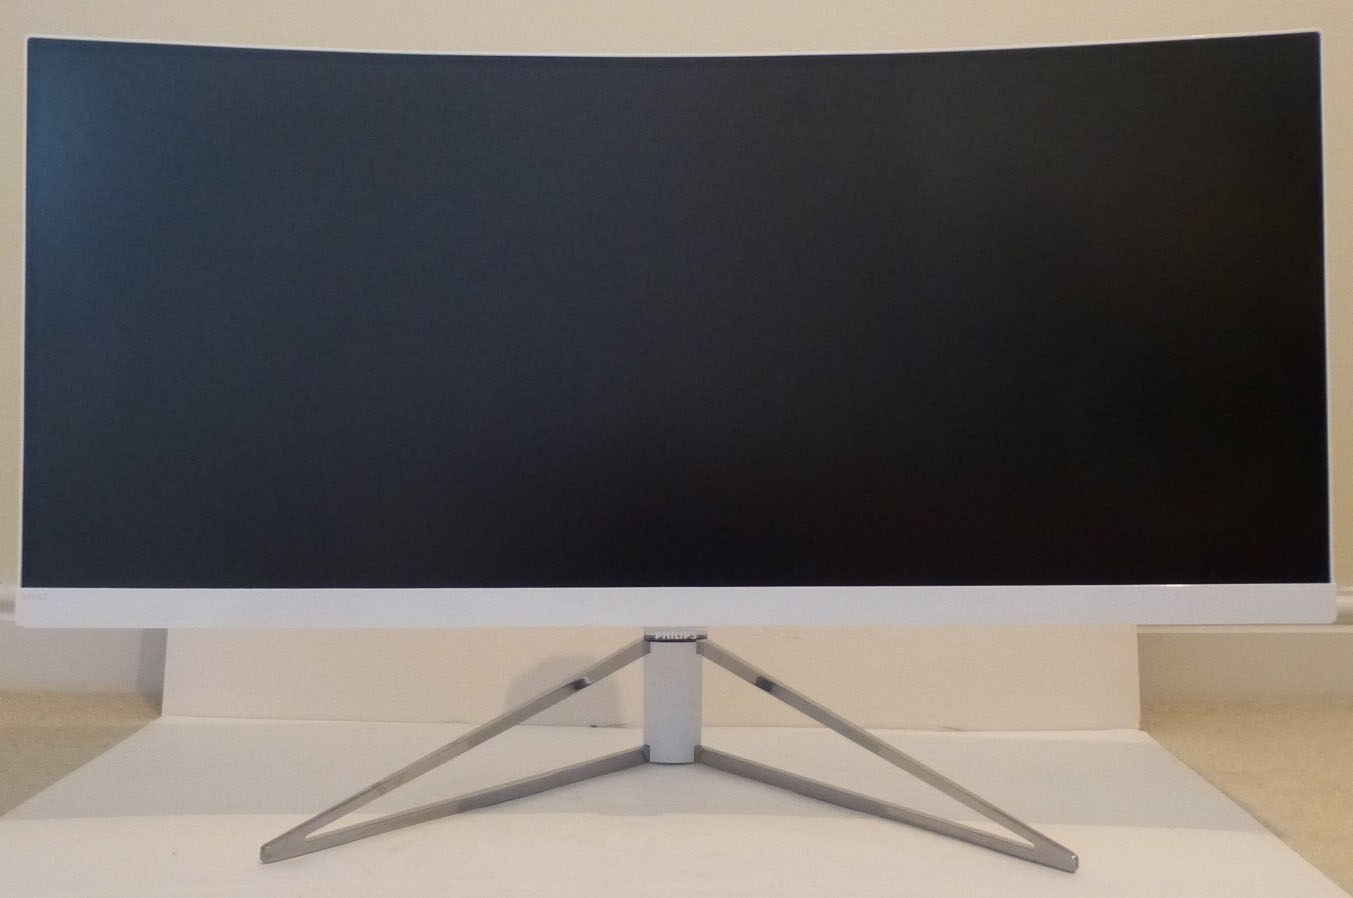
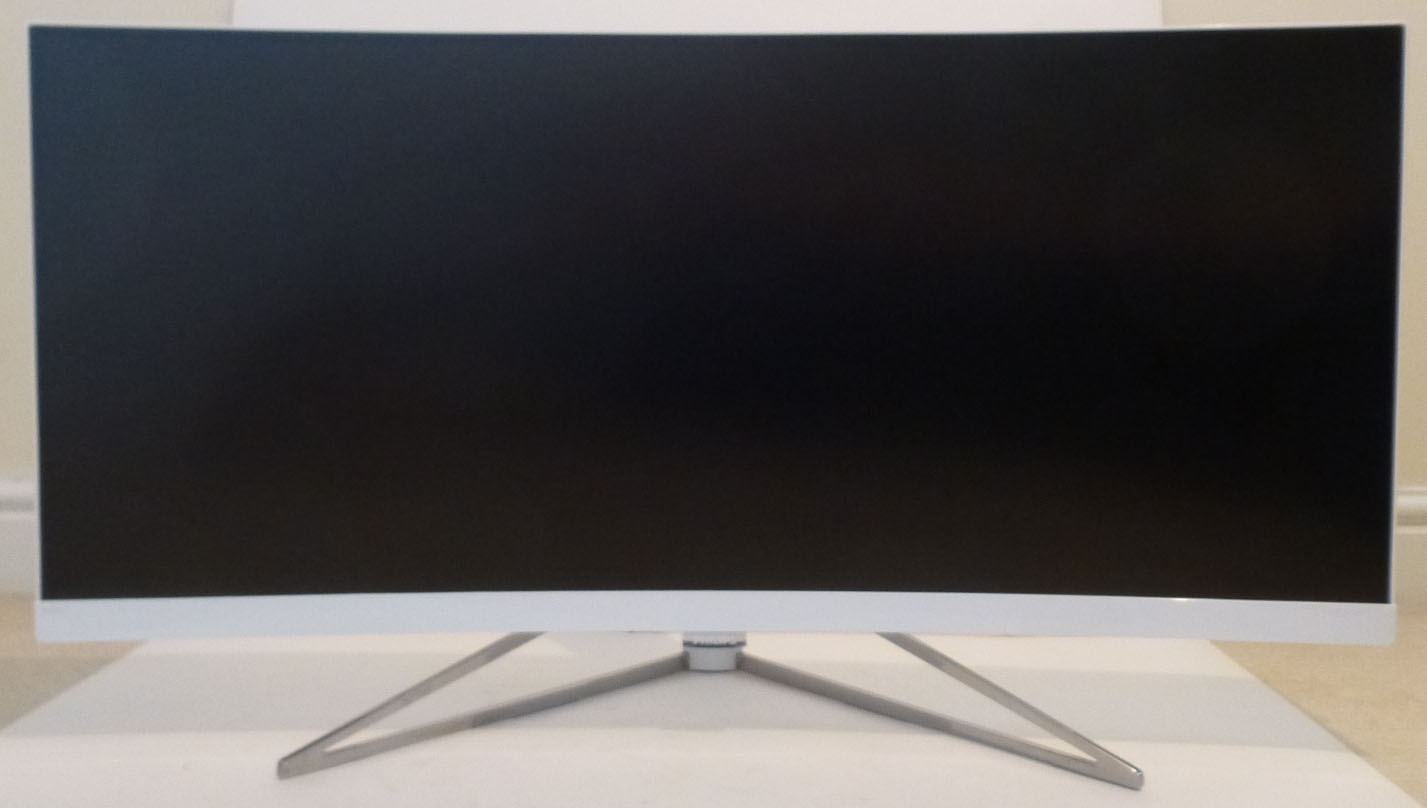
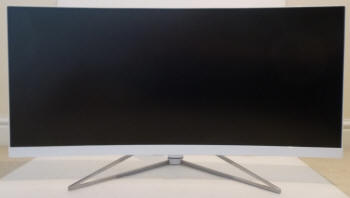
Above: front views of the screen
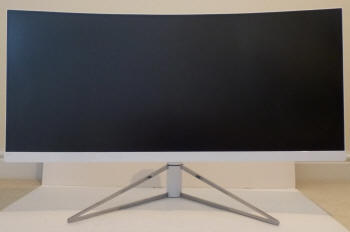
Above: front view. Click for larger version
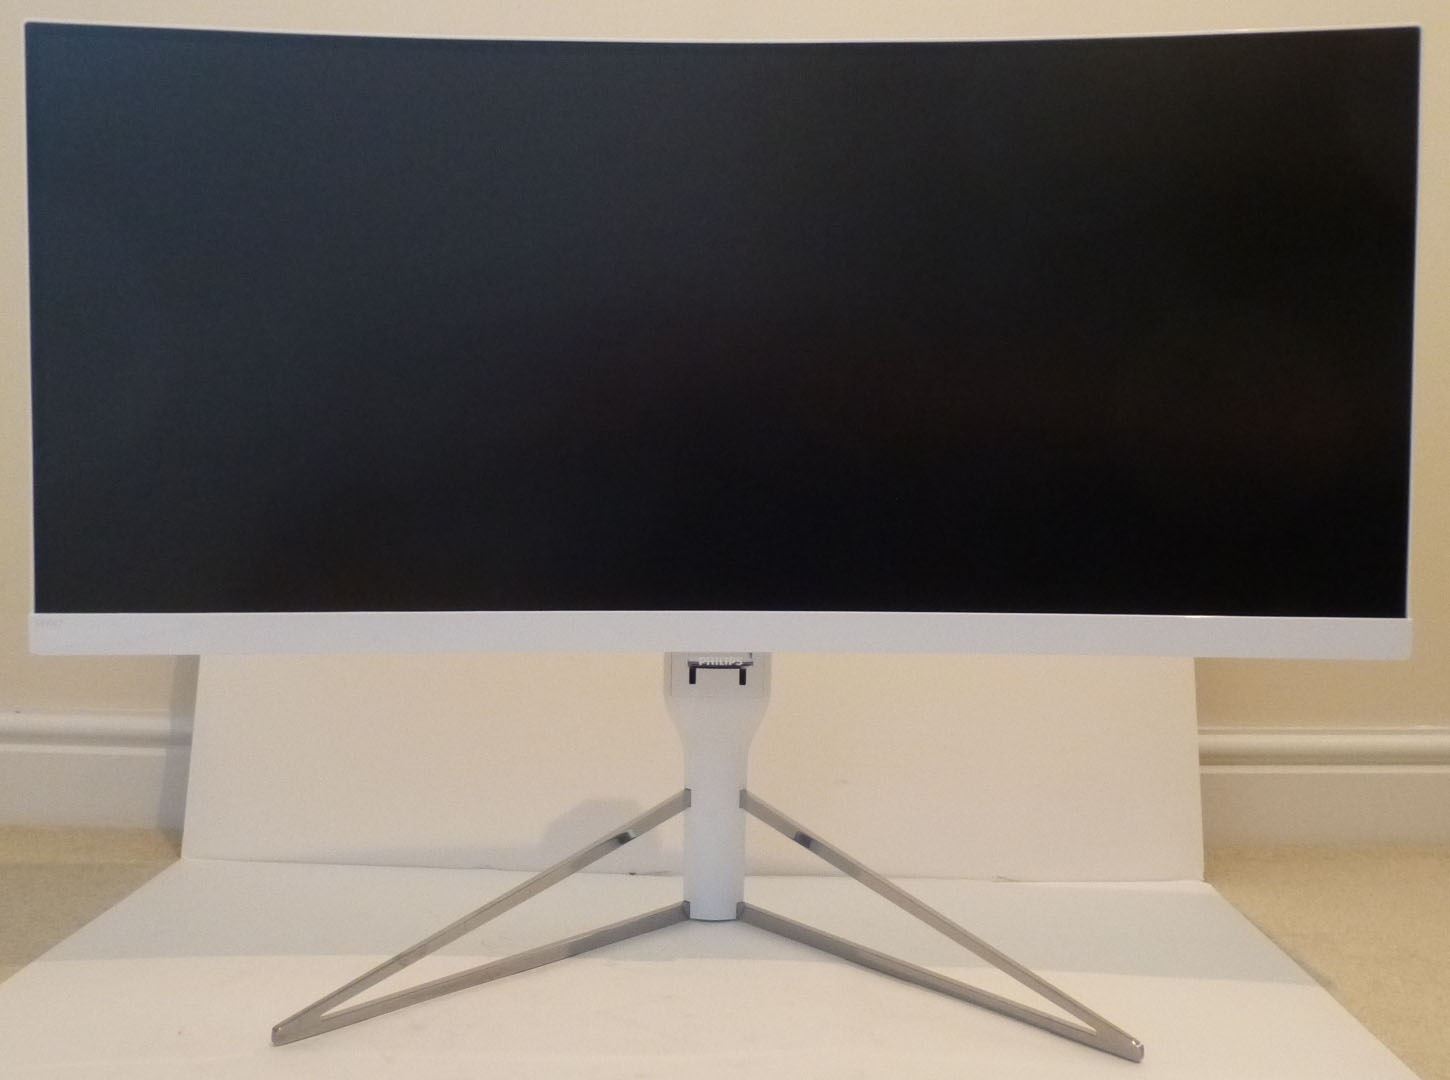
The 349X7FJEW comes in a primarily glossy
white design. There is a thin 2mm white border around the sides and top of the
screen, with an 8mm black panel edge before the picture starts. This gives a
total border size of 10mm which is nice and thin and could in theory make this a
good screen for multi-screen setups, although of course you'd need a massive
desk space to accommodate that given the size and ultra-wide format. The bottom
bezel is also a glossy white plastic and is thicker, measuring 24mm. It's not
super-reflective and looks quite attractive. There is a subtle grey coloured
"349X7" label in the bottom left hand corner, but no other writing on the front
of the bezel.
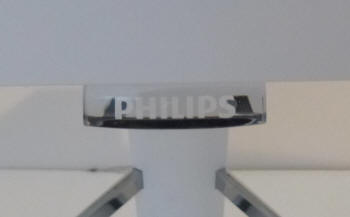
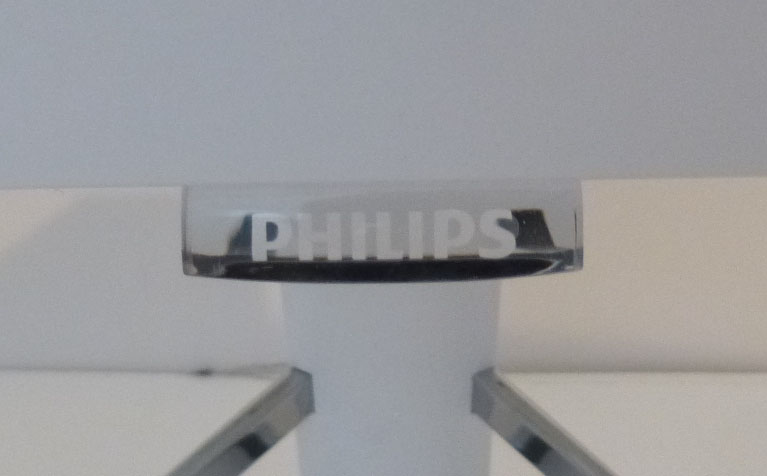
Above: view of the Philips logo sticking out of the bottom of the screen
(left) and base of the stand (right). Click for larger versions
There is a fairly large clear plastic Philips
badge sticking out of the bottom edge of the screen as shown above. This glows
white during normal screen operation, although you can also turn that off via
the OSD menu if you like. We found it a bit distracting so turned it off
ourselves. This Philips "block" flashes on and off with a white LED when the
screen is in standby, which is actually a bit annoying. You can't turn that off,
and it's fairly bright. We found ourselves powering the screen off fully when
the PC was switched off and display in standby, so that the light was completely
off.
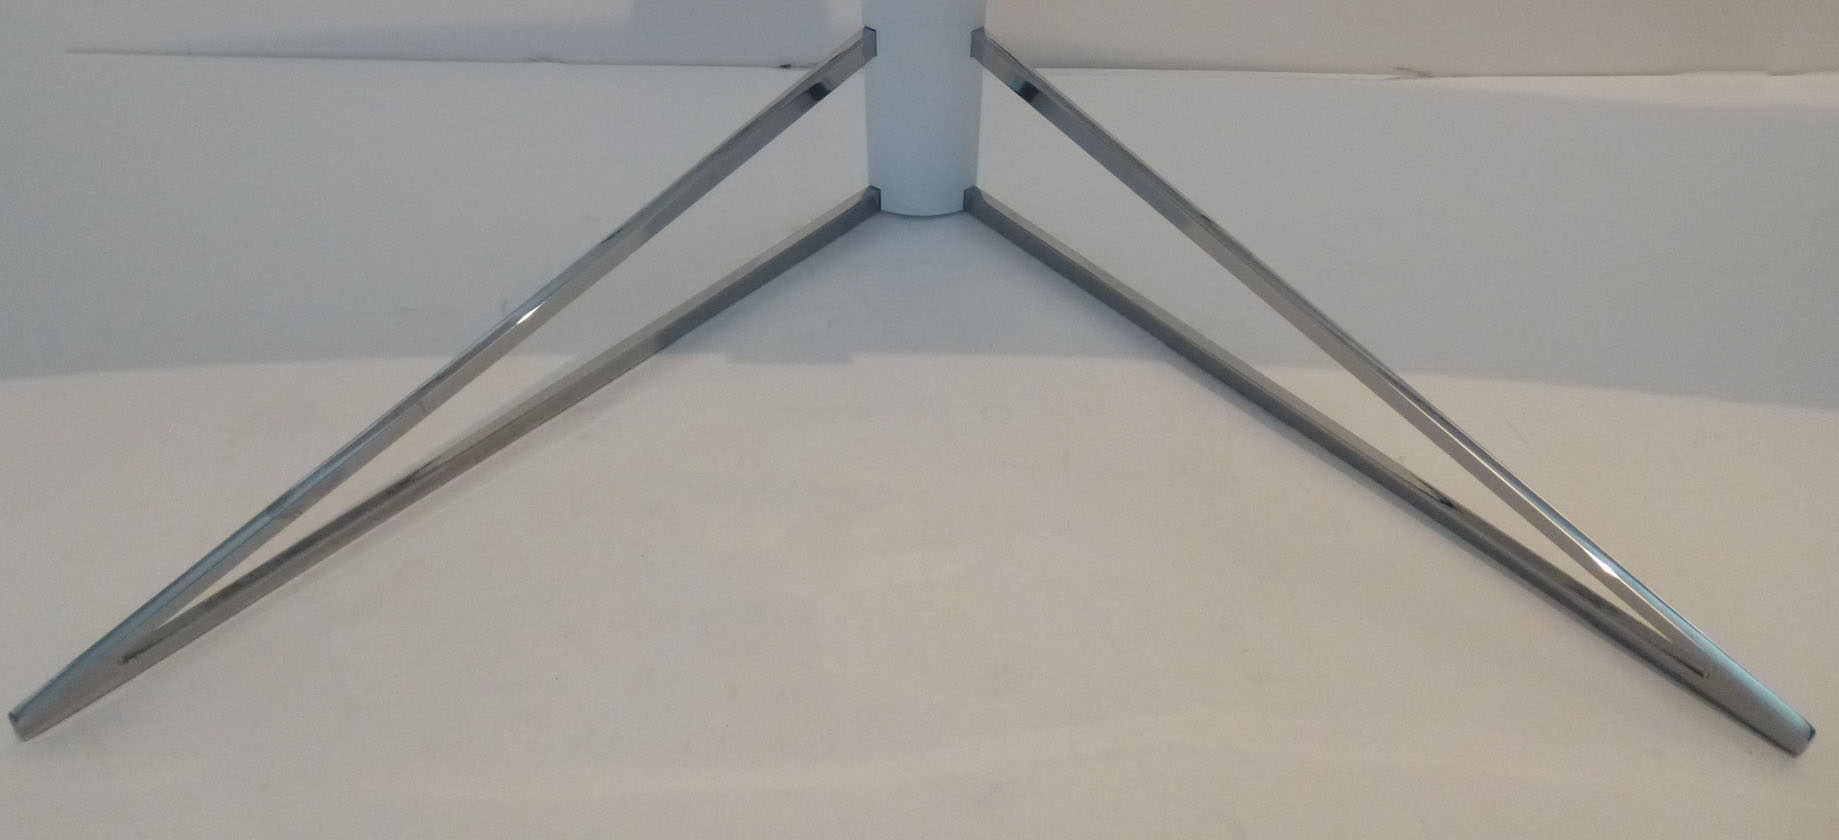
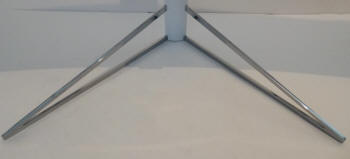
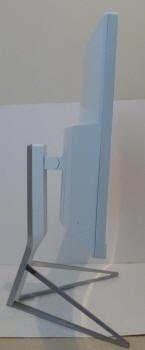
Above: back of the screen showing arm attachment. Click for larger version
The back of the screen is encased in an all
white glossy plastic. It is supported by a removable stand, which attaches via a
VESA 100mm bracket on the back of the screen with a quick release mechanism. The
arm of the stand is also white in colour with some silver trim along the edges.
The base of the stand provides a shiny silver triangular shape as you can see
above. This provides a wide and sturdy base for the large screen but it is quite
a deep footprint. You will need a reasonably deep desk so that you can move the
screen back far enough for a comfortable viewing position. The base of the stand
is about 290mm deep so keep that in mind. The "arms" of the base cannot be
moved.


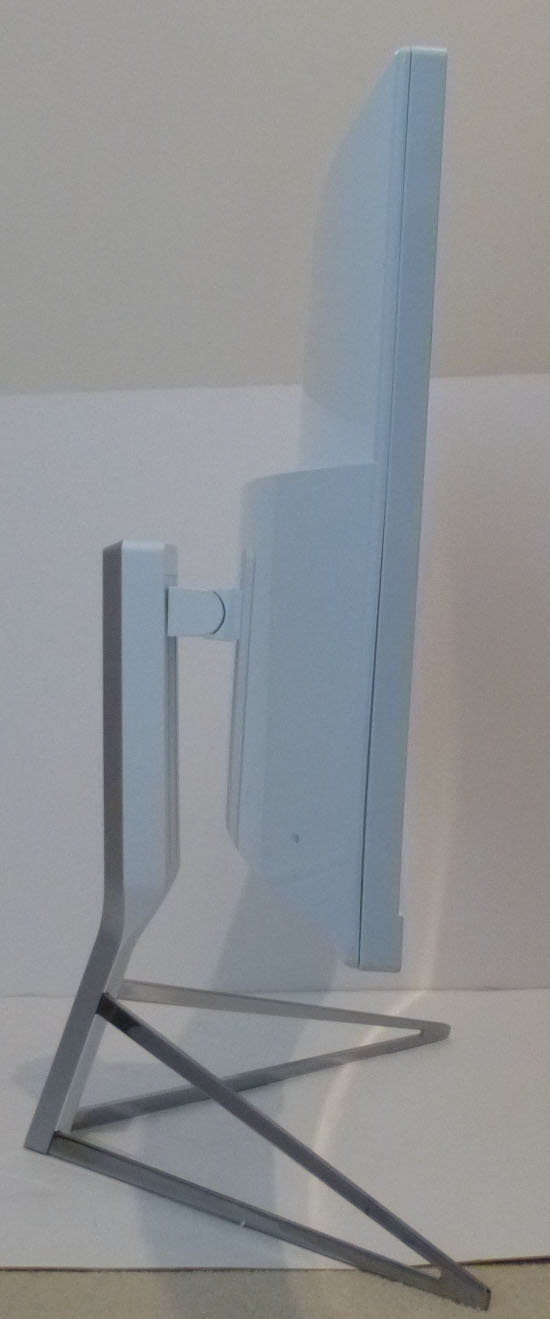
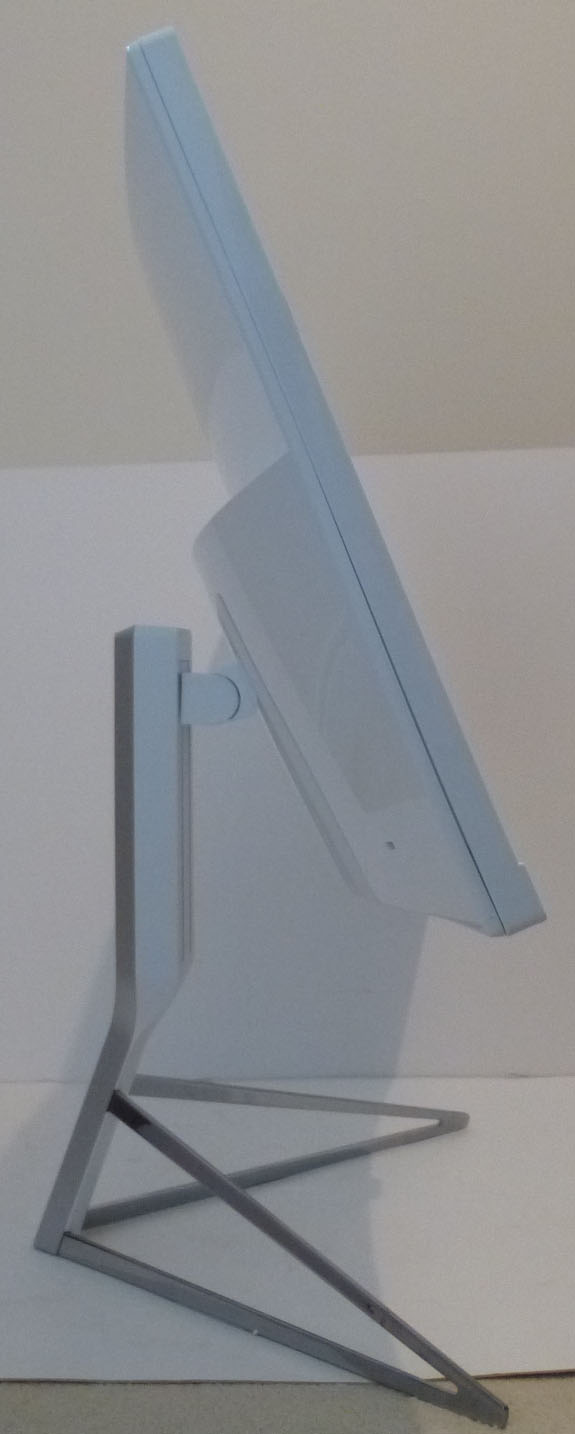
Above: full tilt range shown. Click for larger versions
There is a moderate set of ergonomic
adjustments offered from this screen. Tilt is smooth but quite stiff to operate,
but does offer a nice wide range of adjustments as shown above.
Above: full height adjustment range shown. Click for larger versions
Height
adjustment is a little stiff but offers smooth movements as well, with a
total adjustment range of 150mm. At the lowest setting the bottom edge of the
screen is ~70mm from the edge of the desk, and at maximum extension is is
~220mm. Side to side swivel and rotation adjustments are not offered on this
model. It was a bit of a shame not to have side to side swivel, but the rotation
is not necessary or practical on a screen this size and format. There was some
side to side wobble from the screen as you moved it around because of the
ultra-wide format, but during normal use it was stable on the desk with very
little wobble.
A summary of the ergonomic adjustments
are shown below:
|
Function |
Range |
Smoothness |
Ease of Use |
|
Tilt |
Yes |
Smooth |
Stiff |
|
Height |
150mm |
Smooth |
A little stiff |
|
Swivel |
n/a |
- |
- |
|
Rotate |
n/a |
- |
- |
|
Overall |
Moderate set of
adjustments but with good ranges. Tilt is quite stiff to move. |
The materials were of a good standard and the
build quality felt pretty good as well. There was no audible noise from the screen,
even when conducting specific tests which can often identify buzzing issues.
The whole screen remained cool even during prolonged use as well which
was pleasing.
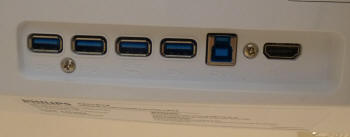
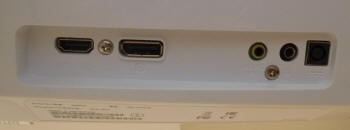
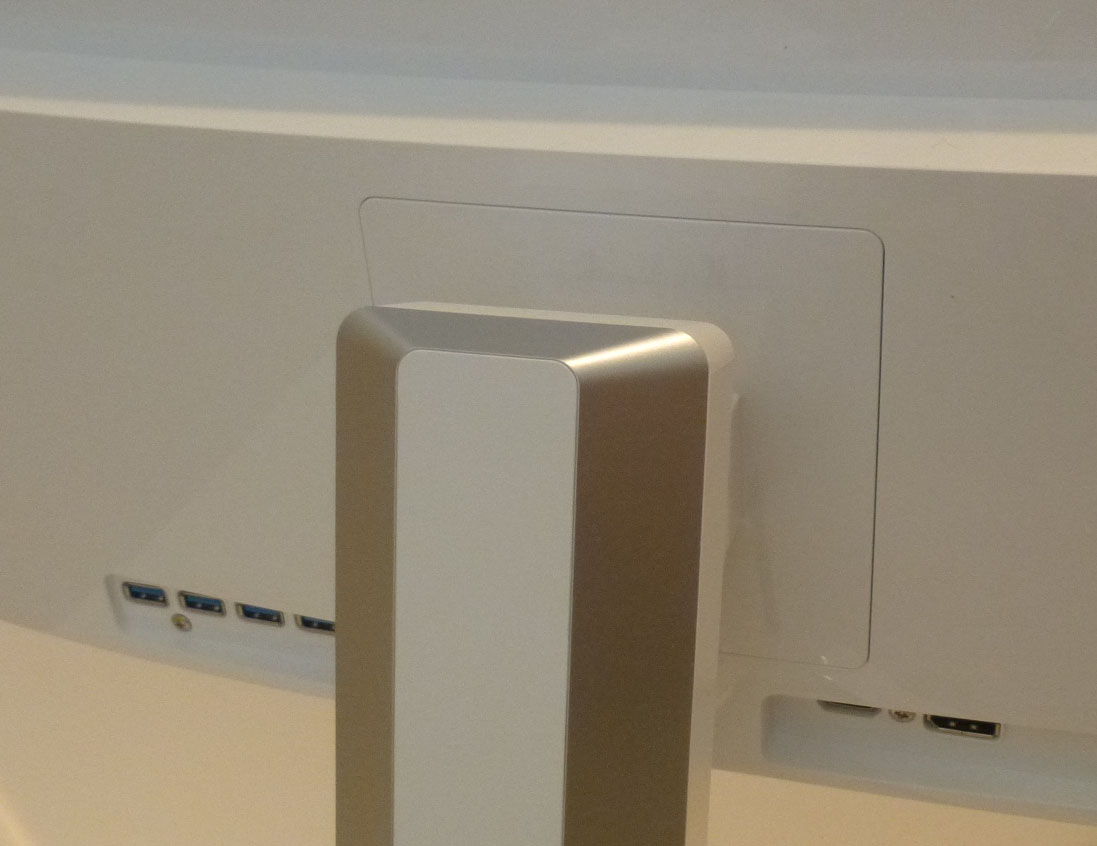
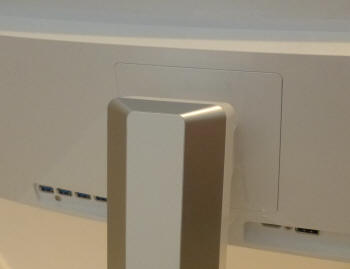
Above: connection options on the back of the screen on either side of the
stand. As viewed from the back. Click for larger
versions
The back of the screen features the
connections. To the left of the central stand are the 4x USB 3.0 ports and USB
upstream connection. There is also the HDMI 1.4 connection. Then to the right
of the stand is the HDMI 2.0 and DisplayPort interface, along with the audio
input, headphone output and power connection.
OSD Menu
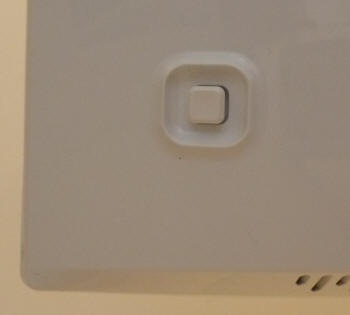
Above: OSD control joystick on the back right hand side of the screen. Click for larger
version
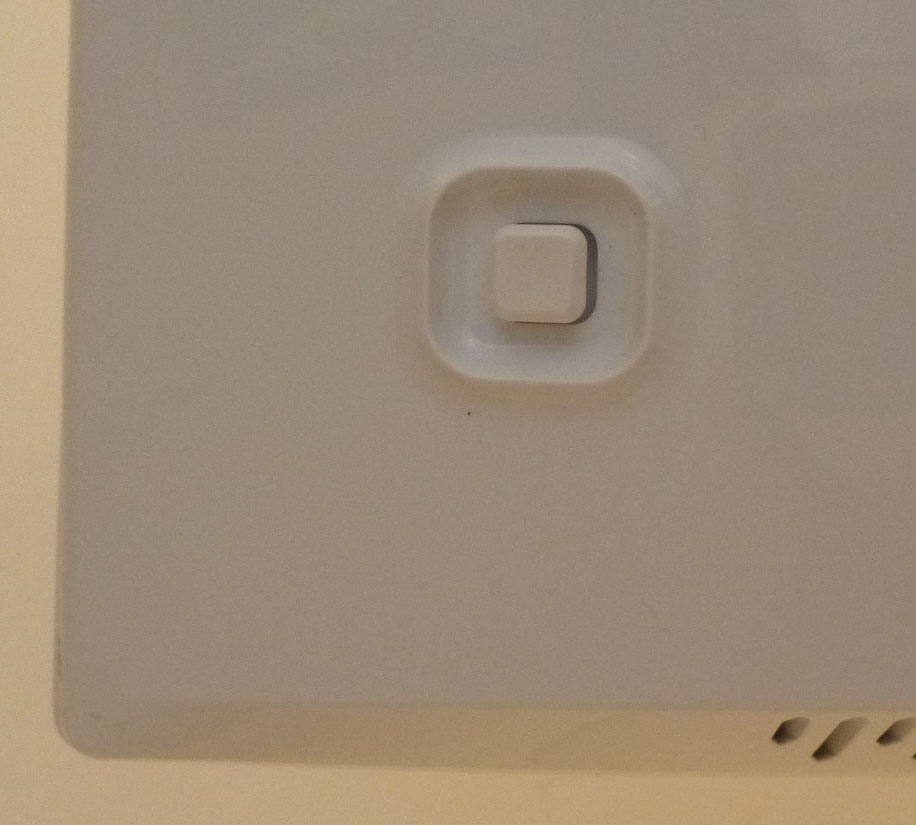
The OSD menu is controlled through a single
joystick control located on the back of the screen on the right hand bottom
area. There are no additional buttons to press, just this one joystick. Pressing
and holding the button in will turn the power on/off.
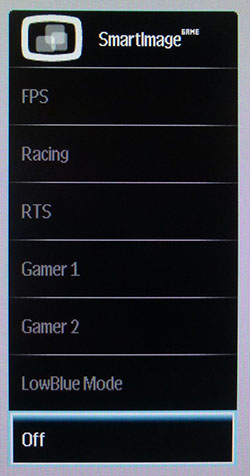
There is quick access launch from the
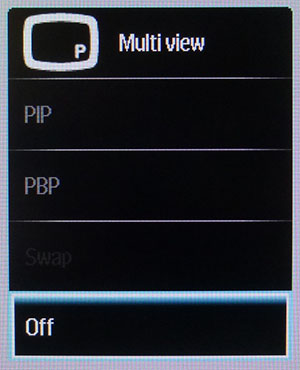
joystick to a few options. Pressing left brings up the SmartImage preset mode
menu, pressing up brings up the MultiView PiP and PbP menu, down brings up the
audio source menu and right will bring up the main OSD menu with all the other
options to choose from.
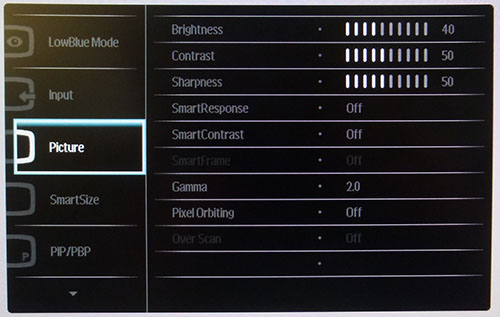
The main OSD menu is split in to 10 sections
which are shown down the left hand side, with the options available in each
section then shown to the right. The LowBlue menu has a few options available
for low blue light modes, and the input selection is self-explanatory. The
'picture' menu shown above has a decent range of options including control over
the brightness, contrast,
overdrive mode (SmartResponse) and gamma modes. The
following SmartSize section has options for the aspect ratio control, and PiP
and PbP menu lets you customise the Picture in Picture and Picture by Picture
settings which might be useful for viewing multiple devices on this large
ultrawide screen.
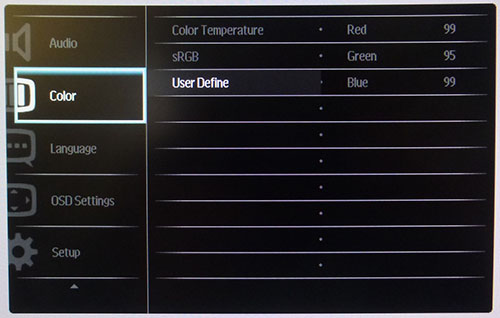
Scrolling down then in to the second page of
options most of the sections are self-explanatory. The 'color' menu allows you
to choose from the preset colour temp modes, the sRGB preset or set up your own
in the 'user define' mode. It was a little annoying to have this color section
separate from the main 'picture' menu further up, as it felt like they should
perhaps be together, or at least next to one another.
Overall the menu had a decent range of
options and settings. Navigation was quite quick although not always intuitive
as the joystick took a bit of getting used to, especially when trying to figure
out how to drill in to an option and then use it, or exit back to the rest of
the menu.
Power Consumption
In terms of power consumption the
manufacturer lists typical usage of 69.55W (a very precise number!), and 0.3W in standby. We carried out our normal tests to
establish its power consumption ourselves.
|
 |
|
State and Brightness
Setting |
Manufacturer Spec (W) |
Measured Power Usage
(W) |
|
Default (100%) |
69.55 |
60.4 |
|
Calibrated (42%) |
- |
33.0 |
|
Maximum Brightness (100%) |
- |
60.4 |
|
Minimum Brightness (0%) |
- |
23.4 |
|
Standby |
0.3 |
0.6 |
|
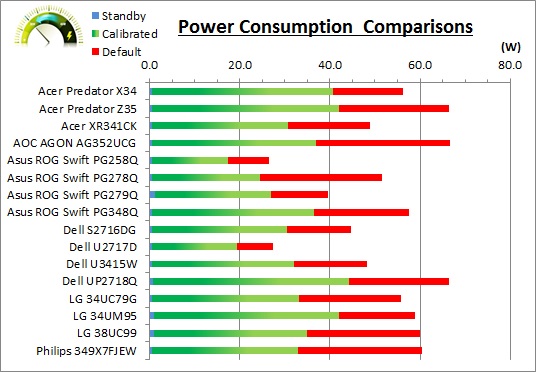
We tested this ourselves and found that out of the
box the screen used 60.4W at the default 100% brightness setting. Once calibrated the screen reached
33.0W consumption, and in standby it
used only 0.6W. We have plotted these results below compared with other screens
we have tested. The consumption is comparable to most of the other 34" sized
screens we have tested as you might expect, with some of the smaller screens
drawing slightly less power (comparing the calibrated states). Those with wide
gamut support like the Dell UP2718Q draw more power because
of their backlight units, despite being a smaller size.
Panel and Backlighting
|
Panel Manufacturer |
Samsung |
Colour Palette |
16.7 million |
|
Panel Technology |
SVA (VA-type) |
Colour Depth |
8-bit |
|
Panel Module |
LTM340YP03 |
Colour space |
Standard gamut |
|
Backlighting Type |
W-LED |
Colour space coverage (%) |
117.3% sRGB (CIE 1931)
99.8% NTSC
specified (CIE 1976) |
Panel Part and Colour Depth
The Philips 349X7FJEW features an
Samsung LTM340YP03 SVA (VA-type) technology panel which is capable of producing
16.7 million colours. This is achieved through an 8-bit colour depth.
Screen
Coating
The
screen coating is a light anti-glare (AG) like other modern VA panels we
have tested. Not semi-glossy like some older generation VA offerings, but nice
and light in line with modern IPS screens as well. It retains its anti-glare properties
to avoid too many unwanted reflections of a full glossy coating, but does not
produce an too grainy or dirty an image that some thicker AG coatings can.
There are no visible cross-hatching patterns evident.
Backlight Type and Colour Gamut
The screen uses a White-LED (W-LED) backlight unit
which is standard in today's market. This helps reduce power consumption
compared with older CCFL backlight units and brings about some environmental
benefits as well. The W-LED unit offers a standard colour gamut which is
roughly equal to the sRGB colour space although extends a little beyond it.
Philips quote a 117.3% sRGB coverage, which is measured against the normal CIE
1931 standard so gives you a good idea of coverage compared with typical 99% /
100% sRGB screens out there.
Confusingly Philips also list a 99.8% NTSC coverage
in the spec, but that is against the CIE 1976 standard so doesn't translate to a
typical spec you might normally see for NTSC which is normally against CIE 1931
standard. For clarity, this screen covers around 74% of the NTSC colour
space if you want to compare it to other screens where this spec is still used.
Their use of the 99.8% figure might be confusing as it might imply this is a
wide gamut screen, which it is not. It's slightly beyond normal standard gamut,
but not enough that you would call it wide gamut.
Anyone wanting to work with wider colour spaces would need to consider
wide gamut backlight screens or those which feature technologies such as Quantum
Dot for extending the colour space further. If you want to read more about colour spaces and gamut
then please have a read of our
detailed article.
Backlight
Dimming and Flicker
We tested the screen to establish the methods used
to control backlight dimming. Our in depth article talks in more details about a
previously very common method used for this which is called
Pulse Width Modulation (PWM). This in itself gives cause for concern to some
users who have experienced eye strain, headaches and other symptoms as a result
of the flickering backlight caused by this technology. We use a photosensor +
oscilloscope system to measure backlight dimming control
with a high level of accuracy and ease. These tests allow us to establish
1) Whether PWM is being used to control the
backlight
2) The frequency and other characteristics at which this operates, if it is used
3) Whether a flicker may be introduced or potentially noticeable at certain
settings
If PWM is used for backlight dimming, the higher
the frequency, the less likely you are to see artefacts and flicker. The duty
cycle (the time for which the backlight is on) is also important and the shorter
the duty cycle, the more potential there is that you may see flicker. The other
factor which can influence flicker is the amplitude of the PWM, measuring the
difference in brightness output between the 'on' and 'off' states. Please
remember that not every user would notice a flicker from a backlight using PWM,
but it is something to be wary of. It is also a hard thing to quantify as it is
very subjective when talking about whether a user may or may not experience the
side effects.
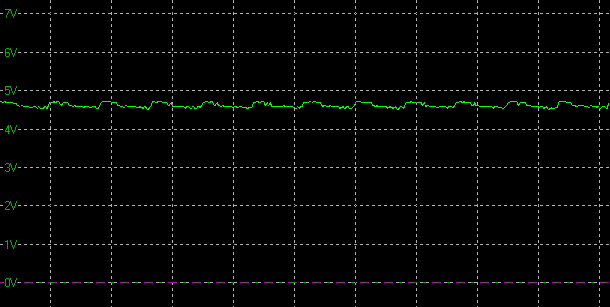
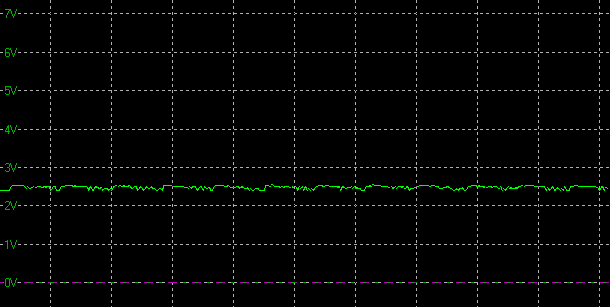
100% 50%
0%
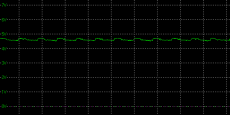
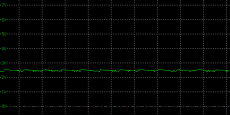
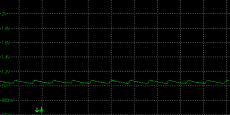
Above scale = 1
horizontal grid = 2ms
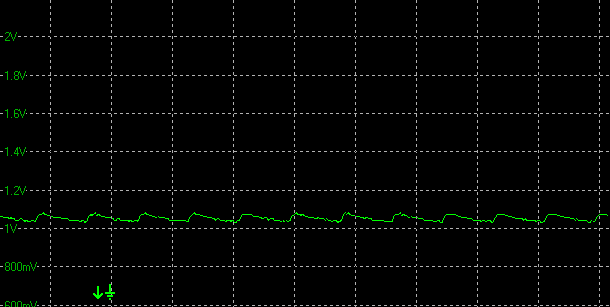
At all brightness settings a constant Direct
Current (DC) voltage seems to be applied to the backlight, and the screen is
free from the obvious off/on switching of any PWM dimming method. There is a low
amplitude oscillation present at all brightness settings which has a frequency
fixed to the active refresh rate. In the above images we were running the screen
at 60Hz and the oscillation is aligned at the same. It is very low amplitude and
should not represent any problems in practice or create any visible flicker.
|
Pulse Width
Modulation Used |
No
(but with low amplitude oscillation) |
|
Cycling
Frequency |
n/a |
|
Possible
Flicker at |
|
|
100% Brightness |
Very unlikely |
|
50% Brightness |
Very unlikely |
|
0% Brightness |
Very unlikely |
Contrast
Stability and Brightness
We wanted to see how much variance there was in
the screens contrast as we adjusted the monitor setting for brightness.
In theory, brightness and contrast are two independent parameters, and good
contrast is a requirement regardless of the brightness adjustment.
Unfortunately, such is not always the case in practice. We recorded the
screens luminance and black depth at various OSD brightness settings, and
calculated the contrast ratio from there. Graphics card settings were left at
default with no ICC profile or calibration active. Tests were made using an
X-rite i1 Display Pro colorimeter. It should be noted that we used the
BasICColor calibration software here to record these, and so luminance at
default settings may vary a little from the LaCie Blue Eye Pro report.
|
OSD
Brightness |
Luminance
(cd/m2) |
Black
Point (cd/m2) |
Contrast
Ratio
( x:1) |
|
100 |
246.42 |
0.15 |
1643 |
|
90 |
224.46 |
0.13 |
1727 |
|
80 |
202.46 |
0.12 |
1687 |
|
70 |
179.17 |
0.11 |
1629 |
|
60 |
156.32 |
0.09 |
1737 |
|
50 |
131.92 |
0.08 |
1649 |
|
40 |
116.70 |
0.07 |
1667 |
|
30 |
101.09 |
0.06 |
1685 |
|
20 |
85.23 |
0.05 |
1705 |
|
10 |
69.12 |
0.04 |
1728 |
|
0 |
52.72 |
0.03 |
1757 |
|
Total Luminance Adjustment Range
(cd/m2) |
193.70 |
Brightness OSD setting controls backlight? |
|
|
Total Black Point
Adjustment Range (cd/m2) |
0.12 |
|
Average Static Contrast Ratio |
1692:1 |
PWM Free? |
|
|
Recommended OSD setting
for 120 cd/m2 |
42 |
The brightness control gave us a good range
of adjustment. At the top end the maximum luminance reached 246
cd/m2
which was a little shy of the specified maximum brightness of 300 cd/m2
from the manufacturer. There was a very good 194 cd/m2 adjustment
range in total, and so at the minimum setting you could reach down to a low
luminance of 53 cd/m2. This should be adequate for those wanting to
work in darkened room conditions with low ambient light. A setting of 42 in the OSD menu should return you a
luminance of around 120 cd/m2 at default settings.
It should be noted that the
brightness regulation is controlled without the need for
Pulse Width Modulation, using a Direct Current (DC) method for all
brightness settings between 100 and 0% and so the screen is flicker free.
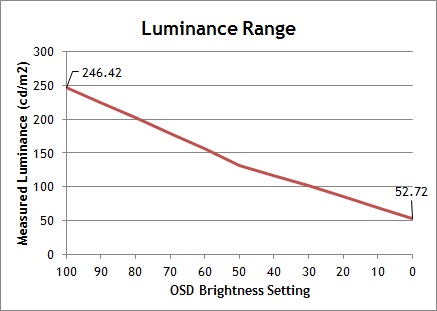
We have plotted the
luminance trend on the graph above. The screen behaves as it should in this
regard, with a reduction in the luminance output of the screen controlled by the
reduction in the OSD brightness setting. This is not a linear relationship as you
can see as there seems to be a steeper adjustment curve for settings between 100
- 50%, with a slightly more gradual adjustment then available for 50 - 0%.
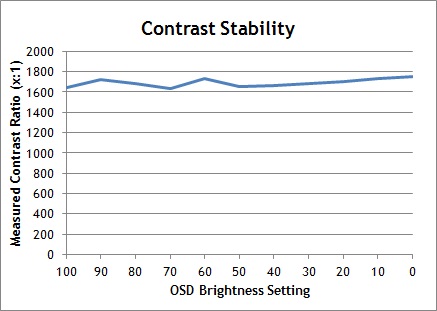
The average contrast ratio of the screen
was good at 1692:1 but it was only about half of the specified 3000:1 figure
which was disappointing. This was stable across the brightness
adjustment range as shown above.
Testing
Methodology
An
important thing to consider for most users is how a screen will perform out of
the box and with some basic manual adjustments. Since most users won't have
access to hardware colorimeter tools, it is important to understand how the
screen is going to perform in terms of colour accuracy for the average user.
We restored our graphics card to default settings
and disabled any previously active ICC profiles and gamma corrections. The
screen was tested at default factory settings using our new
X-rite i1
Pro 2 Spectrophotometer combined with
LaCie's Blue Eye Pro software suite. An X-rite i1 Display Pro colorimeter was
also used to verify the black point and contrast ratio since the i1 Pro 2
spectrophotometer is less
reliable at the darker end.
Targets for these tests are as follows:
-
CIE Diagram - validates the colour space
covered by the monitors backlighting in a 2D view, with the black triangle representing the
displays gamut, and other reference colour spaces shown for comparison
-
Gamma - we aim for 2.2 which is the default
for computer monitors
-
Colour temperature / white point - we aim
for 6500k which is the temperature of daylight
-
Luminance - we aim for 120
cd/m2, which is
the recommended luminance for LCD monitors in normal lighting conditions
-
Black depth - we aim
for as low as possible to maximise shadow detail and to offer us the best
contrast ratio
-
Contrast ratio - we aim
for as high as possible. Any dynamic contrast ratio controls are turned off here
if present
-
dE average / maximum -
as low as possible.
If DeltaE >3, the color displayed is significantly different from the
theoretical one, meaning that the difference will be perceptible to the
viewer.
If DeltaE <2, LaCie considers the calibration a success; there remains a
slight difference, but it is barely undetectable.
If DeltaE < 1, the color fidelity is excellent.
Default Performance and
Setup
Default settings of the screen were as follows:
Philips 349X7FJEW
Default Settings


|
 |
|
Monitor OSD
Default Settings |
|
|
SmartImage preset mode |
Off |
|
LowBlue mode |
Off |
|
Brightness |
100 |
|
Contrast |
50 |
|
Gamma |
2.2 |
|
Color Temperature |
6500k |
|
RGB |
n/a |
|
Luminance
Measurements |
|
|
luminance (cd/m2) |
251 |
|
Black Point (cd/m2) |
0.15 |
|
Contrast Ratio |
1690:1 |
|
Colour
Space Measurements |
|
|
sRGB coverage |
111.3% |
|
DCI-P3 coverage |
82.0% |
|
Rec.2020 coverage |
58.9% |
|
Initially out of the box the screen was set
with a high 100% brightness and so was overly bright and uncomfortable to use, so you will
definitely need to turn that down. You could tell the screen was using a
standard gamut backlight as well with the naked eye, although colours were
perhaps a little bit boosted and more vivid as the product spec page suggested they would be. The colour balance and
temperature felt pretty good and contrast was decent thanks to the VA panel
being used.
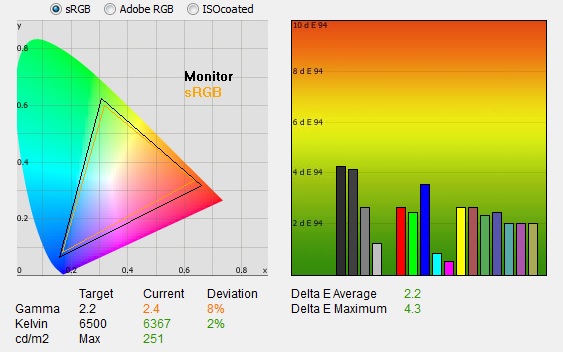
We went
ahead and measured the default state with the i1 Pro 2. The
CIE diagram on the left of the image confirms that the monitors colour gamut
(black triangle) is fairly equal to
the sRGB colour space. There is some minor over-coverage in most shades, but you
wouldn't call this a wide gamut screen. We measured using ChromaPure software a
111.3% sRGB gamut coverage so it was stretching a little beyond the typical sRGB
reference as advertised (Philips state 117.3% sRGB coverage). This panel is not using Quantum Dot technology, or a wide gamut LED
backlight or anything, it's just the W-LED backlight seems to offer a slightly
wider colour space here. Incidentally this measured colour space coverage corresponds to 82.0% of
the DCI-P3 and 58.9% of the Rec.2020 reference.
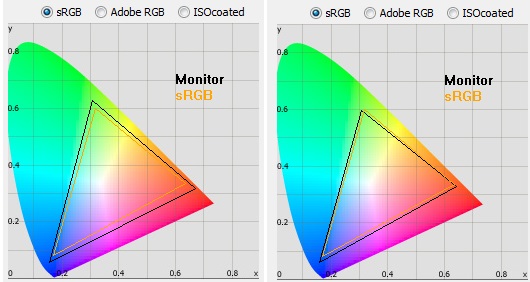
sRGB gamut
coverage in default color mode vs sRGB preset color mode
There is an sRGB mode available in the color
menu which seems to restrict the colour space and bring it closer to the sRGB
reference. In that mode we measured 100.5% sRGB coverage (74.1% of DCI-P3 and
53.2% Rec.2020). However, the sRGB mode is largely useless since it locks all
other settings, including brightness (which is far too high). Changing anything
reverts you back to the 6500k color temperature mode and therefore the slightly
wider 111.3% sRGB coverage. It might have been nice if the sRGB emulation was
more flexible when it came to other screen settings in case you wanted to more
strictly work with the sRGB space.
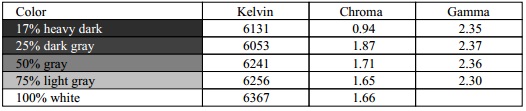
Default gamma was recorded at 2.4 average,
leaving it with a moderate 8% deviance
from the target. This was with the screen set in the
default 2.2 gamma mode in the OSD. We also tested the other gamma modes which
returned: 1.8 = 2.0 (9% out from our target), 2.0 mode = 2.2 measured (2% out
and seemingly the best OSD setting for gamma), 2.4 mode
= 2.6 measured, 2.6 mode = 2.8 measured. Probably best
to revert to the OSD 2.0 mode for a setting closer to the 2.2 target we wanted
when it comes to calibration in a moment.
White
point was measured at a slightly warm 6367k in the default setup where the
colour
temperature mode in the OSD was set to "6500k". This left the white point
only 2%
out from the 6500k we'd ideally want for desktop use. There are a range of other
colour temp presets available in the menu along with a user configurable mode
where you have access to the individual RGB channels for the
calibration
process.
Luminance was recorded at a bright 251
cd/m2
which is too high for prolonged general use. The screen was set at a default
100% brightness in the OSD menu but that is easy to change of course to reach a
more comfortable setting without impacting any other aspect of the setup. The
black depth was 0.15 cd/m2 at this default
brightness setting, giving us a good static contrast ratio of
1690:1 but actually much lower than the specified 3000:1 figure from Philips
(and Samsung, the panel manufacturer).
Colour accuracy was pretty good out of the box
with an average dE of 2.2, and a max of 4.3. Testing the screen with colour
gradients showed smooth gradients with only minor gradation evident in darker
tones. There was no sign of any colour banding which was good news.
Calibration
We used the
X-rite i1 Pro 2
Spectrophotometer combined with the LaCie Blue Eye Pro software package to
achieve these results and reports. An X-rite i1 Display Pro colorimeter was used
to validate the black depth and contrast ratios due to lower end limitations of
the i1 Pro device.
Philips 349X7FJEW
Calibrated Settings
|
 |
|
Monitor OSD
Calibrated Settings |
|
SmartImage preset mode |
Off |
|
LowBlue mode |
Off |
|
Brightness |
42 |
|
Contrast |
50 |
|
Gamma |
2.0 |
|
Color Temperature |
User Define |
|
RGB |
99, 95, 99 |
|
Luminance
Measurements |
|
|
luminance (cd/m2) |
120 |
|
Black Point (cd/m2) |
0.07 |
|
Contrast Ratio |
1783:1 |
|
Colour
Space Measurements |
|
|
sRGB coverage |
112.1% |
|
DCI-P3 coverage |
82.6% |
|
Rec.2020 coverage |
59.3% |
|
We changed the gamma mode first of all to
mode 2.0 as we know that returns a gamma closer to the 2.2 target we want to
achieve. We also changed to the 'user define' color temperature
mode which
offered us access to the RGB controls from within the menu. We adjusted the RGB
channels and brightness setting as shown in the table above as part of the
guided calibration process. These OSD
changes allowed us to obtain an optimal hardware starting point and setup before software level changes would be
made at the graphics card level. We left the LaCie software to calibrate
to "max" brightness which would just retain the luminance of whatever brightness
we'd set the screen to, and would not in any way try and alter the luminance at
the graphics card level, which can reduce contrast ratio. These adjustments
before profiling the screen would help preserve tonal values and limit
banding issues. After this we let the software carry out the LUT adjustments and create an
ICC profile.
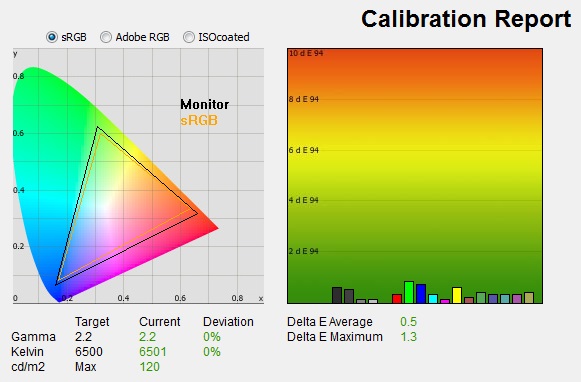
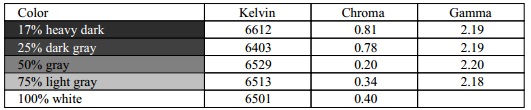
Average gamma was now corrected to 2.2
average with a 0% deviance, correcting the 8% error we'd seen out of the box. The
white point had now been corrected to 6501k, which corrected the small 2% deviance
we'd seen out of the box where the screen was a little too warm. Luminance had
been improved thanks to the adjustment to the brightness control and was now
being measured at 120
cd/m2.
This left us a black depth of 0.07 cd/m2 and maintained a strong static
contrast ratio of
1783:1, improving on the default contrast ratio slightly but still a long way
under the spec of 3000:1. Colour accuracy of the resulting
profile was excellent, with dE average of 0.5 and maximum of 1.3. LaCie would
consider colour fidelity to be very good.
Testing the screen with various colour gradients
showed mostly smooth transitions with only some very minor banding due to the adjustments to the
graphics card LUT from the profiling of the screen.
You can use our settings and
try our calibrated ICC profile if you wish, which are available in
our ICC profile database. Keep in mind that results will vary from one
screen to another and from one computer / graphics card to another.
|
Check Pricing and Buy - Direct Links
|
|
Amazon
|
|
TFTCentral is a participant
in the Amazon Services LLC Associates Programme, an affiliate
advertising programme designed to provide a means for sites to earn
advertising fees by advertising and linking to Amazon.com, Amazon.co.uk,
Amazon.de, Amazon.ca and other Amazon stores worldwide. We also
participate in a similar scheme for Overclockers.co.uk. |
Calibration Performance Comparisons
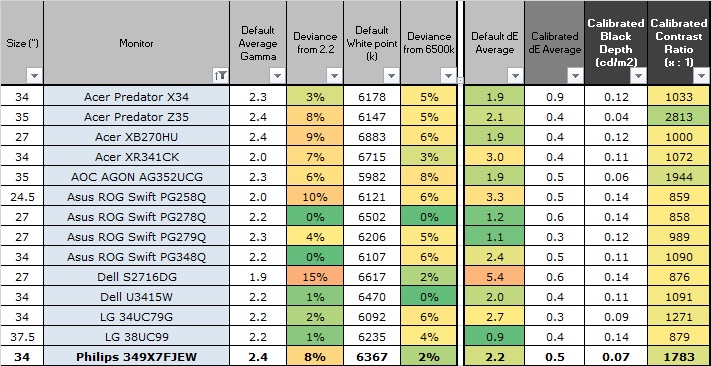
The comparisons made in this section try to give
you a better view of how each screen performs, particularly out of the box which
is what is going to matter to most consumers. When comparing the default factory
settings for each monitor it is important to take into account several
measurement areas - gamma, white point and colour accuracy. There's no point
having a low dE colour accuracy figure if the gamma curve is way off for
instance. A good factory calibration requires all 3 to be well set up. We have
deliberately not included luminance in this comparison since this is normally
far too high by default on every screen. However, that is very easily controlled
through the brightness setting (on most screens) and should not impact the other
areas being measured anyway. It is easy enough to obtain a suitable luminance
for your working conditions and individual preferences, but a reliable factory
setup in gamma, white point and colour accuracy is important and not as easy to
change accurately without a calibration tool.
From these comparisons we can also compare the
calibrated colour accuracy, black depth and contrast ratio. After a calibration
the gamma, white point and luminance should all be at their desired targets.
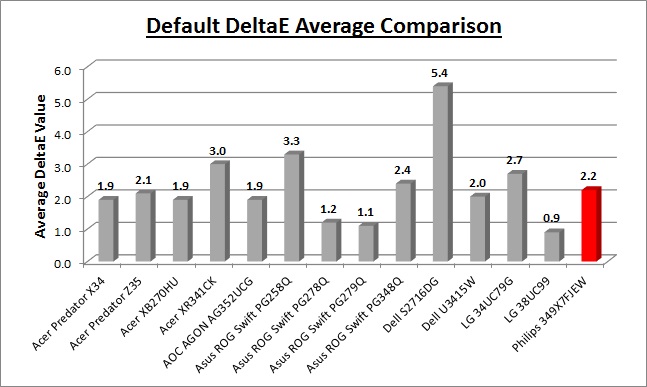
Default setup of the screen out of the box
was moderate. The gamma curve was a little off the desired 2.2, with an 8%
deviance although to be fair it was easy to correct this and bring it within
only 2% deviance by switching to the OSD menu gamma setting of 2.0. White point
was close to the target with only a small 2% deviance measured in this default
state, and we had a pretty decent dE average of 2.2. A simple change to the
gamma setting in the OSD menu will return a nice default setup and be suitable
for most people even without access to a calibration device.
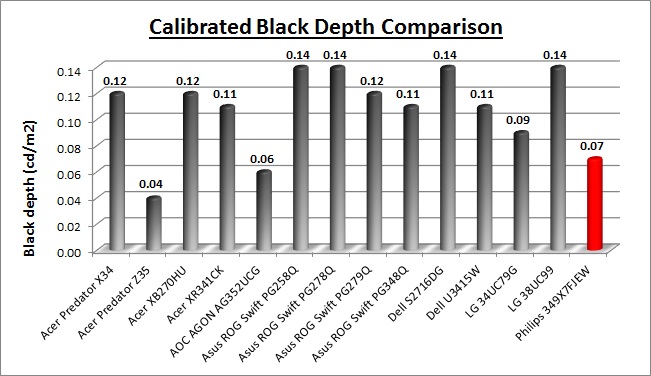
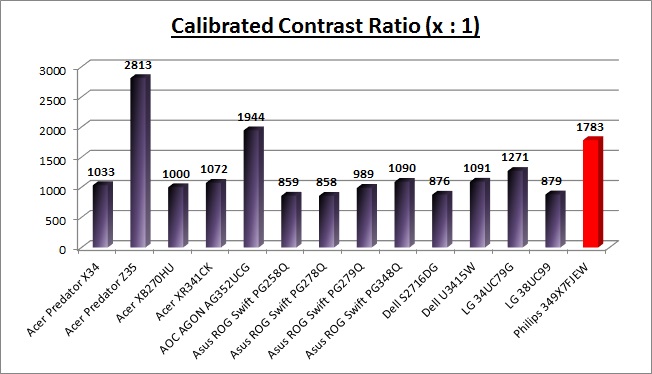
The display was good when it came to static
contrast ratio compared with most of the other models shown here. We measured a
1783:1 calibrated contrast ratio which was certainly a lot higher than you can
achieve from an IPS or TN Film panel (about 1100:1 maximum from those
technologies). However, at 1783:1 it did fall a long way short of the specified
3000:1 figure and was disappointing for a VA panel type. It left it a little
behind some other VA panels we've tested such as the Acer Predator Z35 (2813:1).
It looks like Samsung have been a bit adventurous with their contrast ratio spec
on this SVA panel. It's still very good, but we had hoped for better.

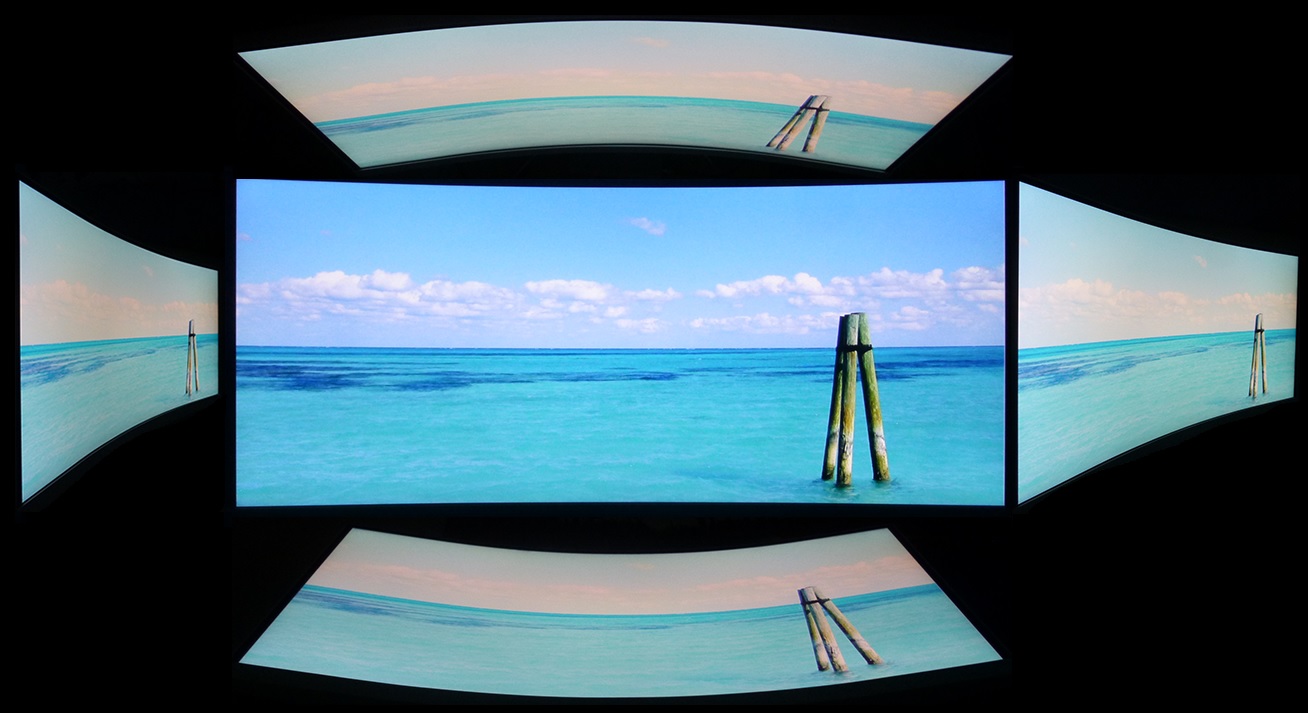
Viewing Angles
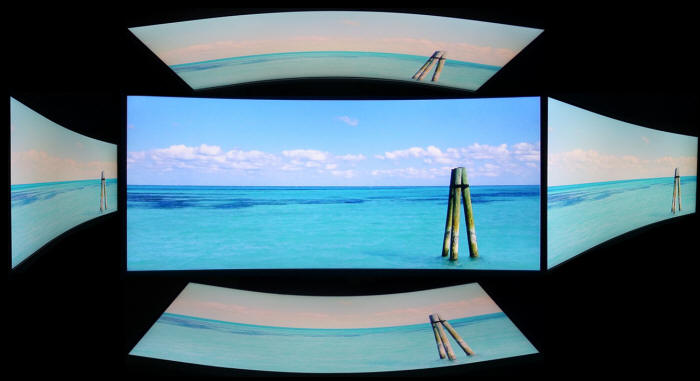
Above: Viewing
angles shown from front and side, and from above and below. Click for
larger image
Viewing angles of the screen were a little
disappointing to be honest although on par with other ultrawide VA technology
screens we've tested. From a side angle, the image became washed out and pale in
appearance as you can see. The same was visible from above and below where the
contrast shifted and it appeared more washed out, with some pink and yellow
colour introduced. It was very like some other recent ultrawide VA panels we've
tested, like those in the
AOC AGON AG352UCG reviewed in March 2017, and the
Acer Predator Z35 we tested last year in January 2016. Those two models use AU
Optronics AMVA panels, whereas this Philips screen uses a Samsung SVA. Both
seemed very comparable in terms of viewing angles though.
We had hoped for better, as we had seen
improvements in VA viewing angles with some other models a few years back like
the
BenQ GW2760HS and
BenQ BL3200PT for instance. So here, despite it being a brand new panel from
Samsung, it seems viewing angles are not as good as you can sometimes achieve
from VA technology.
The viewing angles were still a bit better
than TN Film matrices. There was a less pronounced contrast shift vertically
here. The colour tone and gamma shifts were more noticeable of course than
IPS-type panels, including the 34"
Acer Predator X34 as an example. Users should also be aware that the panel
exhibits the off-centre contrast shift which is inherent to the VA pixel
structure. When viewing a very dark grey font for example on a black background,
the font almost disappears when viewed head on, but gets lighter as you move
slightly to the side. This is an extreme case of course as this is a very dark
grey tone we are testing with. Lighter greys and other colours will appear a
little darker from head on than they will from a side angle, but you may well
find you lose some detail as a result. This can be particularly problematic in
dark images and where grey tone is important. It is this issue that has led to
many graphics professionals and colour enthusiasts choosing IPS panels instead,
and the manufacturers have been quick to incorporate this alternative panel
technology in their screens. We would like to make a point that for many people
this won't be an issue at all, and many may not even notice it. Remember, many
people are perfectly happy with their TN Film panels and other VA based screens.
Just something to be wary of if you are affected by this issue or are doing
colour critical work.
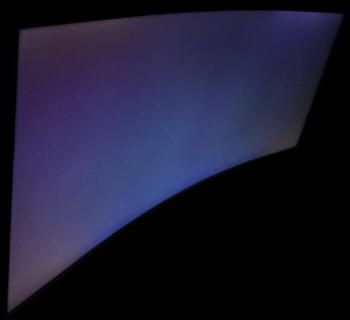
Above: View of an
all black screen from the side. Click for larger version
We captured a photo of an all-black image as
viewed from a side angle as shown above. This can help exhibit any glow you
might see on different panel technologies. Here we saw some pale purple glow
which reminded us more of the kind of glow you get from some ultrawide IPS panels.
Not quite as noticeable perhaps, but fairly similar. For instance, it looks quite like the
Asus ROG Swift PG348Q which has a 34" IPS panel and showed a similar pale
and purple glow. Some other IPS models show a more noticeable pale white glow,
so it was not as obvious as that here with the 349X7FJEW.
The glow was, perhaps unsurprisingly, fairly similar to that
which we'd seen from the
Acer Predator Z271 which uses a smaller 27" curved Samsung SVA panel of
recent production. The
ultrawide AU Optronics AMVA panels like those in the
AOC AGON AG352UCG and
Acer Predator Z35 showed less of a glow, although uniformity issues were
easier to spot as a result on those models.
Panel Uniformity
We wanted to test
here how uniform the brightness was across the screen, as well as identify any
leakage from the backlight in dark lighting conditions. Measurements of the
luminance were taken at 36 points across the panel on a pure white background.
The measurements for luminance were taken using BasICColor's calibration
software package, combined with an X-rite i1 Display Pro colorimeter with a
central point on the screen calibrated to 120 cd/m2. The below
uniformity diagram shows the difference, as a percentage, between the
measurement recorded at each point on the screen, as compared with the central
reference point.
It is worth
noting that panel uniformity can vary from one screen to another, and can depend
on manufacturing lines, screen transport and other local factors. This is only a
guide of the uniformity of the sample screen we have for review.
Uniformity of Luminance
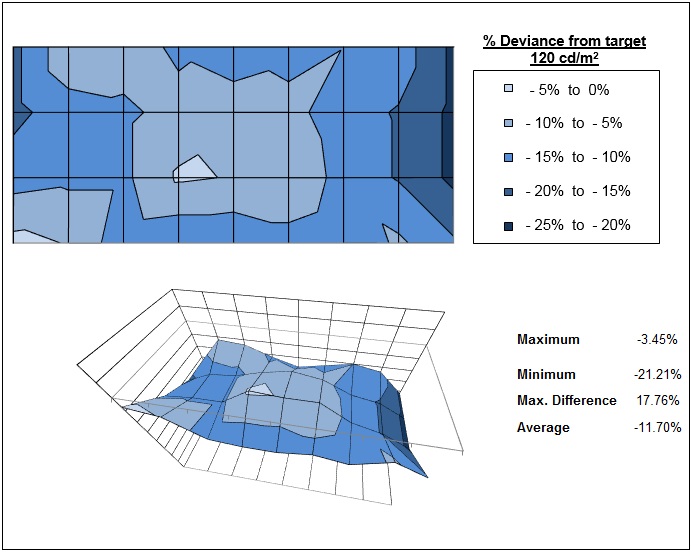
Uniformity of the screen was moderate although most of the screen was 5 -
15% darker than the centrally calibrated point of 120 cd/m2. The
right and left hand sides dropped down a little lower by a maximum of 21%
with luminance reaching down to 99 cd/m2 on the right hand edge.
Only 30% of the screen was within a 10% deviance of the centrally calibrated
point which was not great.
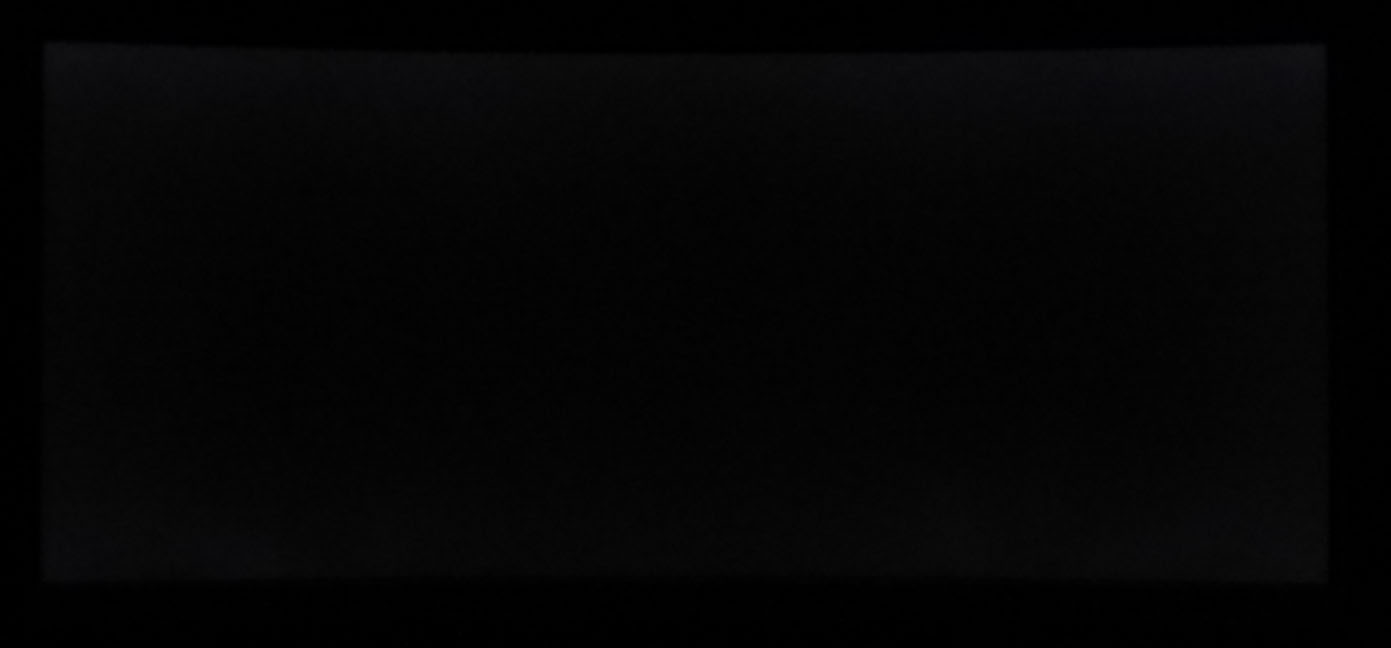
Backlight Leakage
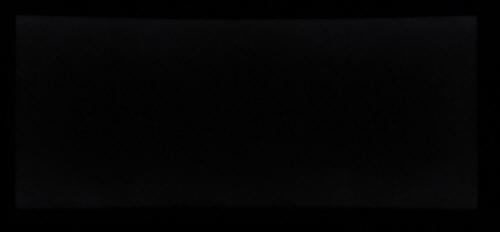
Above: All black screen in a darkened room. Click for larger version
We also tested the screen with an all black image
and in a darkened room. A camera was used to capture the result. The camera
showed there was some clouding evident in the four corners, but it was hard to
spot and not something that should be apparent during normal uses. If you are in a very dark room working with dark content you
may notice this a little, although in day to day use you would be hard pressed
to see any issue. The relatively high statis contrast ratio helped make sure
blacks were nice and deep.
Note: if you want to test your own screen for
backlight bleed and uniformity problems at any point you need to ensure you have
suitable testing conditions. Set the monitor to a sensible day to day brightness
level, preferably as close to 120
cd/m2 as you can get it (our tests are
once the screen is calibrated to this luminance). Don't just take a photo at the
default brightness which is almost always far too high and not a realistic usage
condition. You need to take the photo from about 1.5 - 2m back to avoid
capturing viewing angle characteristics, especially on IPS-type panels where
off-angle glow can come in to play easily. Photos should be taken in a darkened
room at a shutter speed which captures what you see reliably and doesn't
over-expose the image. A shutter speed of 1/8 second will probably be suitable
for this.
General and Office Applications
One of the key selling points of ultra-wide
screens like the this is it's high resolution and large screen size. This is one
of the ultrawide models that offers the higher 3440 x 1440 resolution, with some
displays instead going for a lower 2560 x 1080 resolution in order to squeeze a
higher refresh rate out of the panel. This Philips display offers the high
resolution and a refresh rate maximum of 100Hz, so it's still offering a high
refresh rate (just not as high as 144Hz) without having to sacrifice the picture
quality, sharpness and screen real-estate. A nice balance we feel for now, until
DisplayPort 1.4 and
more modern panels allow manufacturers to push refresh rate of these 3440 x
1440 panels even higher.
The 3440 x 1440 display offers a sharp but
comfortable picture. Its pixel area is about 1.8 times larger than an Ultra-Wide
Full HD 21:9 monitor, and about 2.4 times larger than a Full HD 16:9 monitor. It
provides an efficient environment in using Microsoft Office programs showing 47
columns and 63 rows in excel. Thankfully the high resolution is of a very
comfortable size on the 34" panel, with a 0.2325mm pixel pitch is is very
comparable to a 27" 2560 x 1440 monitor (0.2331mm). This means you are basically
getting a wider desktop to work with, with a similar font size to a 27" model,
and maintaining the same vertical resolution as well. If you're coming from a
lower resolution / larger pixel pitch you may still find the fonts look quite
small to start with, but like the 27" 1440p models out there you soon get used
to it. Side by side multi-tasking on this screen is excellent and you really do
have a nice wide area to work with. We liked the curved format of the display
actually for day to day office work. It just felt a bit more comfortable than a
flat screen on a model as wide as this, bringing the corners a bit nearer to
you. You didn't really notice the curve in normal use but we liked the feel.
Probably down to user taste, so if in doubt try and see one in person.
The light AG coating of the VA panel doesn't
produce any graininess to the image like some aggressive AG solutions can and so
white office backgrounds look clean and clear. The viewing angles of the VA
panel technology were moderate, providing a fairly stable images from different
angles, although not as good as you can get from competing IPS based displays.
There is some contrast and colour tone shift from wider angles and the image
starts to become washed out. The off-centre VA contrast shift may also be a
problem for colour critical work and photo editing and you may want to consider
an IPS equivalent instead if that is your primary usage. The viewing angles are
fine though here for general day to day and office work.
The default
setup of the screen was good once you'd switched to the 2.0 gamma mode in the
OSD, and represented a decent setup for most users. The 1783:1 calibrated
contrast ratio was strong and certainly a strength of the VA panel technology,
although somewhat disappointing given the expectations of the 3000:1
specification listed. Nevertheless it certainly exceeded anything possible from
competing IPS displays in this size.
The
brightness range of the screen was also very good, with the ability to offer a
luminance between 246 and 53 cd/m2. This should mean the screen is
perfectly useable in a wide variety of ambient light conditions, including
darkened rooms. A setting of ~42 in the OSD brightness control should return you
a luminance close to 120 cd/m2 out of the box. On another positive
note, the brightness regulation is controlled without the need for the use of
the now infamous
Pulse-Width Modulation (PWM), and so those who suffer from eye fatigue or
headaches associated with flickering backlights need not worry.
There was no
audible noise from the screen, even if you listened very closely and when testing patterns which sometimes cause these issues to become noticeable.
The screen also remains cool even during prolonged use. There is no specific
preset mode for office work or reading although there is a LowBlue mode with 3
levels to
provide a blue light filter, making the image appear more yellowy.
The screen offers 4x USB 3.0 ports which can
be useful, including one with fast charging support. They are all located on the
back of the display so are not easy-access really. Integrated 2x 5W speakers can
provide sound for the odd YouTube clip or mp3 if you want, and there is an audio
input and headphone output connection provided as well if you need them. There
are no further extras like ambient light sensors or card readers which can be
useful in office environments. There was a moderate range of ergonomic
adjustments available from the stand with the important tilt and height
adjustments available. Sadly the stand was missing side to side swivel which
would have been useful as well. Still, you can quite easily obtain a comfortable
position for a wide variety of angles. They were mostly stiff though so you
might not want to move it around too often. The VESA mounting support may also
be useful to some people as well for more flexibility.
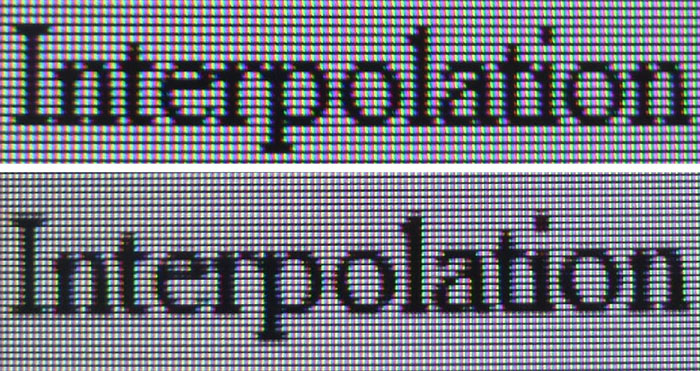
Above: photo of text at 3440 x 1440 (top) and 2560 x 1080 (bottom)
The screen is designed to run at its native
resolution of 3440 x 1440 and at a 60Hz recommended refresh rate (100Hz max). However, if
you want you are able to run the screen outside of this resolution. We tested
the screen at a lower 2560 x 1080 resolution to see how the screen handles the
interpolation of the resolution, while maintaining the same aspect ratio of
21:9. At native resolution the text was sharp and clear. When running at a the
lower resolution the text is still reasonably clear, with low levels of
blurring. You do lose a lot of screen real-estate as well of course but it might
be a more manageable resolution for some gaming if you want to push frame rates
up to the upper end of the 100Hz support.
Responsiveness and Gaming
|
Quoted G2G Response Time |
4ms G2G |
|
Quoted ISO Response Time |
n/a |
|
Panel Manufacturer and
Technology |
Samsung SVA (VA-type) |
|
Panel Part |
LTM340YP03 |
|
Overdrive Use |
Yes |
|
Overdrive Control
Available Via Setting |
SmartResponse |
|
Overdrive Settings |
Off, Fast, Faster,
Fastest |
|
Refresh Rate Range |
40 - 100Hz |
|
Variable Refresh Rate
technology |
FreeSync |
The 349X7FJEW is rated by Philips as having a
4ms G2G response time. This implies the screen uses
overdrive / response time compensation (RTC) technology to boost pixel
transitions across grey to grey changes. There is a user control in the OSD menu
for the overdrive under the 'SmartResponse' setting with 4 options available.
The part being used is the
Samsung LTM340YP03 SVA (VA-type) technology panel. Have a read about
response time in our
specs section if you need additional information about this measurement.
We will first test the screen using our
thorough
response time testing method. This uses an oscilloscope and photosensor to
measure the pixel response times across a series of different transitions, in
the full range from 0 (black) to 255 (white). This will give us a realistic view
of how the monitor performs in real life, as opposed to being reliant only on a
manufacturers spec. We can work out the response times for changing between many
different shades, calculate the maximum, minimum and average grey to grey (G2G)
response times, and provide an evaluation of any overshoot present on the
monitor.
We use an
ETC M526
oscilloscope for these measurements along with a custom photosensor device.
Have a read of
our response time measurement article for a full explanation of the testing
methodology and reported data.
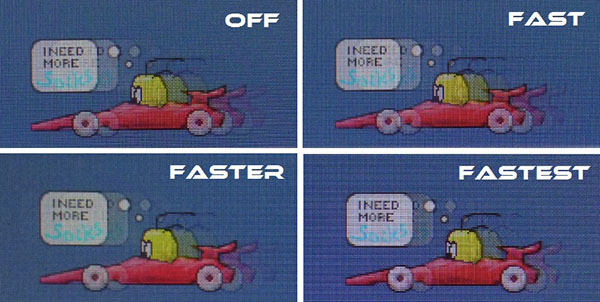
Response Time Setting
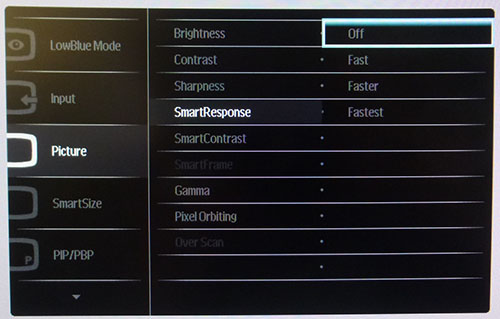
The 'SmartResponse' overdrive setting is available via the
'picture' section of the OSD menu as shown above. We will test the modes to see which is optimal
first of all and then also conduct some tests at different refresh rates to
check if that has any impact. That can sometimes lead to variable control of the
overdrive impulse so is important to check.
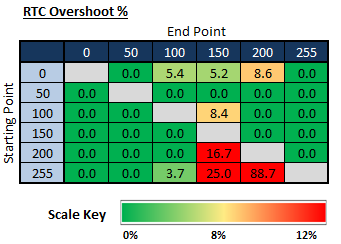
Response Time Measurements at Maximum
100Hz Refresh Rate
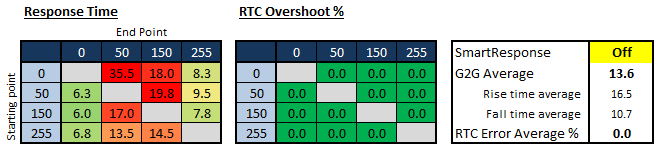
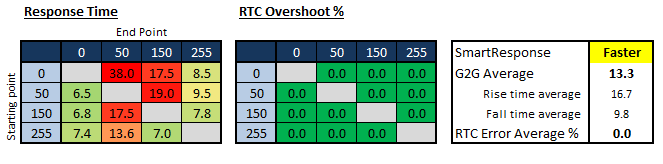
At the maximum 100Hz refresh rate we were
able to test the difference (or lack therefore) that each of the SmartResponse
settings makes to the performance of the screen. You can see that the off, fast
and faster modes deliver pretty much the exact same result with an average G2G
response time around the 13ms mark. There was no overshoot detected in any of
these modes, but the response times changing from black to darker grey shades
were particularly slow. This is a fairly common pattern from VA matrices, which
seem to often struggle with these dark transitions. In practice that can often
lead to black trailing and smearing on fast moving content, as these few slow
transitions hold the panel back overall. Because the refresh rate is 100Hz here,
a new frame is being sent to the screen every 10ms (1000ms / 100fps = 10). With many transitions being
slower than this, you do get some additional smearing and blurring introduced
because the pixel response times can't keep up with the frame rate properly. It
looks like at 100Hz the overdrive impulse is basically turned off in all three
of those settings.
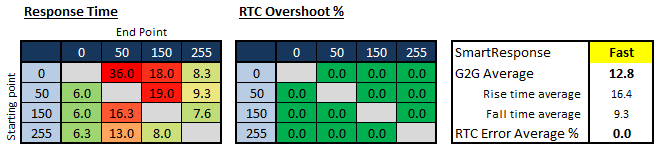
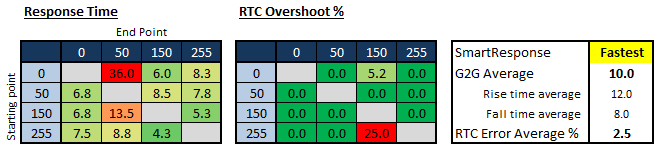
If you increase the SmartReponse to the maximum
'fastest' mode you get a decent improvement in response times, down now to
10.0ms average in this small sample set. Most are well under this and so this mode better supports the frame rate
requirements at 100Hz. In fact if you ignore the particularly slow 0 > 50
transition (black > dark grey) the response times would be 7.6ms G2G average. We
will do some more complete measurements in a moment which will give a more
accurate average, less skewed by oddly high measurements. There is a little overshoot introduced on certain
transitions in this setting, and you can pick out a little bit of a dark and pale halo on moving
content in motion tests like PixPerAn. There is a noticeable improvement in
motion clarity and a reduction in blurring in this mode compared with the other
three though, thanks to the improved response times and the now-fast-enough support
for the high 100fps frame rate. The black > dark grey (0 > 50) transition is
still a problem though and could lead to some dark smearing on moving content.
Response Time Measurements at 60Hz
Refresh Rate
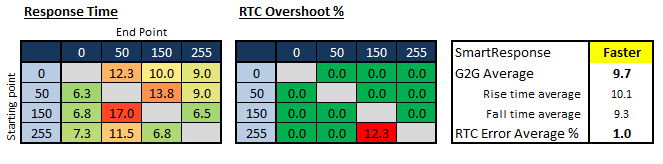
We also measured the screen in the
faster and fastest settings but this time at a normal 60Hz refresh rate. This
told a different story and makes things a little complicated. In the 'faster'
mode we saw better response times at 60Hz than at 100Hz, now with an average of
9.7ms G2G measured (compared with 13.3ms at 100Hz). The troublesome black > dark grey transitions were also
better here for some reason. A bit of overshoot was creeping in though which we
hadn't seen at all at 100Hz in this mode. It looks like the overdrive impulse is
turned up here compared with running at 100Hz in the 'faster' mode.
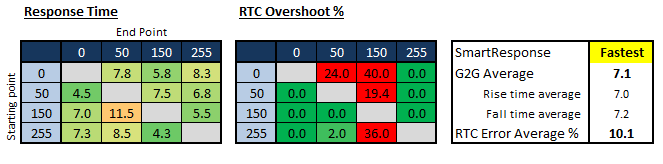
In the 'fastest' setting at 60Hz, the
overdrive was also obviously more aggressive than at 100Hz refresh rate. The response
times were reduced down to 7.1ms G2G and the slow black > dark grey
transitions were now pretty fast and not an issue (7.8ms), but there were much higher
levels of overshoot now introduced as a result. Too high and obvious in
practice.
PixPerAn Comparisons
100Hz Comparison
The above images give you an indication of
the blurring and overshoot levels in each of the SmartResponse overdrive modes, using the PixPerAn test
tool and with the screen set at the maximum 100Hz. There was no real change in
responsiveness or motion clarity as you switch between off > fast > faster, and
there were pretty high levels of blurring in these modes. As we've said above,
the pixel response times weren't fast enough to keep up with the 100fps frame
rate demands, introducing some additional smearing. There was a noticeable
improvement when you changed to the 'fastest' mode. It was a little hard to pick
out with the camera in these tests, but easier to spot with the naked eye as the moving image
was sharper and clearer. A little bit of dark overshoot crept in but there was
less blurring. Motion clarity was much better in the 'fastest' mode than the
others at 100Hz.
60Hz Comparison

At 60Hz you can see that the 'faster' mode
delivered better response times than it had at 100Hz refresh rate, reducing the
blurring very nicely. The troublesome black > dark grey transitions were sped up
nicely, and with the overall response times being fast enough for the 60fps
frame rate now, there was no additional smearing introduced. If you move up to
the 'fastest' mode, there is a large degree of noticeable overshoot introduced
in the form of dark and pale trails behind the moving object.
At 100Hz you benefited from an increased
frame rate compared with 60Hz, giving you a better motion clarity in
practice. It isn't easy to pick out from these static PixPerAn photos, so you
will have to also compare the response time measurements and rely on our written
commentary. This is down to the way the human eye tracks motion on a sample-and-hold
type display like an LCD, with refresh rate having a direct relation to
perceived motion clarity.
Summary and Recommend Overdrive Settings
It looks like for some reason the overdrive
impulse is being turned down as you increase the refresh rate, which is
contrary to what you might expect, but something we have seen on other FreeSync
screens in the past as well, such as the
AOC AGON AG251FZ. So at 60Hz the overdrive impulse is optimal in the
'faster' mode, delivering 9.7ms G2G average and only low levels of overshoot. If
you push the overdrive setting up to fastest, the overdrive impulse is just too
aggressive and while response times are improved to 7.1ms G2G, there is just too
much obvious overshoot.
As you increase the refresh rate up to 100Hz,
the overdrive impulse is turned down in both settings. The 'faster' mode
becomes a too slow with 13.3ms G2G, despite now being free of overshoot and it
looks like the overdrive is basically turned down to be off.
Some transitions become particularly slow and problematic and it's not fast
enough to keep up with the 100fps demands of 100Hz. The 'fastest' mode is now
more manageable than it was at 60Hz, removing most of the overshoot you see at
60Hz refresh rate but slowing down response times to 10.0ms in this small sample
measurement set. Some dark
transitions are not fast enough now as well but overall it's not a major issue
in practice. This variable overdrive control seems to be a common pattern for
FreeSync screens and often seems to create problems from what we've seen. It's
far simpler on G-sync screens and tends to be better controlled, with the
overdrive just turned up sensibly as you increase refresh rate.
So to summarise if you are running the screen
at 60Hz for general uses, movies or external games consoles the 'FASTER' mode is
optimal. If you are running the screen at 100Hz for gaming from a PC, the
'FASTEST' mode is better and what you want to use. It's a little complicated if
you're using FreeSync, where the refresh range may fluctuate between 40 and
100Hz. We would recommend identifying your typical frame rates and setting the
overdrive control accordingly. If they are typically in the range from 40 - 80Hz
you are probably best off with the 'FASTER' mode to avoid lots of unnecessary
and unwanted overshoot, but if they are regularly higher at 80 - 100Hz, go for
the 'FASTEST' mode where motion clarity is better and overshoot is reduced. You
may want to consider turning down your resolution as well to help maintain the
higher end of the refresh rate range.
Detailed Response Time Measurements
SmartResponse Fastest, 100Hz Refresh Rate
Having established that the SmartResponse
'fastest' setting
offered the best response/overshoot balance at 100Hz refresh rate, we carried out our normal wider
range of measurements as shown below.
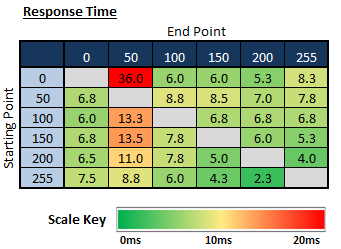
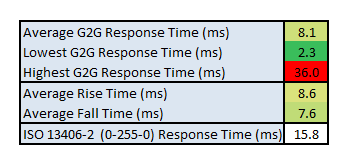
The average G2G response time was more accurately
measured at 8.1ms which was good overall for a VA panel. Most measurements were
under the 10ms threshold for 100Hz support, so there was minimal additional
smearing introduced in this mode because of the high frame rate demands. There
was only one measured transition which was particularly problematic, a change
from black > dark shades (0 > 50) which could produce a little black smearing in
some content. On many VA panels the transitions from black to any shade can be a
challenge (e.g. the
Acer Predator Z35), but thankfully they were good here at 5 - 6ms range.
Where all the transitions from black are slow on VA panels, it can lead to very
noticeable dark smearing on moving content, but that was mostly eliminated here
thankfully. Samsung seem to have a better handle on this VA response time
difficulty on their modern SVA panels compared with AU Optronics' equivalent
AMVA panels.
At 100Hz there was mostly very low levels of
overshoot, although a few transitions from white to light shades introduced some
high overshoot. The change from white to light grey (255 > 200) for instance
produced some very high overshoot, and this could lead to some dark overshoot in
certain circumstances. Keep in mind the overdrive impulse is turned UP as you
decrease the refresh rate, so you may start to see this a little more as refresh
rate drops when using FreeSync, or if you were to decide to use 60Hz or a lower
than maximum setting.
FreeSync and Refresh Rate
The screen features support for FreeSync from
compatible AMD graphics cards, offering a range between 40 and 100Hz. This will
offer you a dynamically controlled refresh rate to help avoid tearing and
stuttering in games, without adding the lag that traditional Vsync features
result in. You don't need to enable anything from within the OSD menu, just your
graphics card settings to get FreeSync to work. This is useful on a screen like
this as the 3440 x 1440 high resolution might be a big strain on some graphics
cards if you're trying to push games up to near the upper end of the 100Hz range
(100fps). You will want to consider your graphics card power, the type of games
you are playing and the settings you want to use as 3440 x 1440 @ 100Hz is a
high demand. You can drop the resolution down to 2560 x 1080 and we have already
seen earlier in the review that the image is interpolated quite well.
Display Comparisons
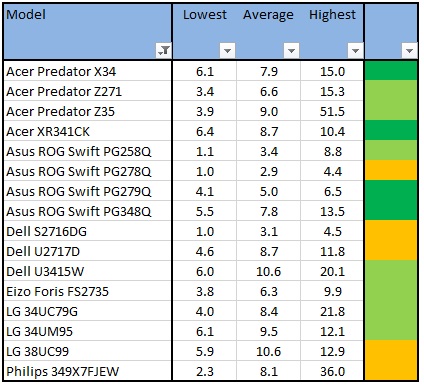
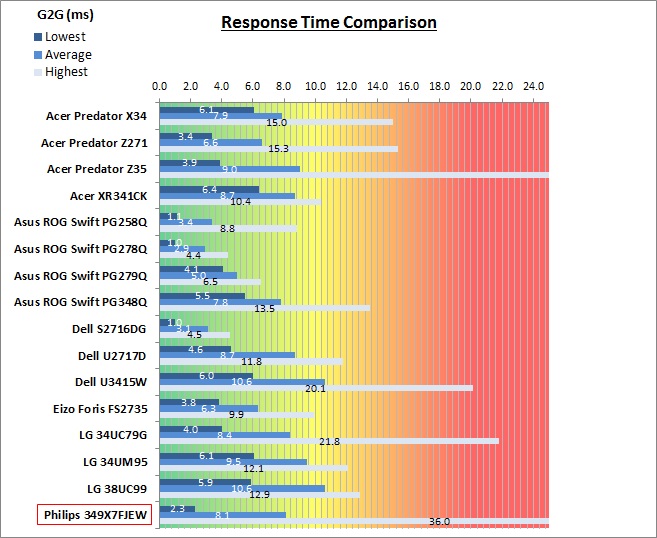
The above comparison table and graph shows you the
lowest, average and highest G2G response time measurement for each screen we
have tested with our oscilloscope system. There is also a colour coded mark next
to each screen in the table to indicate the RTC overshoot error, as the response
time figure alone doesn't tell the whole story.
As a reminder, these measurements were in the
optimal 'Fastest' SmartResponse overdrive mode and at 100Hz refresh rate for
maximum frame rate and improved motion clarity. With an average of 8.1ms G2G
the screen was quite similar overall to competing models like the Acer Predator
X34 (7.9ms) and Asus ROG Swift PG348Q (7.8ms). Although those IPS models were a
little faster and provided a slightly better motion clarity in practice. They
were also free from the problematic slow black > dark grey transition which may
lead to a little dark smearing on the Philips screen here. They were also free
from any overshoot, whereas the Philips shows some on certain transitions, and
at a high level.
The native higher refresh rate IPS
models like the
Asus ROG Swift PG279Q (5.0ms G2G) and
MG279Q (6.5ms G2G) for
instance had performed better, and TN Film models like the
Asus ROG Swift PG278Q
(2.9ms G2G) could of course reach faster speeds and are specifically designed
for gaming audiences.
Additional Gaming Features
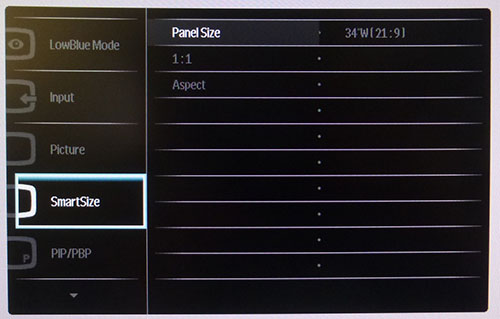
Aspect Ratio Control -
the screen offers 4 options for
aspect ratio control,
available through the OSD menu in the 'SmartSize' section as shown. There
are options for specific panel sizes (34" ultrawide and 27" 16:9), 1:1 pixel mapping, and
a useful 'aspect' mode. This should suit
most people's needs and handle external devices easily enough.
Preset Modes -
There are 5 gaming preset modes available in
the menu. There are options for FPS, Racing, RTS and two user configurable
GAMER1 and GAMER2 modes. This should give you the ability to set up a mode
specific for your gaming needs easily.
Lag
We have written an in depth article about
input lag and the various measurement techniques which are used to evaluate
this aspect of a display. It's important to first of all understand the
different methods available and also what this lag means to you as an end-user.
Input Lag vs. Display Lag vs. Signal
Processing
To avoid confusion with different terminology we
will refer to this section of our reviews as just "lag" from now on, as there
are a few different aspects to consider, and different interpretations of the
term "input lag". We will consider the following points here as much as
possible. The overall "display lag" is the first, that being the delay between
the image being shown on the TFT display and that being shown on a CRT. This is
what many people will know as input lag and originally was the measure made to
explain why the image is a little behind when using a CRT. The older stopwatch
based methods were the common way to measure this in the past, but through
advanced studies have been shown to be quite inaccurate. As a result, more
advanced tools like SMTT provide a method to measure that delay between a TFT
and CRT while removing the inaccuracies of older stopwatch methods.
In reality that lag / delay is caused by a
combination of two things - the signal processing delay caused by the TFT
electronics / scaler, and the response time of the pixels themselves. Most
"input lag" measurements over the years have always been based on the overall
display lag (signal processing + response time) and indeed the SMTT tool is
based on this visual difference between a CRT and TFT and so measures the
overall display lag. In practice the signal processing is the element which
gives the feel of lag to the user, and the response time of course can
impact blurring, and overall image quality in moving scenes. As people become
more aware of lag as a possible issue, we are of course keen to try and
understand the split between the two as much as possible to give a complete
picture.
The signal processing element within that is quite
hard to identify without extremely high end equipment and very complicated
methods. In fact the studies by Thomas Thiemann which really kicked this whole
thing off were based on equipment worth >100,1000 Euro, requiring extremely high
bandwidths and very complicated methods to trigger the correct behaviour and
accurately measure the signal processing on its own. Other techniques which are
being used since are not conducted by Thomas (he is a freelance writer) or based
on this equipment or technique, and may also be subject to other errors or
inaccuracies based on our conversations with him since. It's very hard as a
result to produce a technique which will measure just the signal processing on
its own unfortunately. Many measurement techniques are also not explained and so
it is important to try and get a picture from various sources if possible to
make an informed judgement about a display overall.
For our tests we will continue to use the SMTT
tool to measure the overall "display lag". From there we can use our
oscilloscope system to measure the response time across a wide range of grey to
grey (G2G) transitions as recorded in our
response time
tests. Since SMTT will not include the full response time within its
measurements, after speaking with Thomas further about the situation we will
subtract half of the average G2G response time from the total display lag. This should allow us to give a good estimation of
how much of the overall lag is attributable to the signal processing element on
its own.
Lag Classification
To help in this section we will also introduce a broader classification system
for these results to help categorise each screen as one of the following levels:
-
Class 1)
Less than 10ms / 1 frame lag at 100Hz - should be fine for gamers, even at high levels
-
Class
2)
A lag of 10 -
20ms / One to two frames at 100Hz - moderate lag but should be fine for many gamers.
Caution advised for serious gaming
-
Class
3)
A lag of more
than 20ms / more than 2 frames at 100Hz - Some noticeable lag in daily usage, not
suitable for high end gaming
For the full reviews of the models compared here and the dates they were written
(and when screens were approximately released to the market), please see our
full
reviews index.
|
(Measurements in ms) |
|
|
Total Display Lag (SMTT
2) |
21.30 |
|
Pixel Response Time
Element |
4.05 |
|
Estimated Signal
Processing Lag |
17.25 |
|
Lag Classification |
2 |
|

Class
2 |
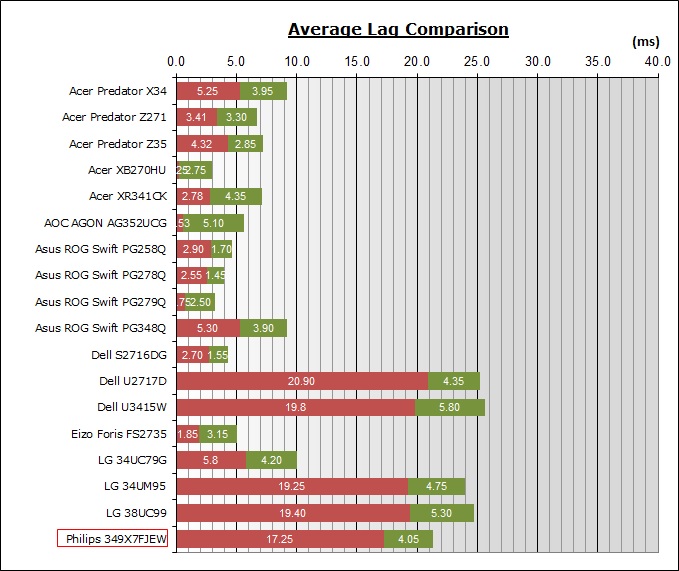
We have provided a comparison above against other
models we have tested to give an indication between screens. The screens
tested are split into two measurements which are
based on our overall display lag tests (using SMTT) and half the average G2G
response time, as measured by the oscilloscope. The response time is split from
the overall display lag and shown on the graph as the green bar. From there, the
signal processing (red bar) can be provided as a good estimation.
The screen showed a total lag of 21.30ms as
measured by SMTT. If we take out an element related to pixel response times
(4.05ms) then we are left with an estimated signal processing lag of 17.25ms.
This is just over 1.5 frames at 100Hz and represents a moderate level of lag.
Perhaps a little too high for very fast FPS and competitive gaming, but it
should still be fine for most casual gamers. The signal processing lag of G-sync
screens tends to be lower, and is normally next to nothing thanks to the user of
a G-sync chip and the absence of an additional scaler. On FreeSync screens it is
possible to drive it nice and low (see the Acer Predator XR341CK for instance),
but on many screens where a scaler is still used to provide all kinds of aspect
ratio options and PiP/PbP, this kind of lag is quite typical.
Movies and Video
The following summarises the screens performance
in video applications:
-
34"
screen size makes it a good option for an all-in-one multimedia screen, but
being quite a bit smaller than most modern LCD TV's of course even at this
massive size.
-
21:9 aspect ratio is more well suited to videos, more so than the wide range
of 16:9 format screens around, leaving smaller borders on DVD's and wide
screen content at the top and bottom.
-
3440 x 1440 resolution can support full 1080 HD resolution content
-
Digital interfaces support HDCP for any encrypted and protected content
-
Good range of connectivity options
provided with 1x DisplayPort, 1x HDMI 1.4 and 1x HDMI 2.0 offered.
-
Cables provided in
the box for DisplayPort and HDMI
-
Light AG coating providing clean and clear images, without the unwanted
reflections of a glossy solution.
-
Wide brightness range adjustment possible from the display, including a
maximum luminance of ~246
cd/m2 and a fairly decent
minimum luminance of 53 cd/m2. This should afford you good control
for different lighting conditions. Brightness regulation is controlled without
the need for PWM and so is flicker free for all brightness settings.
-
Black depth and contrast ratio are very good thanks to the VA panel at 1783:1
after calibration. Detail in darker scenes should not be lost as a result and
blacks look deep. It was not as strong as some other VA panels though (nearer
3000:1 being fairly common), and not in line with the 3000:1 spec from Philips
which was a shame.
-
Slightly extended colour space of around 111% sRGB can give a little bit of a
boost to colours making the screen appear a little more vivid. Not
oversaturated like using a wide gamut screen would be but it helped make the
image a little more colourful we felt.
-
There are no specific preset modes for movies or cinema on this model.
-
Good pixel responsiveness which should be able to handle fast moving scenes in
movies without issue. You are probably best sticking with 60Hz for movies and
certainly that will be the active refresh rate for external Blu-ray players
etc. At that refresh rate the 'Faster' SmartResponse setting is optimal,
delivering good enough pixel response times and very little overshoot.
-
Viewing angles are a little behind IPS
screens and there is noticeable gamma and colour tone shift as you change your
viewing position. The image becomes quite washed out so we wouldn't advise
using this screen for viewing from anything other than head on really. Some
pale purple glow on dark content from an angle, but not as obvious as on most
alternative IPS-type panels.
-
No real backlight bleeding or leakage which
is good, as this can be particularly problematic for movies where black
borders are present.
-
Good tilt and height adjustment range
available from the stand making it pretty easy to re-position the screen for
movie viewing from a distance, or with other people. They are a little stiff
so you won't want to move it around too much, and the lack of side to side
swivel is a bit of a pain when it comes to positioning the screen for movie
viewing from a distance.
-
2x 5W integrated stereo speakers on this model but probably not suitable for
much more than the odd YouTube clip. There is a headphone output connection if
needed.
-
Good range of hardware aspect ratio control options available which is
particularly handy when connecting external devices which often operate in
16:9 aspect ratio, and could have presented a problem otherwise on this 21:9
format screen.
-
Picture in picture (PiP) and Picture By Picture (PbP) are available on this
model if you want to use them.
Conclusion
The 349X7FJEW with its VA technology panel is
an interesting alternative to the wide range of IPS-based screens in this size
and format. It was pleasing to see the full 3440 x 1440 resolution offered here
which is great on a screen this size, offering comfortable font sizes and a
massive area in which to work and play. The refresh rate was pushed up to 100Hz
which at this resolution is about your limit for existing panels of this size,
not to mention the common DisplayPort 1.2 graphics card connections. The
addition of AMD FreeSync is welcome, providing reliable variable refresh rate
for improved gaming experience and freedom from tearing. This kind of technology
is particularly useful when you consider the demands on a system of running this
resolution and the higher refresh rate.
The pixel response times were decent enough
although getting the right setting in the menu is a little fiddly, especially if
you are going to use variable refresh rates in your gaming. They were better
than most other VA panels we have tested though and Samsung do seem to have
nailed the problematic slow black > grey transitions better than AUO have with
their competing VA technology. This means there is minimal black smearing on
this screen, which often plagues other VA panels like the 35" models which are
more widespread. The lag was moderate and so it's more suitable as a screen for
casual and general gaming. Competitive gamers will probably be better sticking
with a different, gamer specific display of some sort.
The default setup of the screen was moderate,
but better if you make a simple change to the OSD gamma control, producing a
performance which should be fine for most users. The contrast ratio was high
compared with TN Film and IPS screens, but actually quite disappointing at
1783:1 when you consider the spec is 3000:1 and other similar VA panels can get
much nearer to that. This did seem a bit of a let down on this display. You have
to put up with some of the viewing angle limitations of VA technology here, as
they are not as wide as IPS and on this model we also saw some pale purple glow
on dark content which isn't normally as noticeable on this technology. There was
at least a good range of connections, extras and features on this model so it
provides a nice all-round performance for a wide range of uses. It's not
specifically geared at any one market and does a pretty decent job at tackling
most areas.
|
Pros |
Cons |
|
High resolution and large
screen size make it a good option for a wide range of uses |
Contrast ratio not as
high as spec and a little low for a VA panel |
|
100Hz refresh rate,
FreeSync and decent enough response times |
Some typical limitations
of VA technology when it comes to viewing angles |
|
Good range of
connections, features and extras |
Missing side to side
swivel from the stand |
|
Check Pricing and Buy - Direct Links
|
|
Amazon
|
|
TFTCentral is a participant
in the Amazon Services LLC Associates Programme, an affiliate
advertising programme designed to provide a means for sites to earn
advertising fees by advertising and linking to Amazon.com, Amazon.co.uk,
Amazon.de, Amazon.ca and other Amazon stores worldwide. We also
participate in a similar scheme for Overclockers.co.uk. |