|
|
|
|||
|
||||

|
|
Notes
|
||||||||||||||||||||||||||||||||||||||||||||||||||||||||||||||||||||||||||||||||||||||||||||||||||||||||||||||||||||||||||||||||||||||||||||||||||||||||||||||||||||||||||||||||||||||||||||||||||||||||||||||||||||||||||||||||||||||||||||||||||||||||||||||||||||||||||||||||||||||||||||||||||||||||||||||||||||||||||||||||||||||||||||||||||||||||||||||||||||||||||||||||||||||||||||||||||||||||||||||||||||||||||||||||||||||||||||||||||||||||||||||||||||||||||||||||||||||||||||||||||||||||||||||||||||||||||||||||||||||||||||||||||||||||||||||||||||||||||||||||||||||||||||||||||||||||||||||||||||||||||||||||||||||||||||||||||||||||||||||||||||||||||||||||||||||||||||||||||||||||||||||||||||||||||||||||||||||||||||||||||||||||||||||||||||||||||||||||||||||||||||||||||||||||||||||||||||||||||||||||||||||||||||||||||||||||||||||||||||||||||||||||||||||||||||||||||||||||||||||||||||||||||||||||||||||||||||||||||||||||||||||||||||||||||||||||||||||||||||||||||||||||||||||||||||||||||||||||||||||
|
Brand + (series) + model |
UK price (average of lowest 10 on pricespy.co.uk on July 16th 2014) |
|
AOC q2770Pqu |
£355.50 |
|
|
|
|
Acer B276HUL |
£397.52 |
|
£433.01 |
|
|
£374.36 |
|
|
£400.91 |
|
|
Iiyama ProLite XB2776QS |
£388.78 |
|
Iiyama ProLite XB2779QS |
£400.02 |
|
Philips Brilliance 272C4QPJKAB |
£383.91 |
|
Philips Brilliance 272P4QPJKEB |
£441.40 |
Acer B276HUL
The B276HUL is built around some version of the LG Display LM270WQ1 IPS panel.
Pros
· Higher contrast ratio
· 2x HDMI
· DisplayPort-out for daisy chaining
Cons
· Higher energy consumption
· Very high display lag
· No VGA connection
· HDMI cable not supplied with display
ASUS PB278Q
The ASUS PB278Q is a display that is very similar to the q2770Pqu. It’s build around the Samsung LTM270DL02 PLS panel, which was also used in early production of the q2770Pqu and which is very similar to the LTM270DL06 panel. It features the same Mstar MST9687D controller. They also feature the same Factory OSD and use exactly the same method to get into it. The PB278Q has the same display- and audio connections as the q2770Pqu and they are placed in the same order. Furthermore, the PB278Q also has 2x 3W stereo speakers that can playback input signals from DP, HDMI and a 3.5 mm stereo input. It is very likely that the PB278Q is also produced by TPV Tech.
Most notable differences are the lack of a USB-hub on the PB278Q, the difference in OSD and OSD-controls and the use of PWM controlled backlight dimming (at 240 Hz) on the PB278Q. Like the specifications, the performance is very similar. Both have a fairly mediocre performance out of the box, but perform much better when calibrated. Because of the similarities in parts and performance, the most significant differences are the lower price tag and better warranty policy on the q2770Pqu.
BenQ
BL2710PT
The BL2710PT is built around the AU Optronics M270DAN01.0 AHVA panel. The AHVA technology is basically to AU Optronics what PLS is to Samsung; it’s their take on “IPS”. Like the q2770Pqu and the ASUS PB278Q the BL2710PT also uses the Mstar MST9687D controller. According to BenQ the BL2710PT is the first monitor specifically tailored for CAD/CAM design, with specific CAD/CAM and Animation modes.
Pros
· Scaler has 1:1 pixel mapping mode and simple aspect mode that maintains aspect ratio of source
· 5 gamma presets
· BenQ Display Pilot allows you to predefine the Display Mode per program and partition desktop
· Ambient Light sensor
· Motion sensor for automatically turning off display when not in use
· 8-bit + FRC colour depth to simulate 10-bit colour depth per channel
· On-screen labelling of OSD-controls
Cons
· Higher power consumption
· Low contrast ratio (especially in our review of the BL2710PT)
· User mode for white balance (individual RGB-controls) not working properly
Dell
UltraSharp U2713HM
Probably the biggest competitor of the q2770Pqu is the Dell UltraSharp U2713HM. It is build around the LG Display LM270WQ1-SLB2/-SLC1 AH-IPS panel. The AH-IPS panel technology performs very similar to Samsung’s PLS technology. A remarkable similarity between the LTM270DL06 panel in the q2770Pqu and the LM270WQ1-SLB2 panel in the U2713HM is that 5 out of the 6 CIE 1931 xy chromaticity coordinates of the primaries are identical, with only the Gy-coordinate spotting a difference. This is very uncommon, especially since these panels are from different manufacturers. It may very well be that Samsung and LG Display used the same LED’s and colour filters for these panels.
Pros
· Factory calibrated sRGB mode with a colour deviation of ∆E94 < 5
· Separate Hue and Saturation adjustments in Movie and Game modes
· On-screen labelling of OSD-controls
· Display 5:4 resolutions in native aspect ratio
· Slightly better panel uniformity
· All four USB-ports are USB 3.0
Cons
· No DisplayPort and HDMI-cables supplied with the screen
· Slightly higher power consumption
· Slightly higher price
· No integrated speakers
Iiyama
ProLite XB2776QS
The XB2776QS uses an LG Display AH-IPS panel.
Pros
· Higher contrast ratio
· Scaler has 1:1 pixel mapping mode and simple aspect mode that maintains aspect ratio of source
Cons
· Mediocre performance after calibration
· High minimum brightness of 126 cd/m²
· Vertical viewing angles rather disappointing for AH-IPS panel
· Brightness fixed at a very high 322 cd/m² in sRGB mode
· PWM controlled backlight dimming at 240 Hz
· No DisplayPort and HDMI-cables supplied with the screen
Iiyama
ProLite XB2779QS
The XB2779QS uses a version of the LG Display LM270WQ1 AH-IPS panel. What makes this display unique in the list of alternatives is that it is the only display with a glare coating. All the other displays have an anti-glare coating. For some people this is a deal breaker, while others might see it as a clear advantage.
Pros
· Higher contrast ratio
· Much better uniformity
· Apart from brightness excellent out of the box performance
· Negligible display lag
· Scaler has 1:1 pixel mapping mode and simple aspect mode that maintains aspect ratio of source
· YCBCR support
Cons
· Very high minimum brightness of 159 cd/m²
· High power consumption (partially due to high minimum brightness)
· Reflections with dark screen content
· HDMI and VGA cables not included
· PWM controlled backlight dimming, but at a very high frequency of 11.2 kHz (no visible flickering)
Philips
Brilliance 272C4QPJKAB
The 272C4QPJKAB uses a Samsung PLS panel.
Pros
· 2x HDMI
· Scaler has 1:1 pixel mapping mode
Cons
· Stand only provides tilt adjustment, the other three (height, swivel and pivot) are not available
· Very poor out of the box performance
· PWM controlled backlight dimming at 200 Hz
· High power consumption
· No VGA connection
· Very high over-scan with video signal
Philips
Brilliance 272P4QPJKEB
The 272P4QPJKEB uses a Samsung PLS panel.
Pros
· 2x HDMI
· Scaler has 1:1 pixel mapping mode
· Motion sensor for automatically dimming of the display when not in use
· Built-in webcam with microphone
· DisplayPort-out for daisy chaining
Cons
· Low contrast ratio
· Mediocre calibrated performance
· Very poor out of the box performance
· PWM controlled backlight dimming at 200 Hz
· High power consumption
· No VGA connection
· Very high over-scan with video signal
The following table gives detailed information about the specs of the screen:
|
Monitor Specifications |
|||
|
Size |
27"WS (68 cm) |
Panel Coating |
Semi-glossy AG coating |
|
Aspect Ratio |
16:9 |
Interfaces |
DL-DVI, DisplayPort 1.2, HDMI, D-sub (VGA) |
|
Resolution |
2560x 1440 |
||
|
Pixel Pitch |
0.2331 mm |
Design colour |
Black bezel and base |
|
Response Time |
5ms G2G (12ms ISO) |
Ergonomics |
Tilt, 130mm height, pivot and swivel |
|
Static Contrast Ratio |
1000:1 (typical) |
||
|
Dynamic Contrast Ratio |
80 million:1 |
VESA Compatible |
Yes, 100mm |
|
Brightness |
300 (typical) |
Accessories |
Power, DVI, DisplayPort, HDMI, VGA, audio and USB cables |
|
Viewing Angles |
178 / 178 |
||
|
Panel Technology |
Samsung PLS |
Weight |
Net weight with stand: 7.76Kg |
|
Backlight Technology |
W-LED |
Physical Dimensions |
(WxHxD) with stand max height |
|
Colour Depth |
16.77m (8-bit) |
||
|
Refresh Rate |
60Hz |
Special Features |
2x USB 3.0, 2x USB 2.0 ports, audio input and headphone socket, 2x 3W stereo speakers |
|
Colour Gamut |
Standard gamut |
||
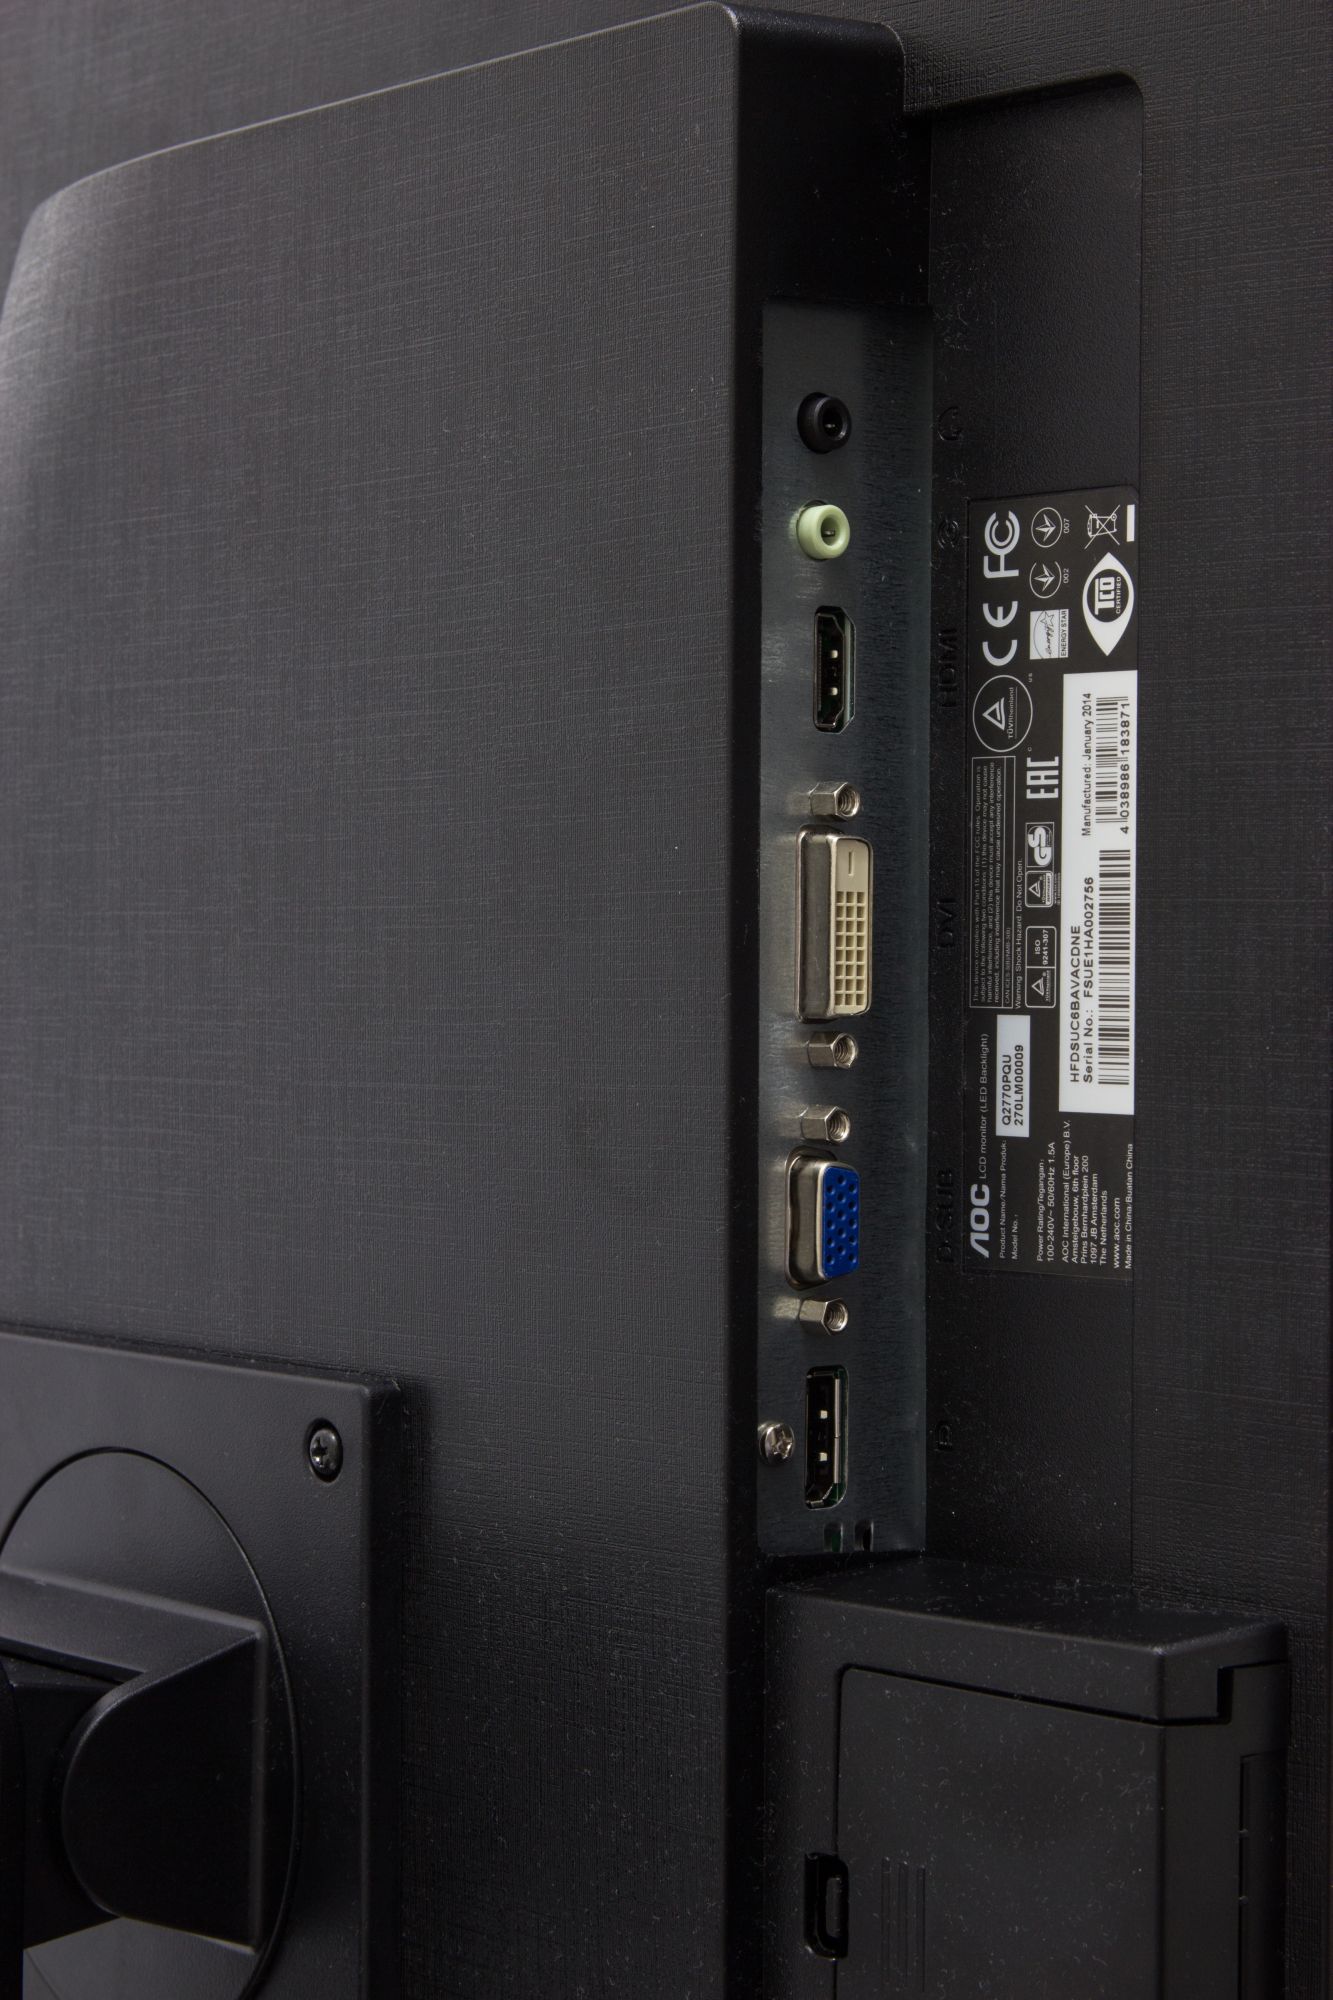
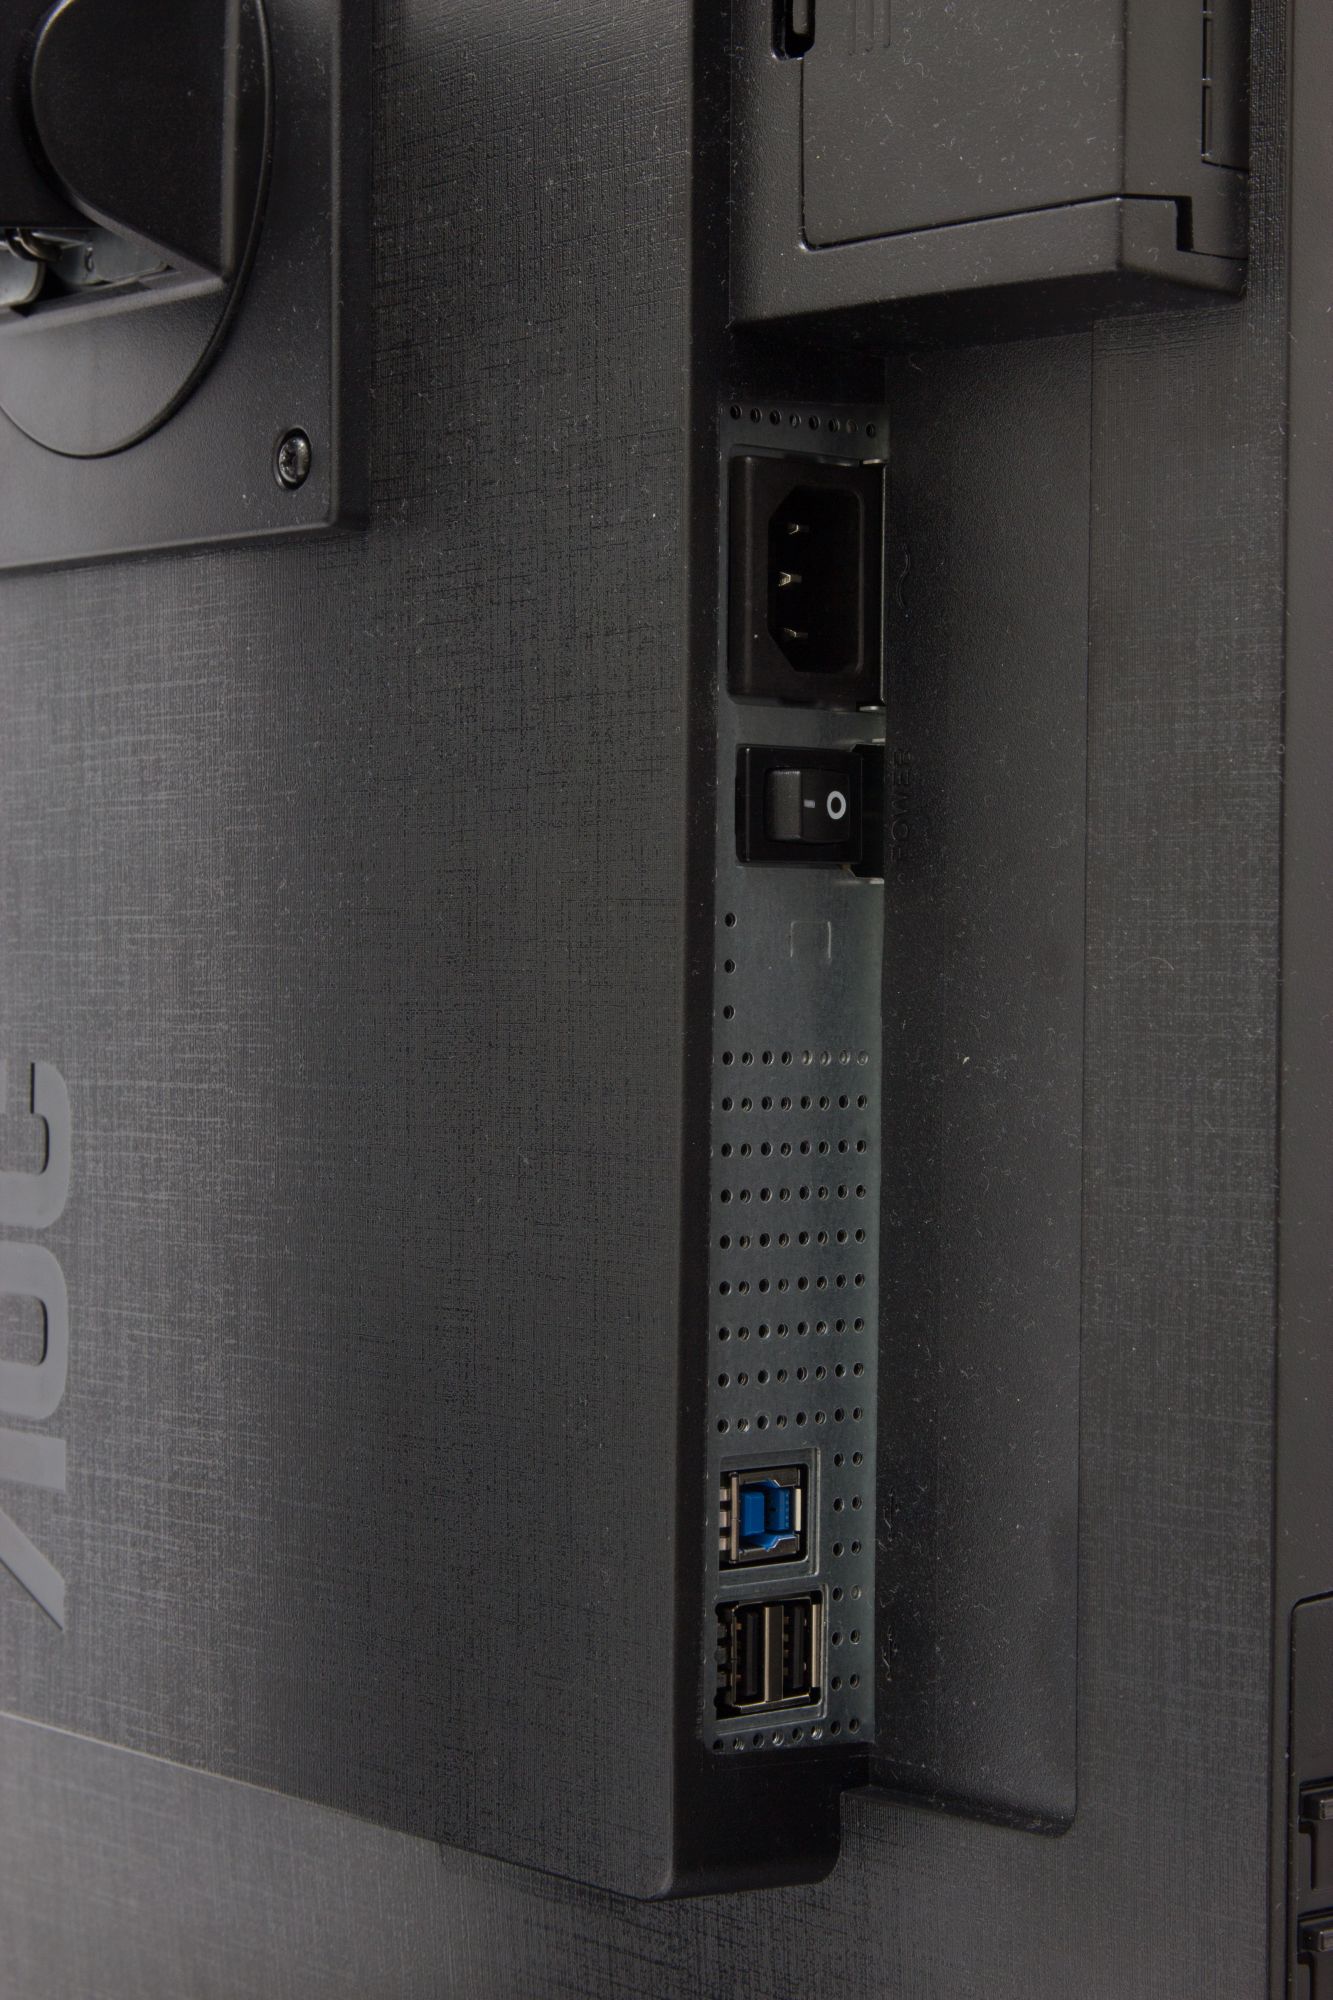
The feature set of the q2770Pqu is nothing too spectacular, but it does cover the basics very well. More exclusive features like ambient light sensor, motion sensor, hardware calibration and uniformity correction are not featured on this display. It does however have all the common display inputs: DisplayPort, DVI, HDMI and VGA. The first three of those support the native resolution of 2560x1440 pixels and the HDMI connection also supports MHL 2.0 (1920x1080). The VGA connection supports a maximum resolution of 1920x1080 by default, but you can get it to work at the native resolution as well. It’s also nice to see that the cables for all four display connections are provided in the box, as well the USB 3.0 cable for the built-in hub and a 3.5 mm mini-jack male-male audio cable.
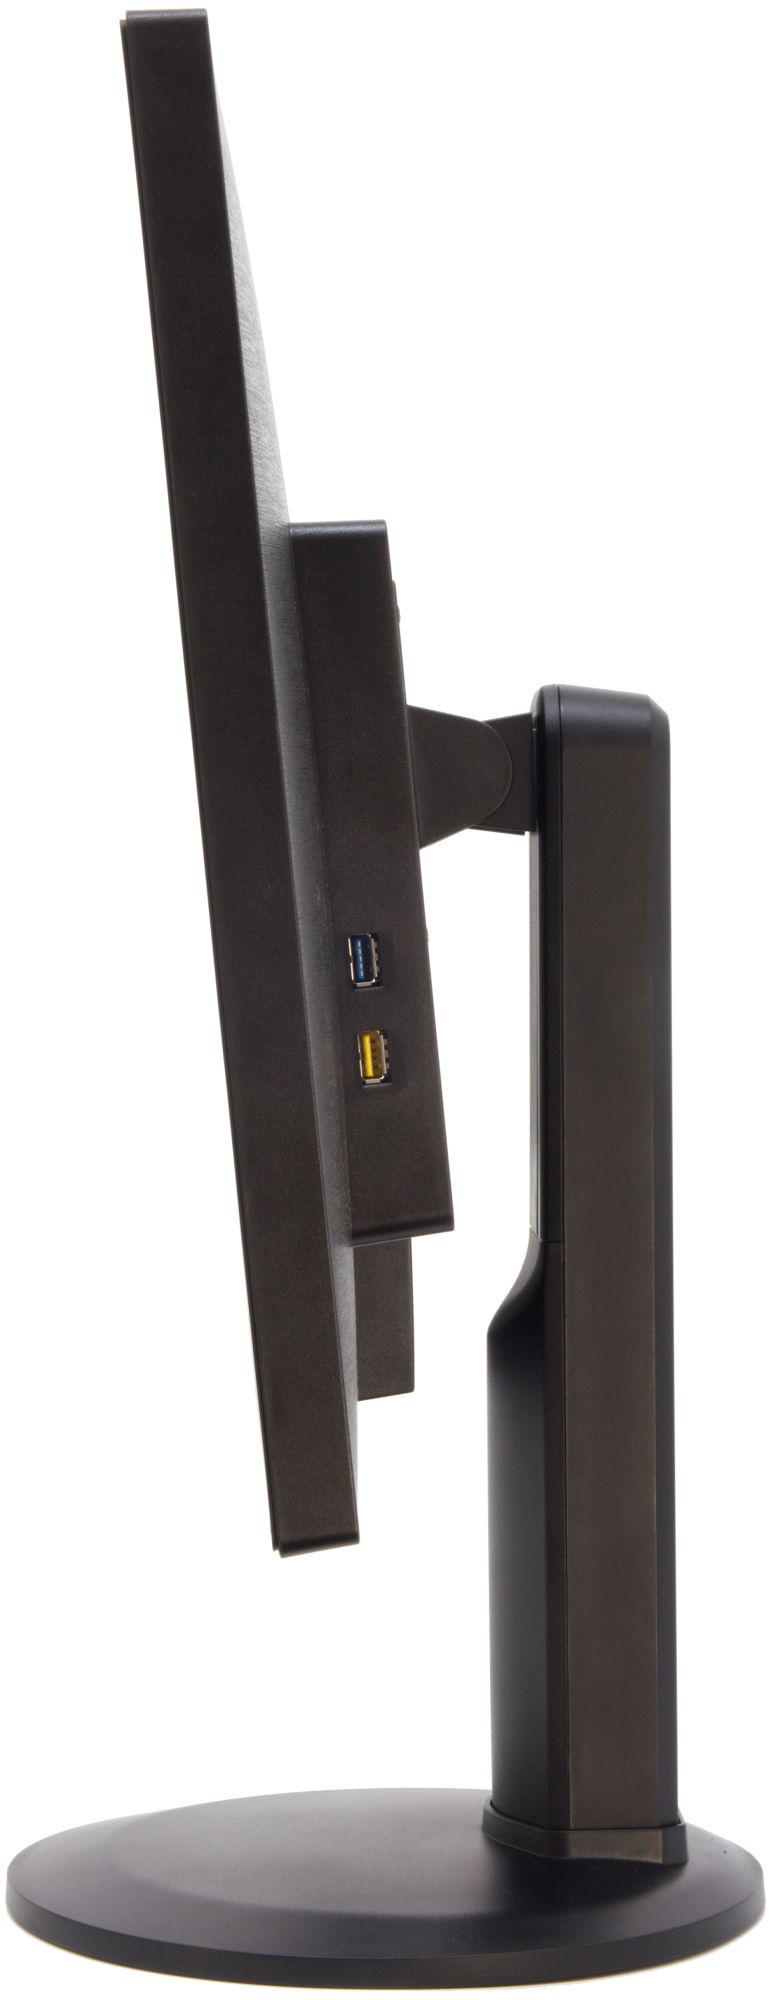
The USB hub has four ports: 2x USB 3.0 and 2x USB 2.0. One of the USB 3.0 ports is a fast charge port. The USB 3.0 ports are located at the right hand side of the back section and relatively easily accessible. The USB 2.0 ports are located at the bottom of the back section and are somewhat hard to access. The q2770Pqu also has built-in stereo speakers of 2x 3W and a 3.5 mm stereo output. Audio input can be supplied by DisplayPort, HDMI or a 3.5 mm stereo input. The stand of the display features all the common ergonomic adjustments: swivel, tilt, pivot and height adjustment. The OSD can be set to 16 different languages and offers various white balance -, gamma - and overdrive settings.
There are two scaling modes available in the OSD: wide (16:9) and 4:3. For the majority of resolutions the (most) appropriate mode is selected by default. There are no settings available for resolutions with a 16:10 or a 5:4 aspect ratio, nor is there support for 1:1 pixel mapping. The actual behaviour of the scaler is slightly more complex though, as can be seen in the Display Modes section. Not really a feature of the display itself, but more of the product as a whole is the 3 year warranty with on-site exchange. It is also certified as an ISO9241-307 pixel fault class I display, which is the second best rating and the same as for instance the Eizo ColorEdge CG models have.
Below is a summary of the features and connections of the screen:
|
Feature |
Yes / No |
Feature |
Yes / No |
|
Tilt adjust |
|
DVI |
|
|
Height adjust |
|
HDMI |
|
|
Swivel adjust |
|
D-sub |
|
|
Rotate adjust |
|
DisplayPort |
|
|
VESA compliant |
|
Component |
|
|
USB Ports |
|
Composite |
|
|
Card Reader |
|
Audio connection |
|
|
Ambient Light Sensor |
|
HDCP Support |
|
|
Touch Screen |
|
MHL Support |
|
|
Hardware calibration |
|
Integrated Speakers |
|
|
Uniformity correction |
|
PiP / PbP |
|
|
|
|
|
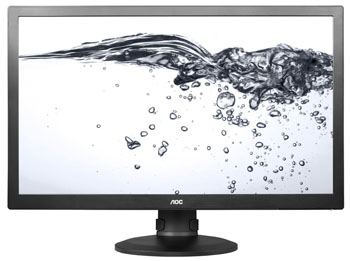
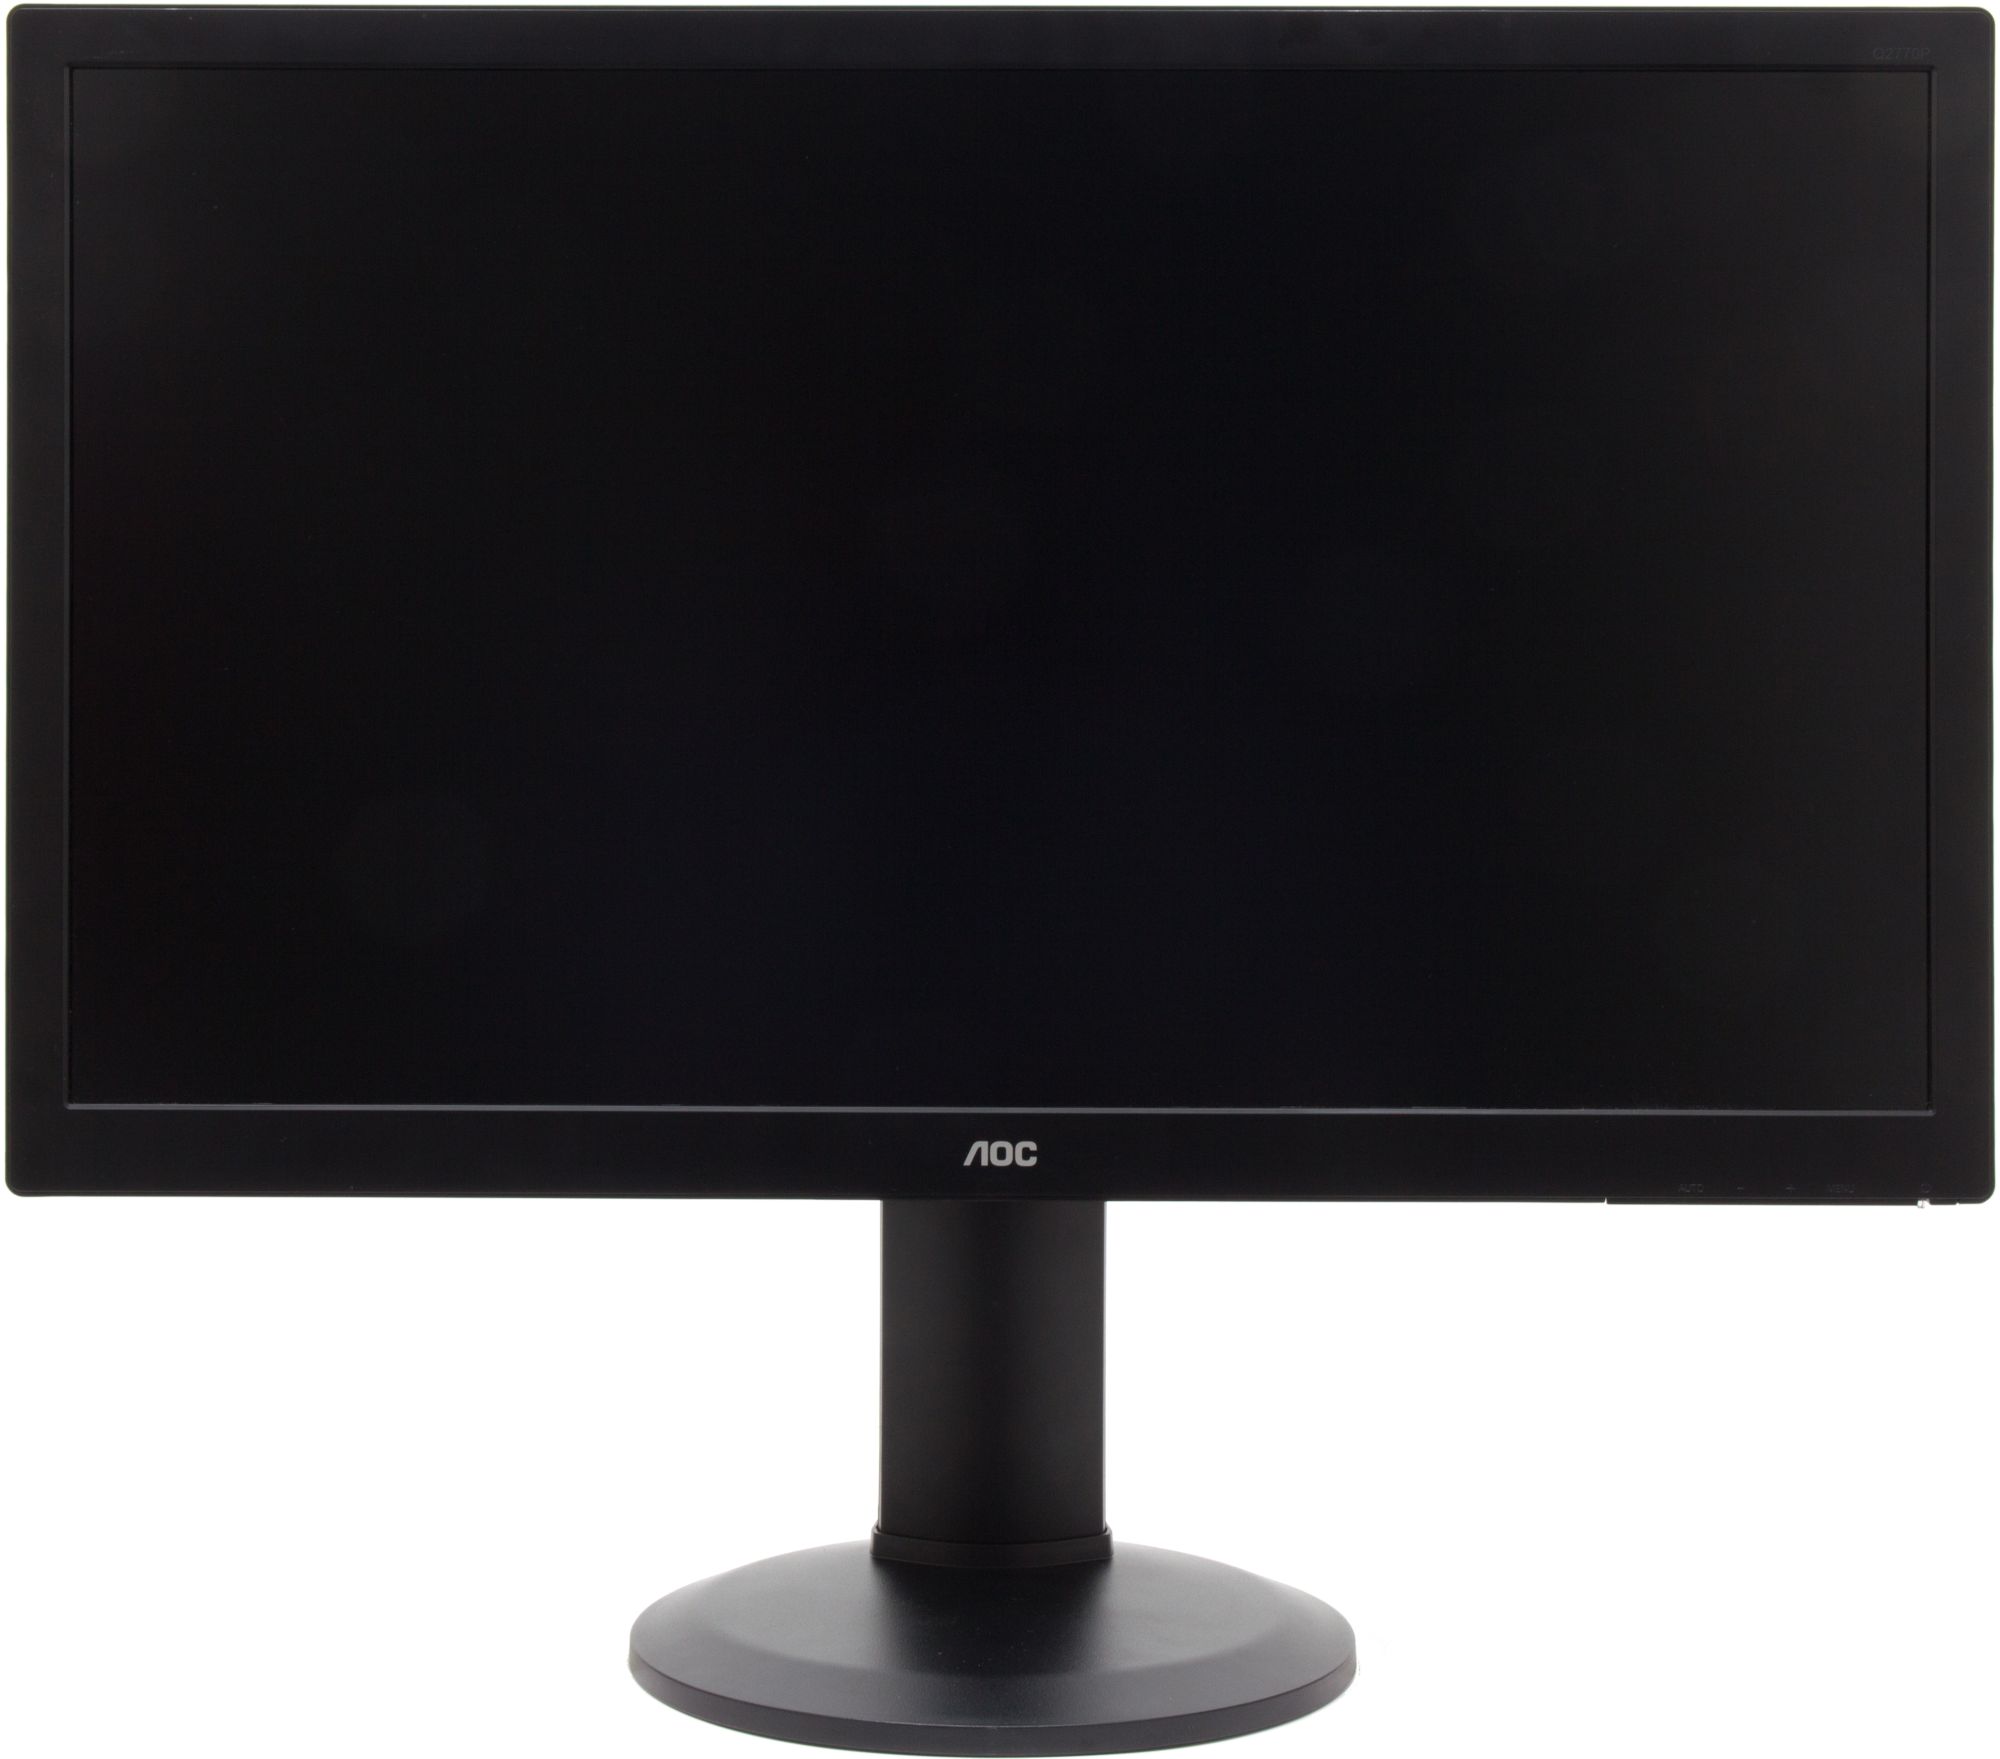
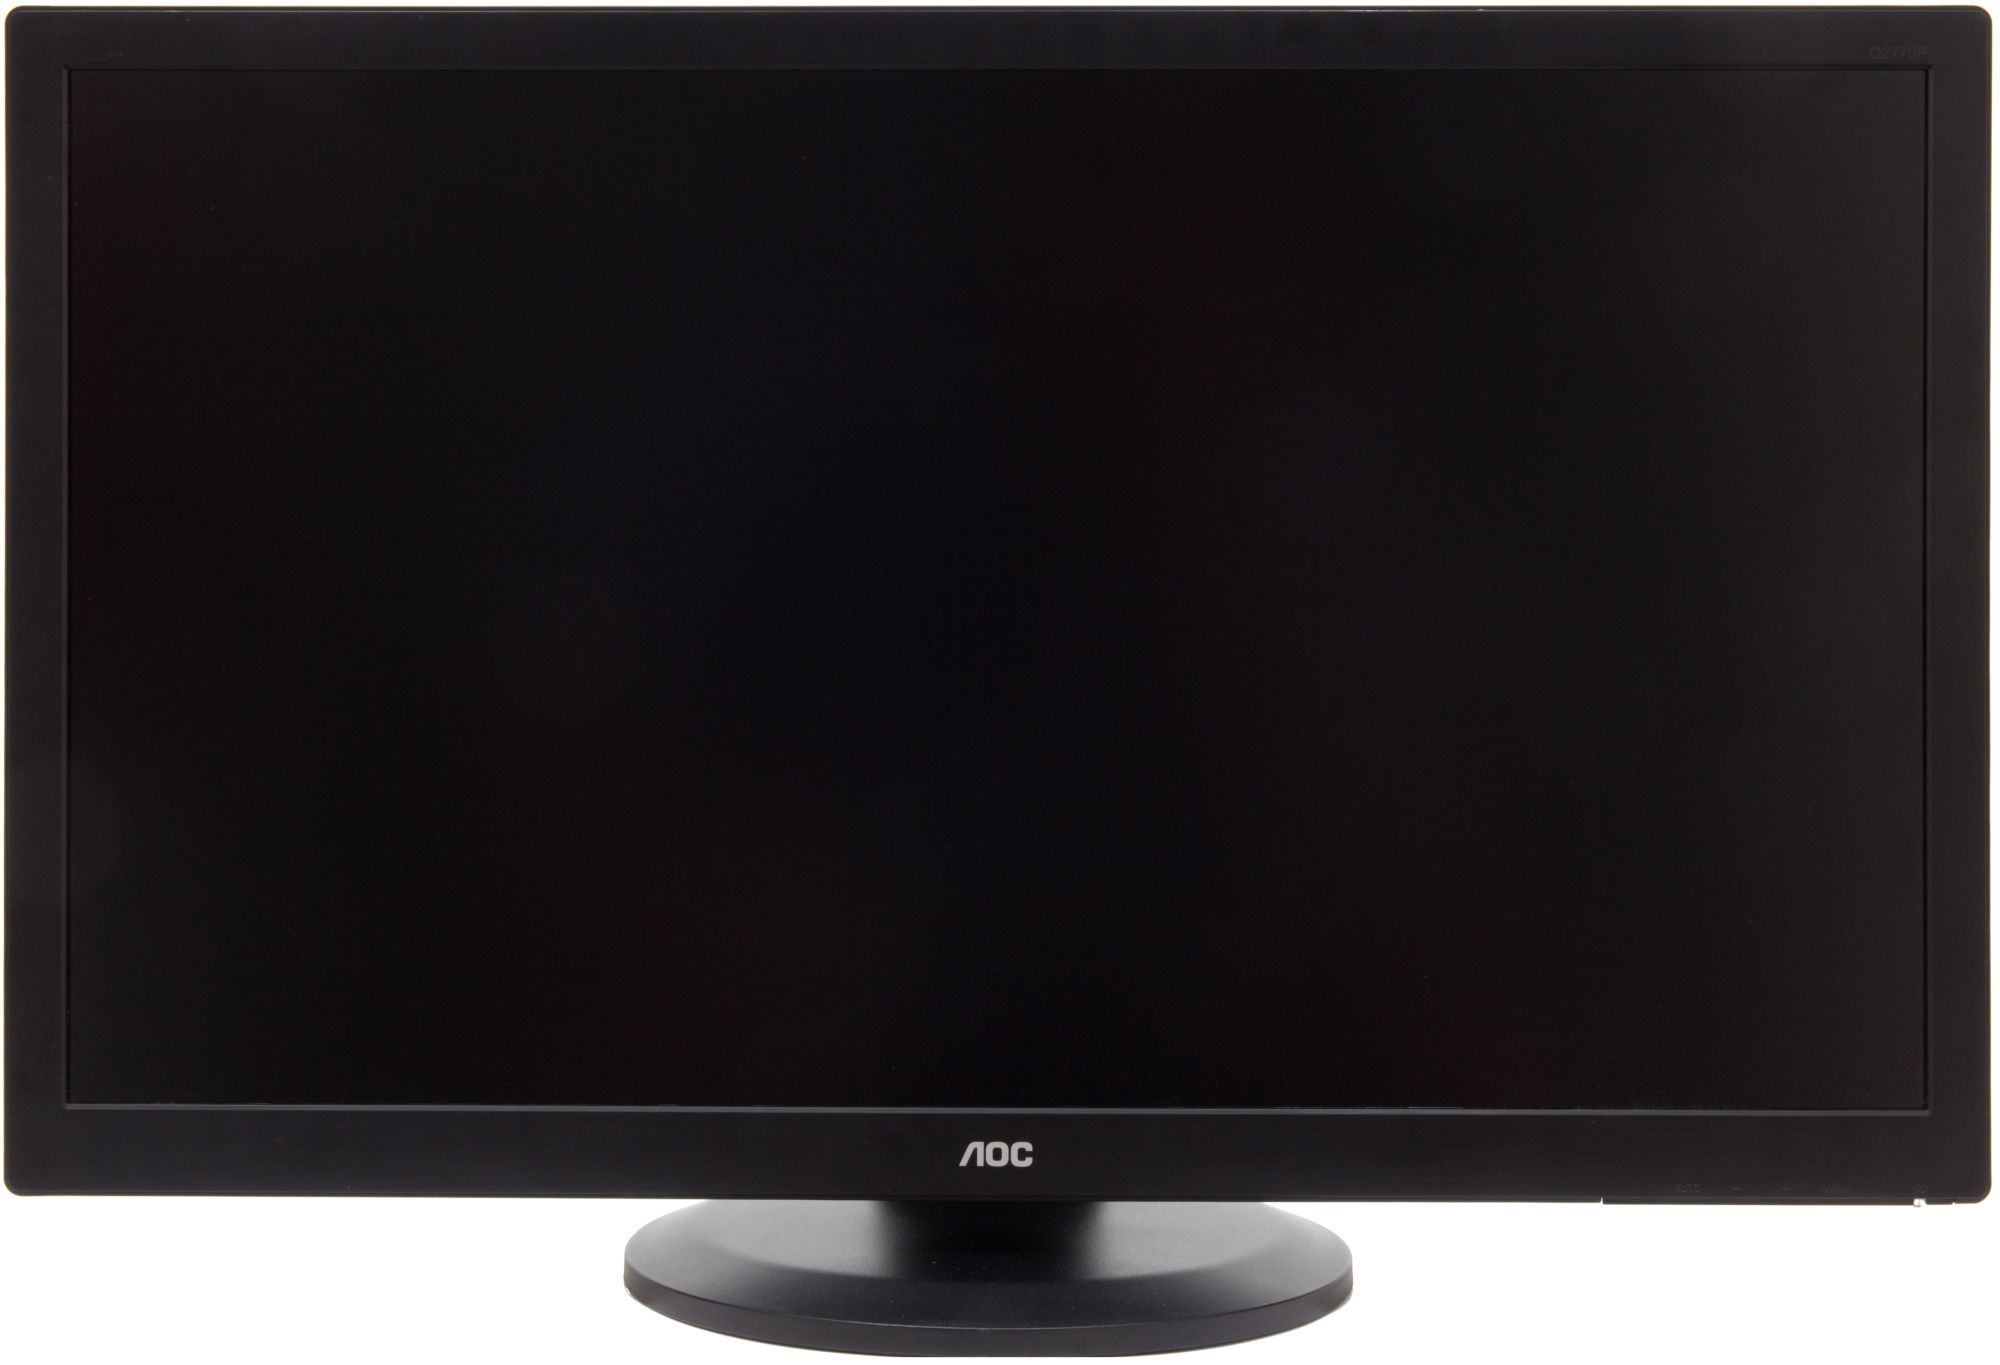
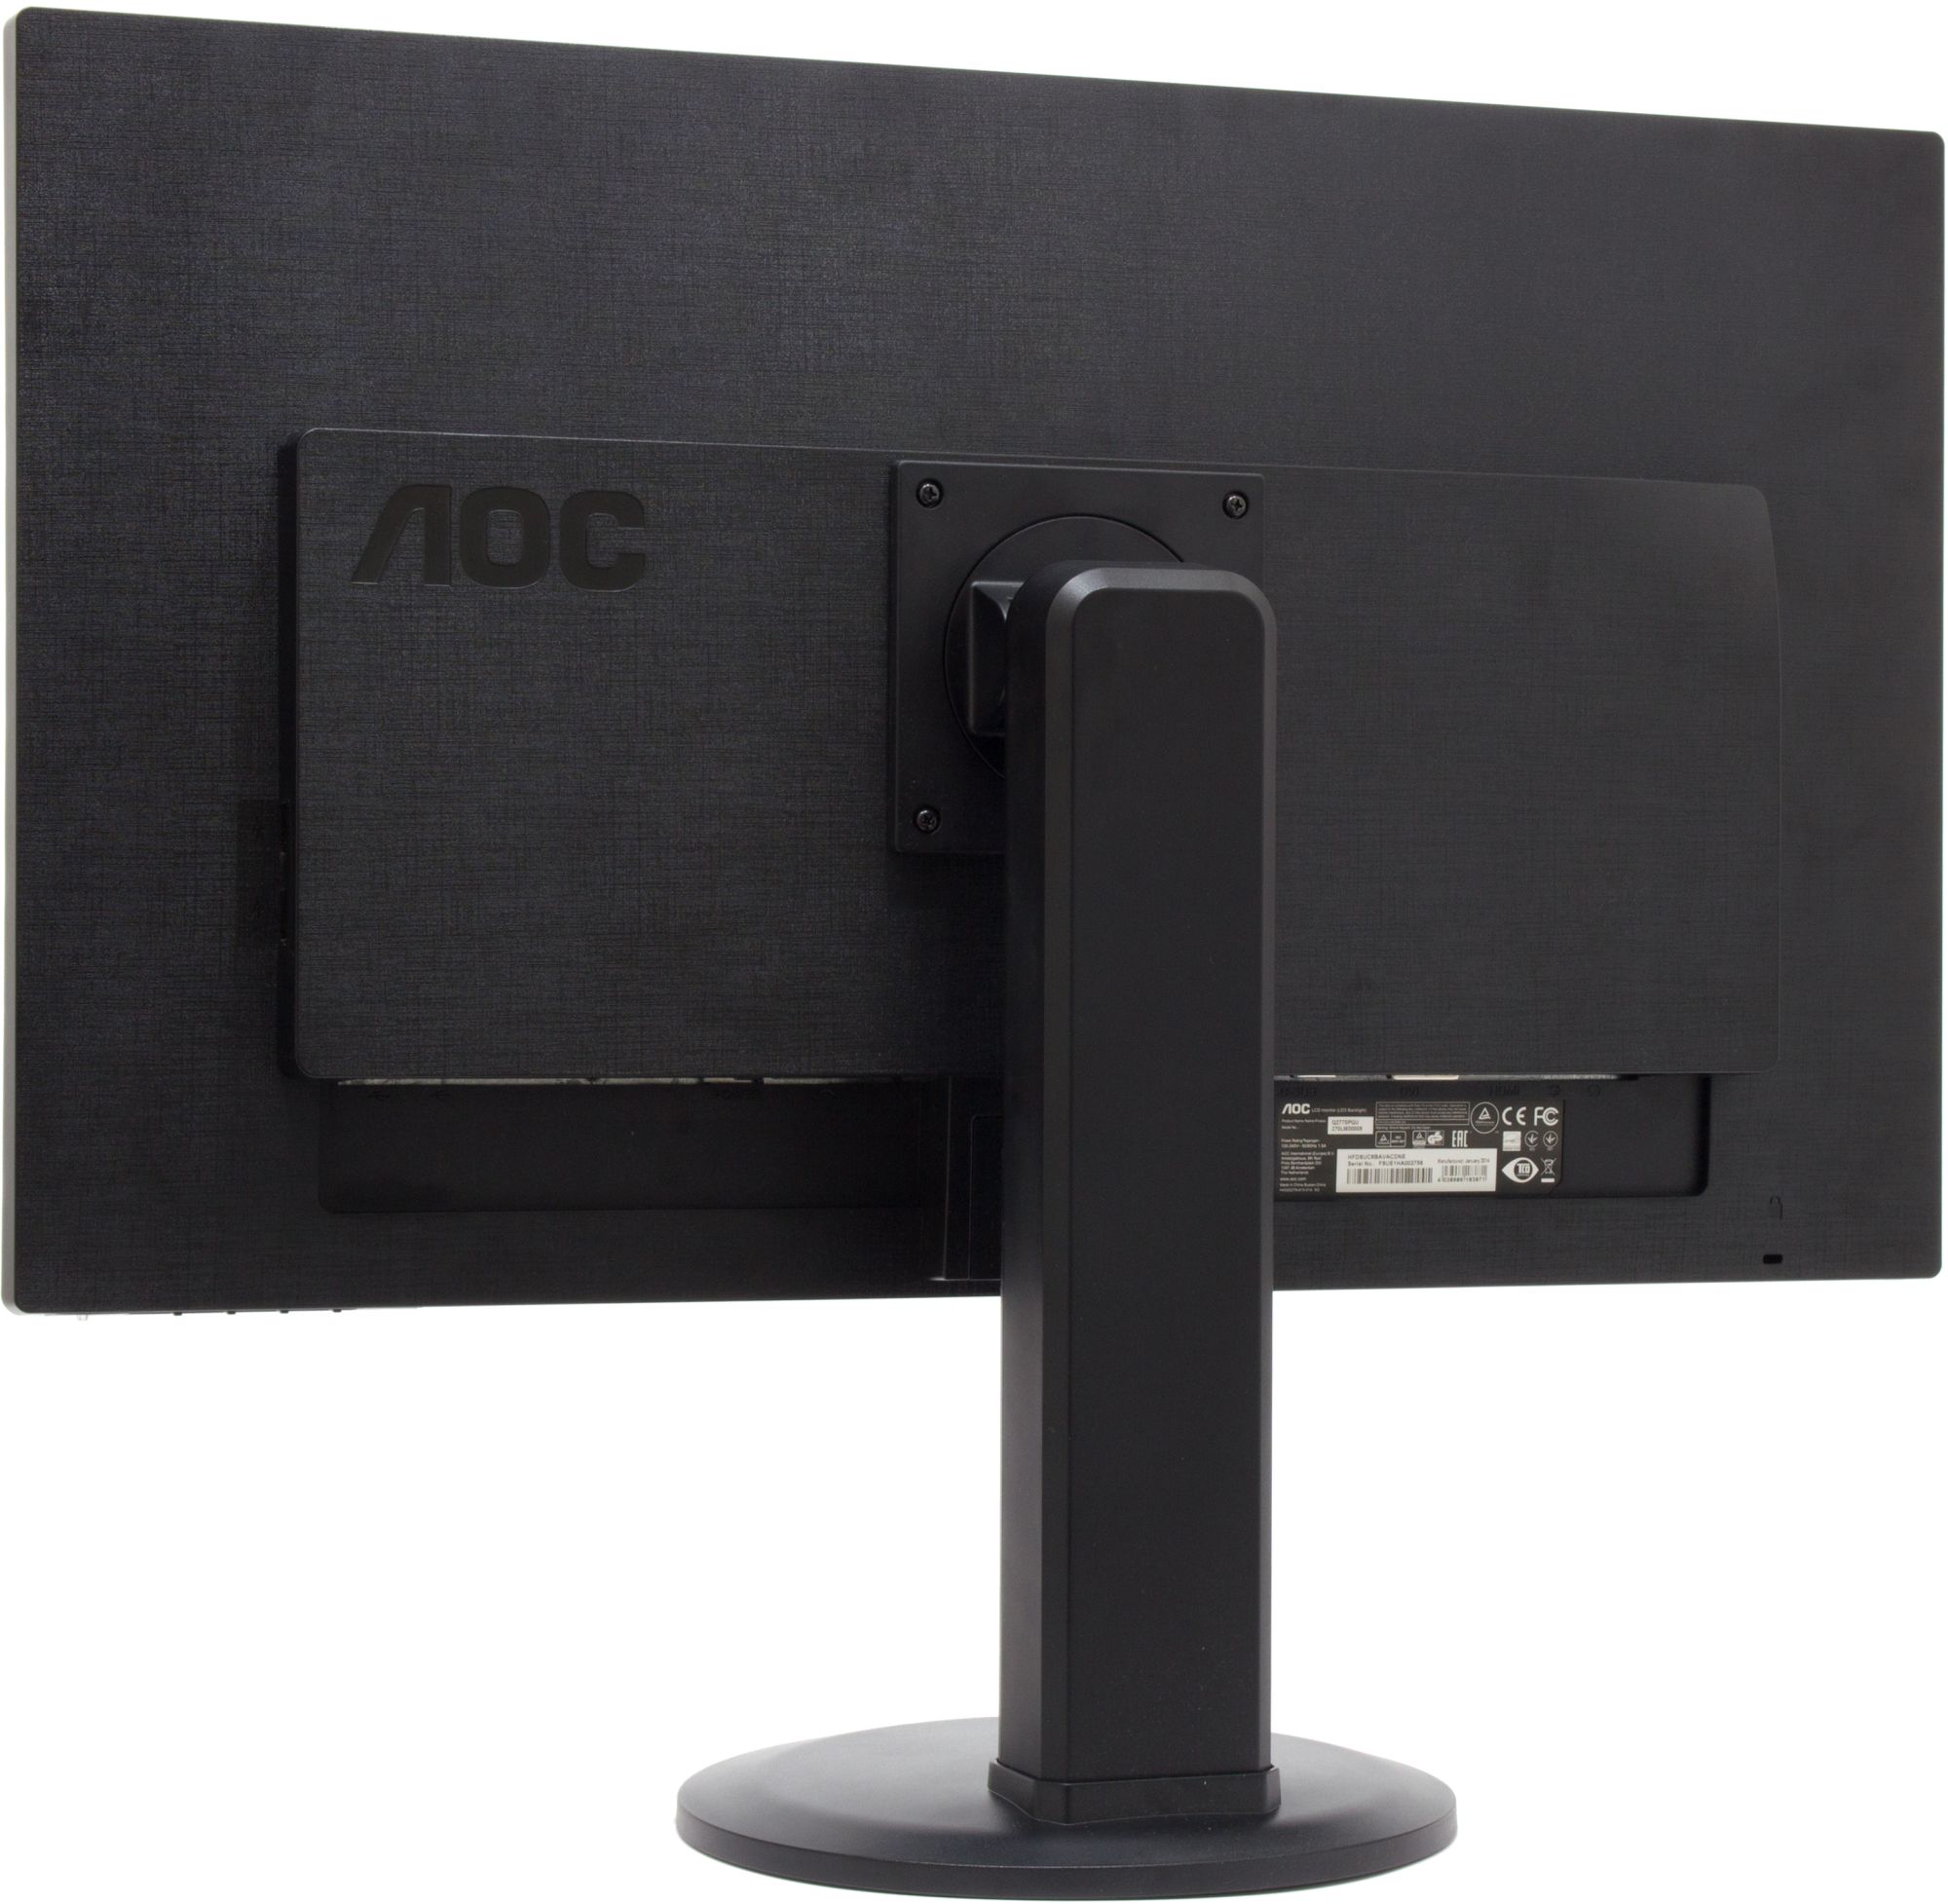
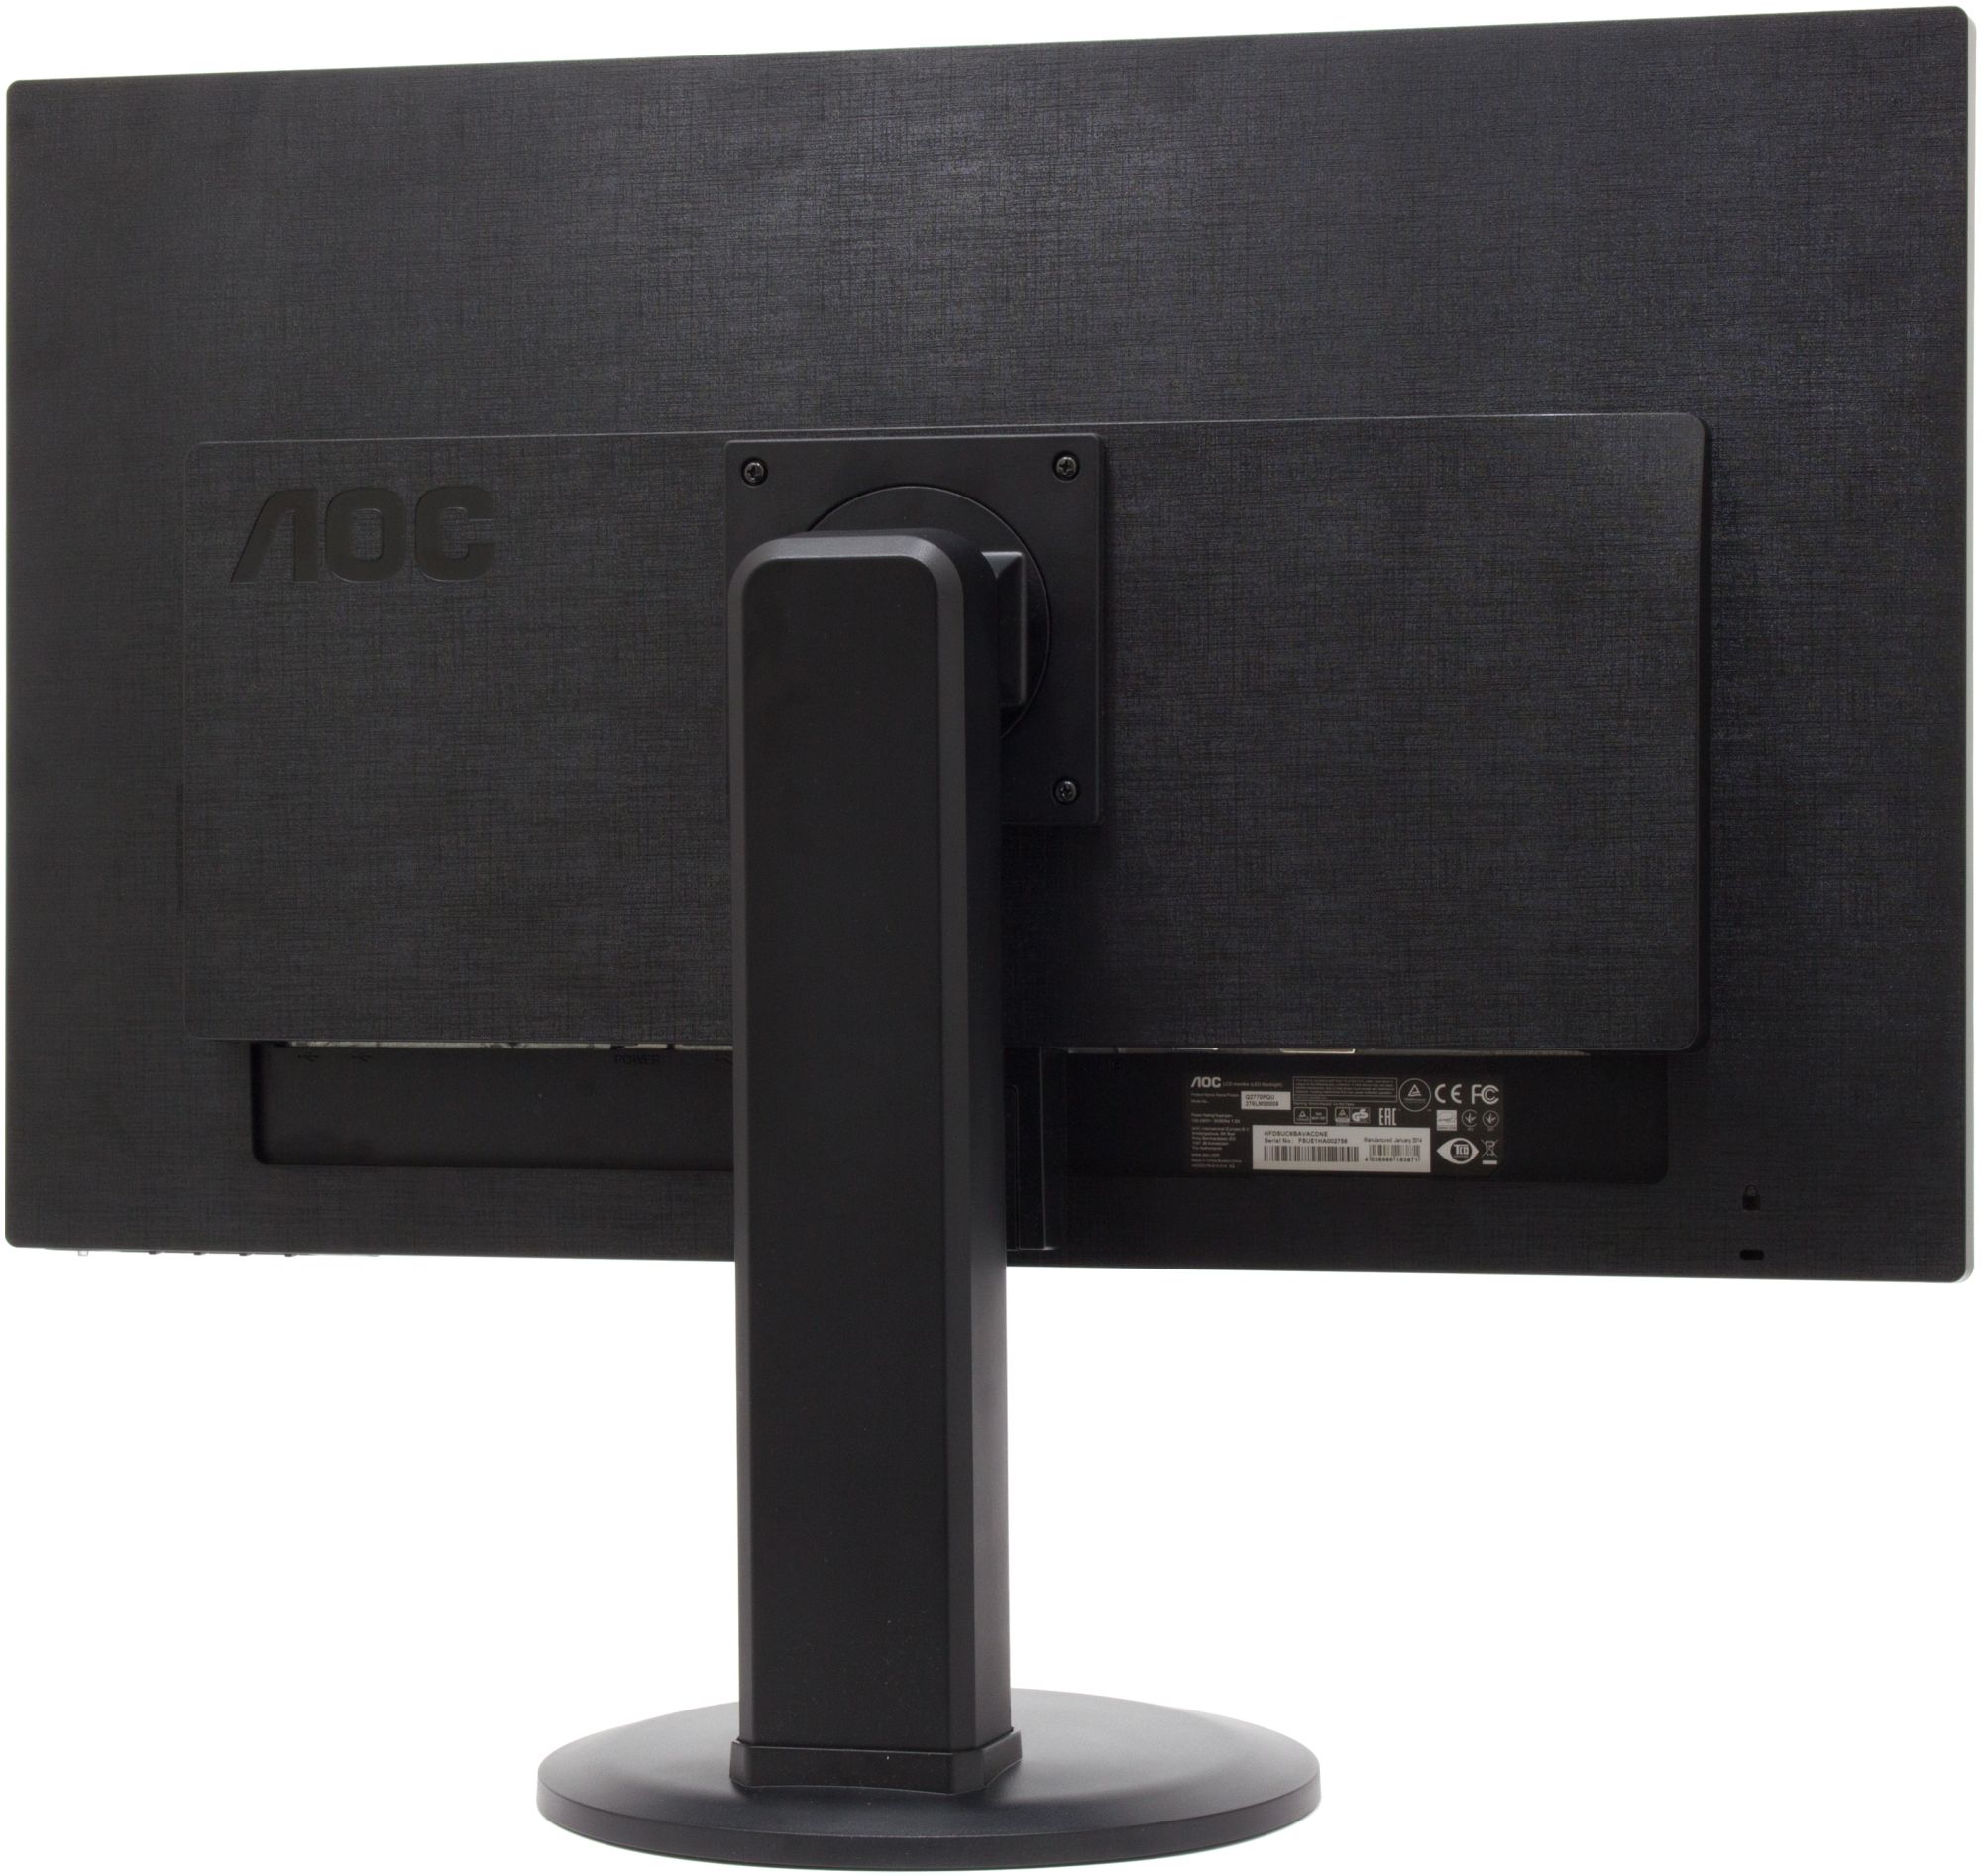
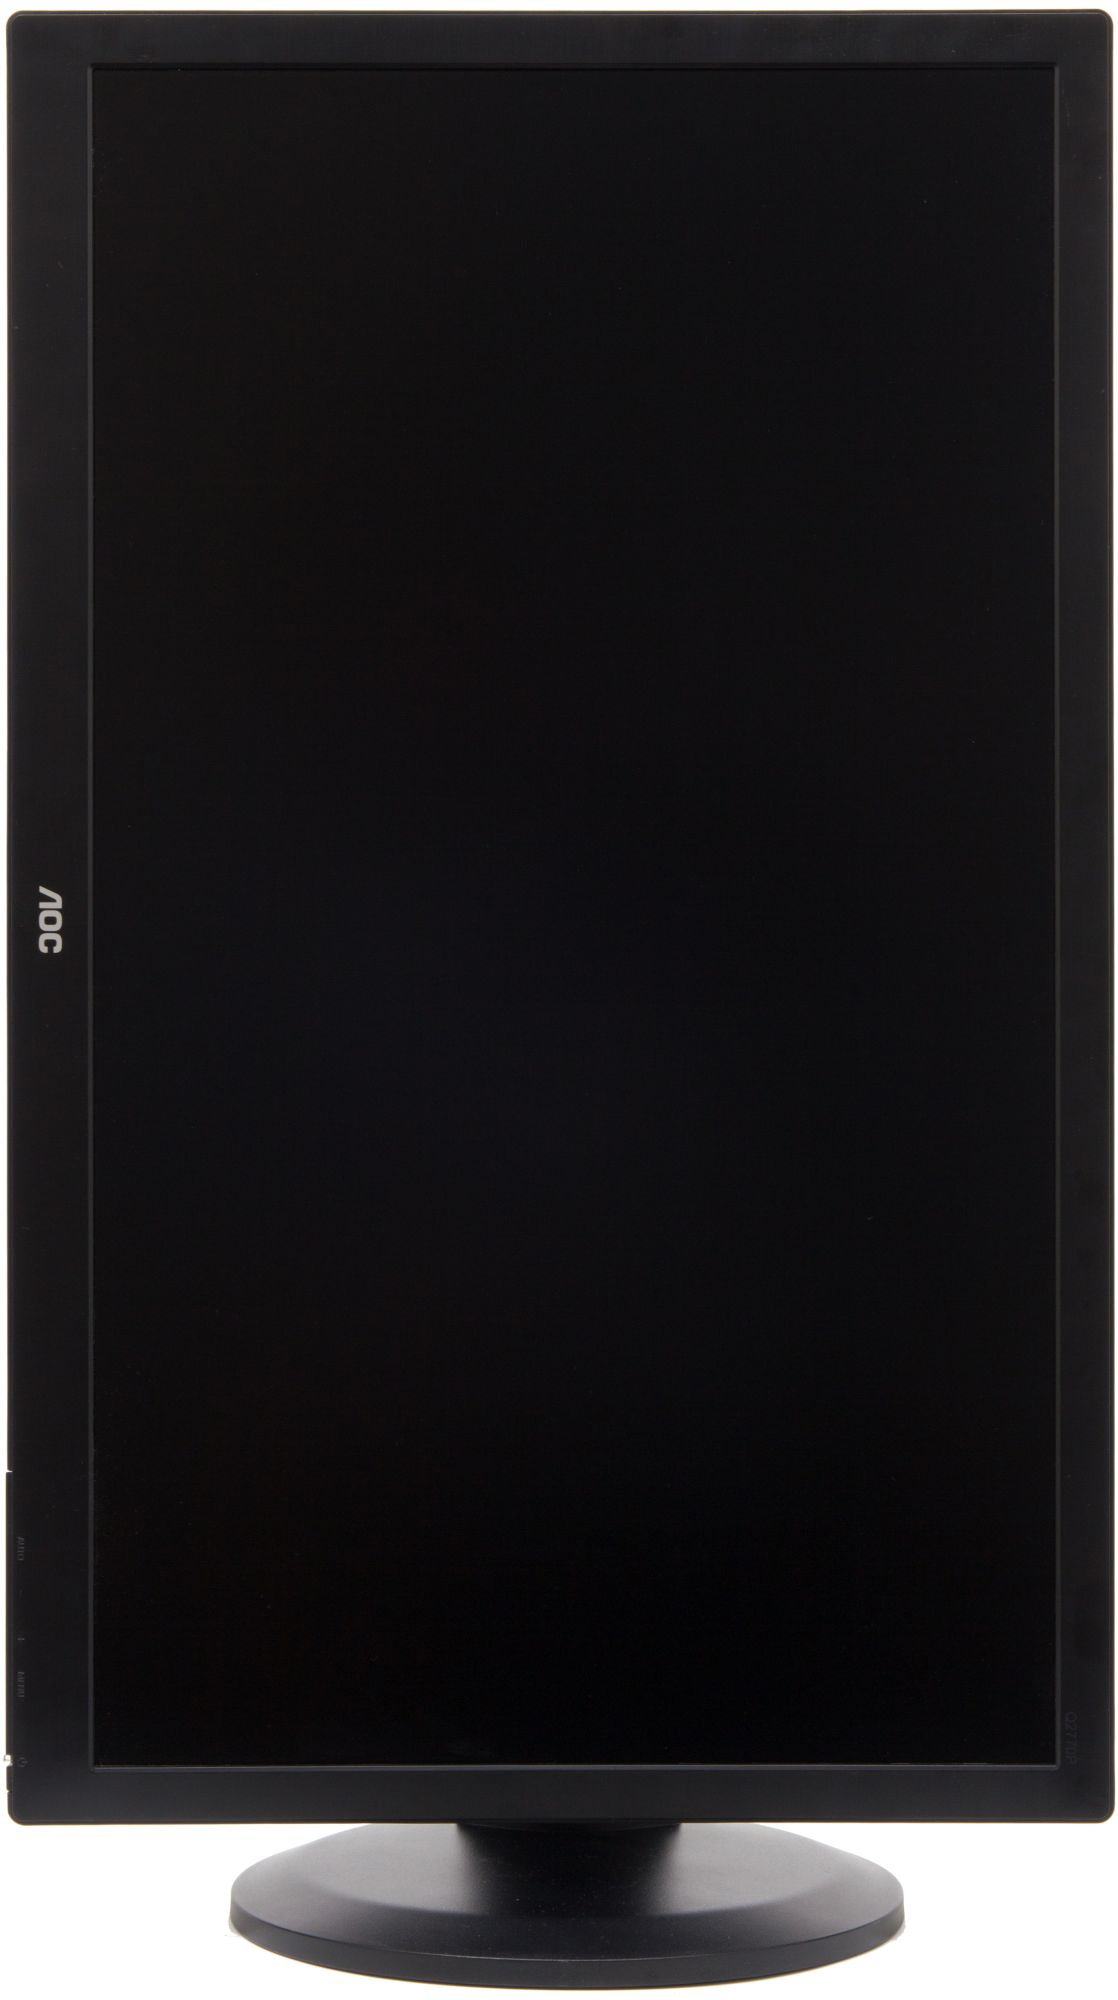
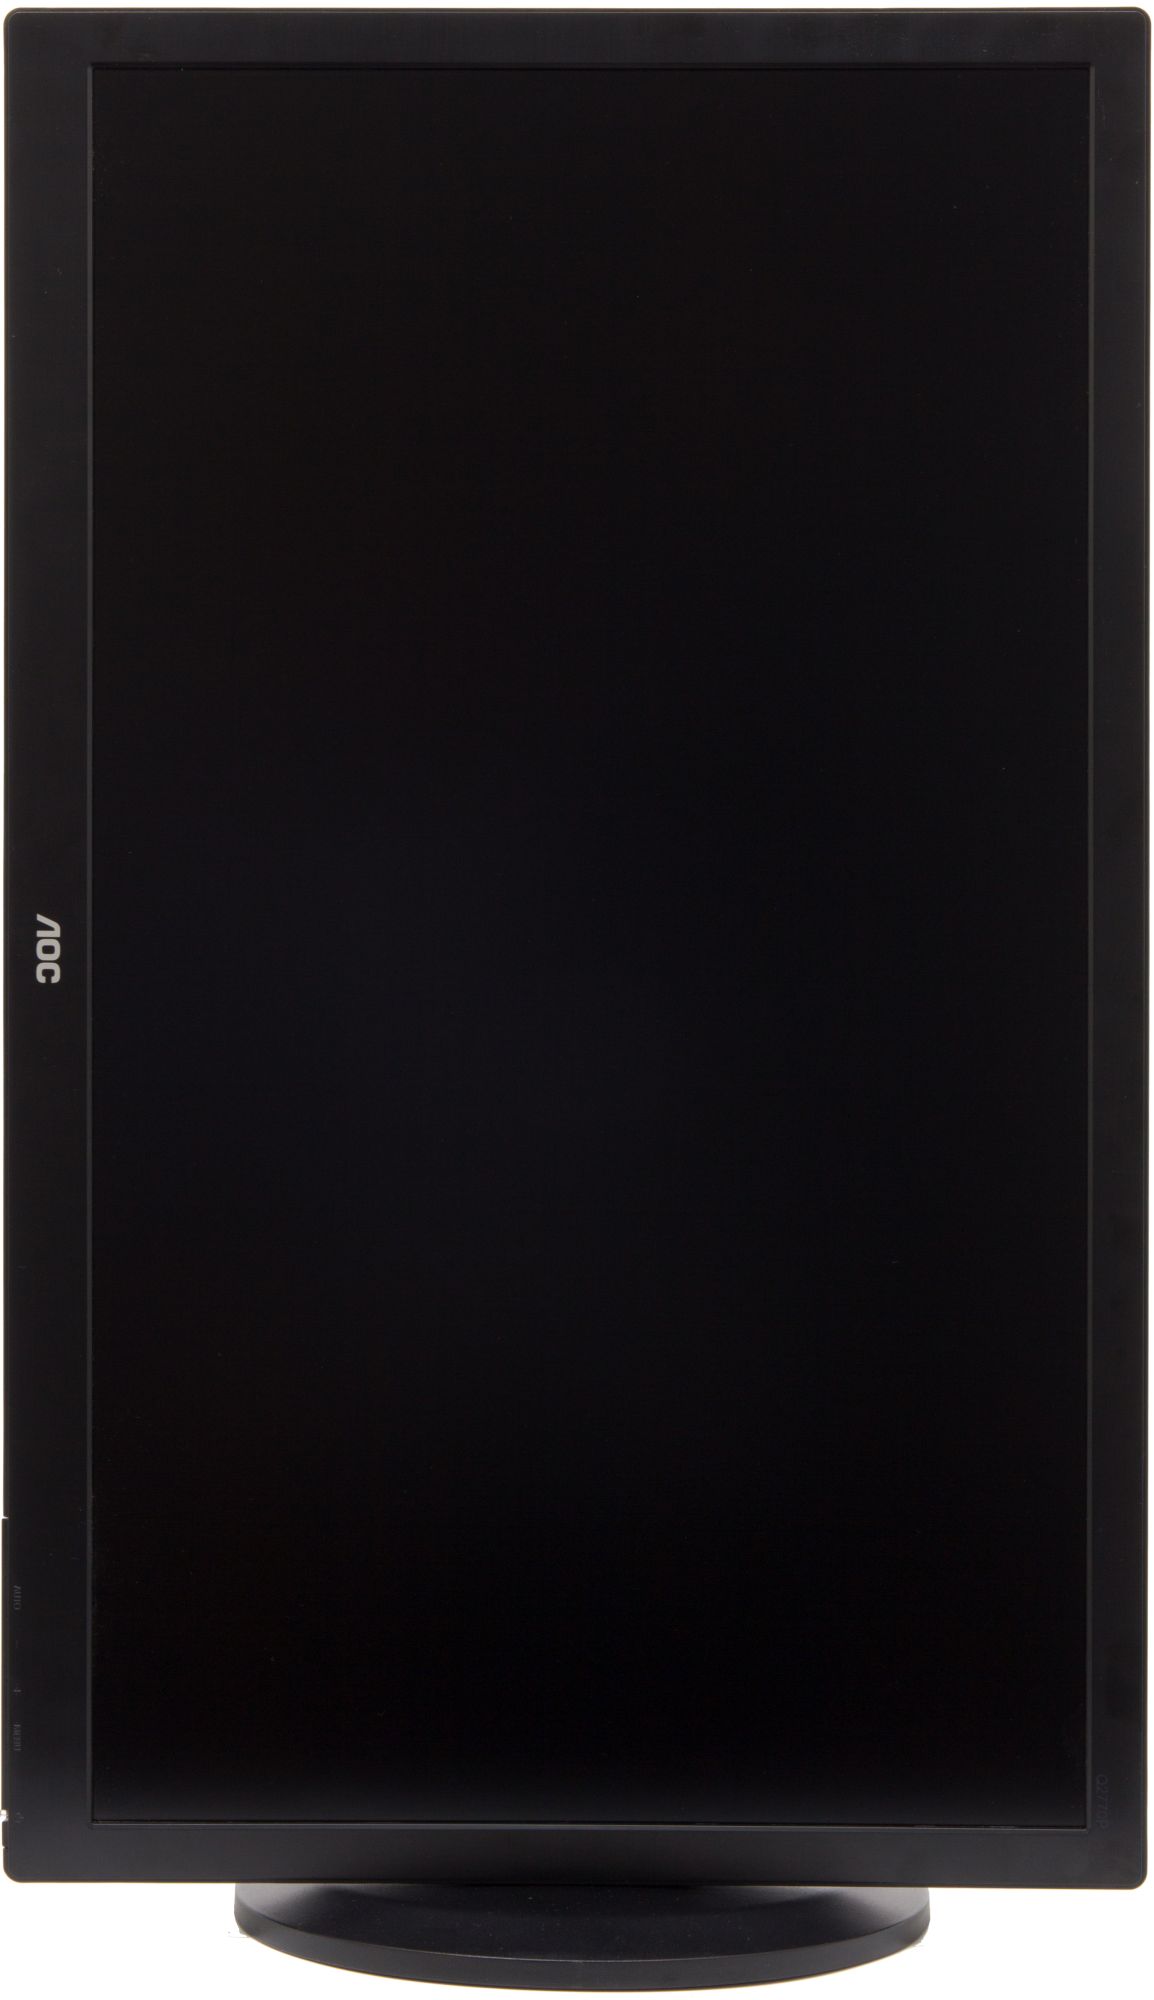
Above:
front view, and rear view |
|
|
|
|
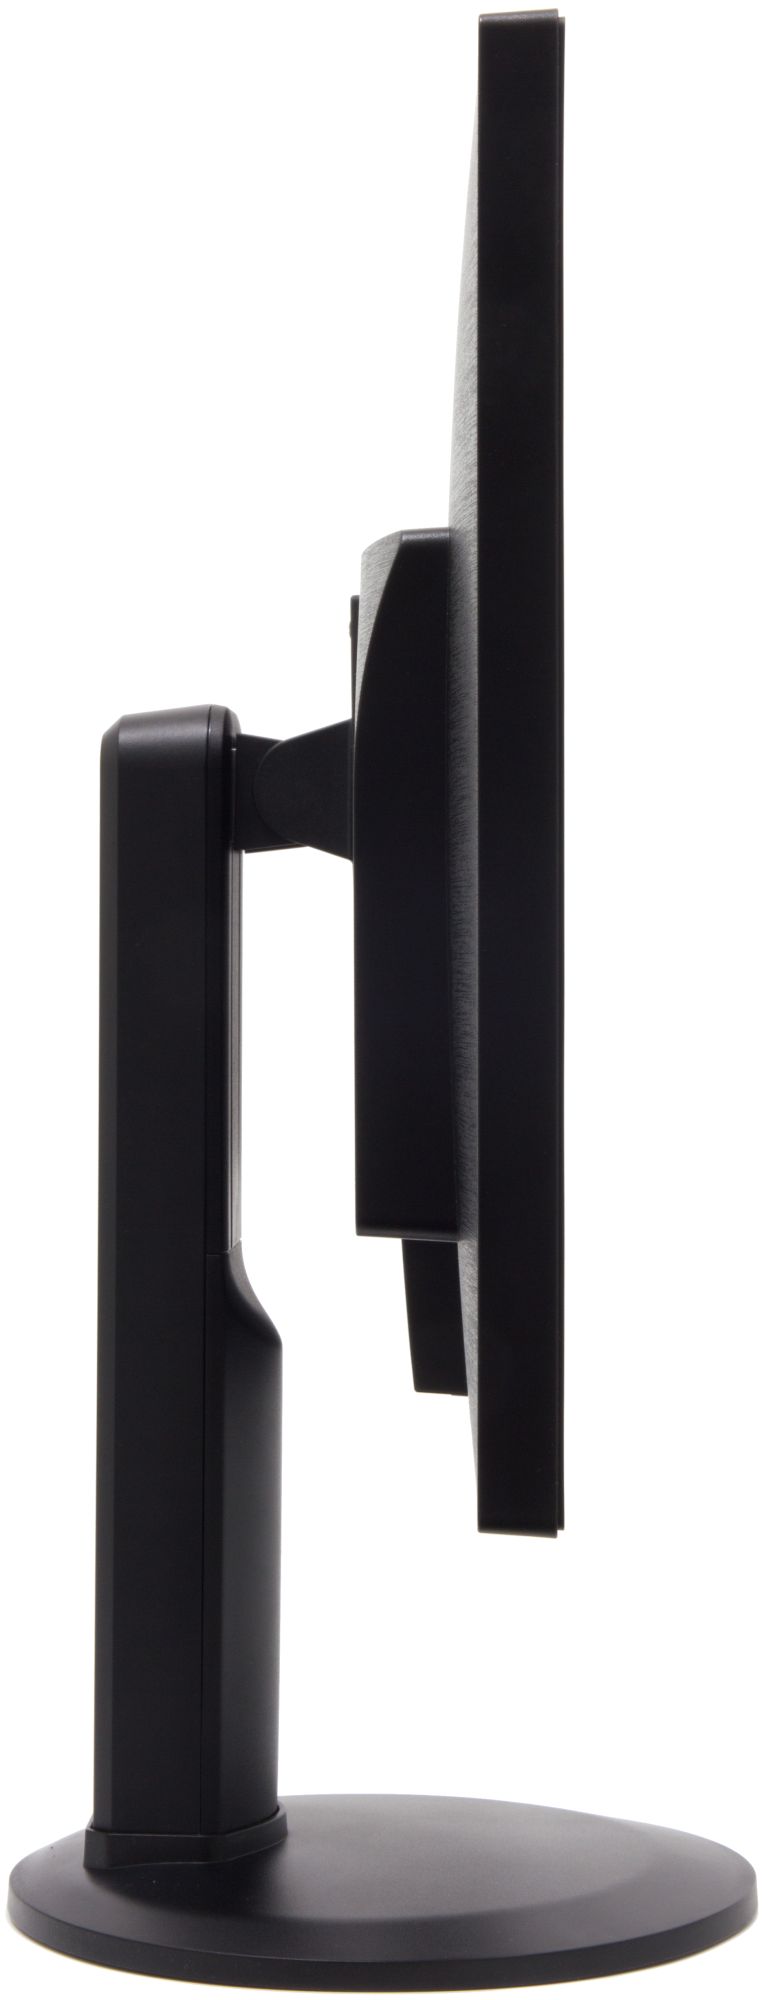
|
Above: side view - left |
Above: side view - right |
|
|
|
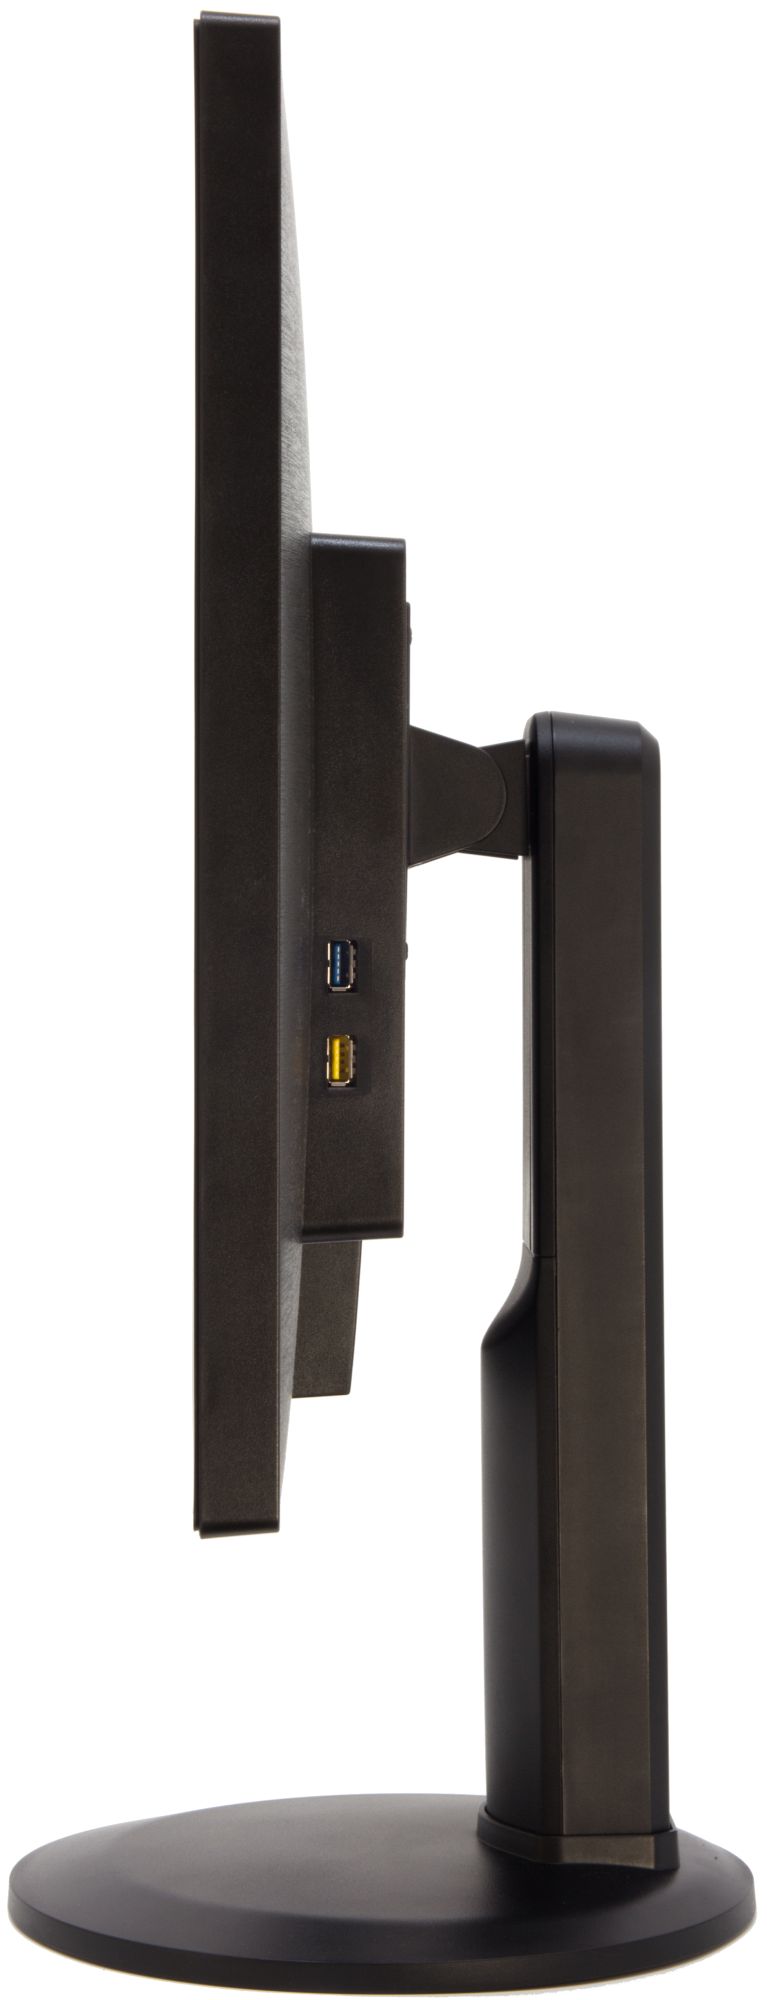
|
Above: detail USB ports side |
Above: connections |
|
|
|
|
Above: detail display and audio connections |
Above: detail power and USB connections |


Build quality and workmanship
The exterior of the q2770Pqu is completely made out of 2 mm thick injection moulded ABS SD-0150. The construction of the stand is made from 1 and 2 mm thick sheet steel. The panel assembly has a steel chassis, as is always the case. A separate chassis for the display electronics, made out of 0.75 mm sheet steel, is fixed to the back of the panel assembly with foil tape. Shielding the electronics from interference and reducing the interference it sends out itself. Again something you’ll see in most displays. These two are then sandwiched between the back case and front bezels, which click together. The workmanship on the exterior is good, but nothing special. No unevenness in surface finish, parts that don’t fit together well or anything like that. The build quality does fall a bit short when it comes to the stability of the stand though. When typing the display is quite stable, but already wobbling around a little. When you bump against your desk it will definitely wobble around quite a bit. Pressing the OSD-buttons and power button will also move the display, because of flexing of the stand. All in all, the stand does not feel very sturdy.
Design
The display itself has a simple but sleek
design, with narrow bezels and rounded corners. The bezels have a surface
finish that resembles brushed aluminium (in horizontal direction), which gives
them a more elegant look. In the upper right corner the model number is
printed on the bezel in a very dark grey (hardly noticeable). In the lower
right corner the labels of the OSD control buttons and power buttons protrude
slightly from the bezel surface. Because they are not also printed they hardly
stand out from the bezel. The only thing that does stand out is the silver AOC
logo in the centre of the bottom bezel.
The width of the bezels is 19 mm, except for the
bottom bezel, which is 28.5 mm wide. However, the back case extends beyond the
bezels, which does make them 2 mm wider in practice. From the side the display
is 22.5 mm wide at the edge and 56 mm in the centre. The bottom bezel is
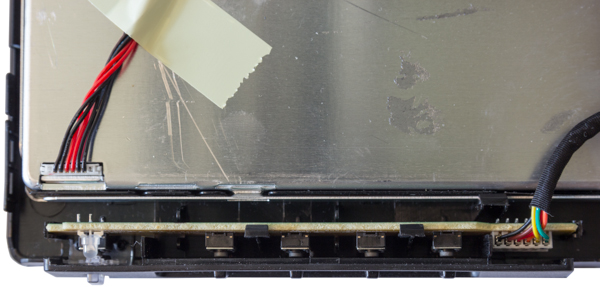
wider, because of the PCB for the OSD control buttons and the power button (as
shown in the photo below). It does appear however that it could have been about 5 mm
narrower.
|
|
|
Above: Power and OSD control buttons PCB inside bottom bezel |
The stand does not look as sleek as the display itself. The base is quite large, measuring 244 mm in diameter. The advantage of a circular base is that it’s very easy to implement the swivel adjustment with a very wide range, but a rectangular base can be much shallower and usually fits better with the design of the display, because the display is also rectangular.
Stand adjustments
The stand of the q2770Pqu features all the common adjustments, including pivot, which is quite rare for a display this size.
|
Height adjustment |
Distance from desk to bezel in lowest setting |
40 mm |
|
Distance from desk to bezel in highest setting |
164 mm |
|
|
Adjustment range |
124 mm |
|
|
Tilt |
Forward |
5° |
|
Backward |
25° |
|
|
Swivel |
Left |
160° |
|
Right |
160° |
|
|
Pivot |
Portrait / Landscape modes |
Yes |
|
|
|
|
Above: highest setting |
Above: lowest setting |
|
|
|
|
Above: tilt backward |
Above: tilt forward |
|
|
|
|
Above: swivel clockwise |
Above: swivel counter clockwise |
|
|
|
|
Above: highest setting in portrait |
Above: lowest setting in portrait |

Warranty
Two of the most important selling arguments for this display are the warranty and service. AOC warrants that the display shall be free of any defects in both parts and workmanship for three years. If any defects do occur the faulty unit shall be replaced with another sample on-site. You can also choose to get the replacement unit and sent the faulty unit back yourself within two weeks. If these defects are already present at arrival the replacement unit will always be a new one. With older samples the replacement unit might be a refurbished unit, but unofficially you’ll always get a new one, because the RMA numbers are too low for it to be profitable to maintain a swap supply.
If you no longer have the proof of purchase you can still claim you warranty. The three year warranty then starts three months after the manufacturing date indicated on the product. This can especially be interesting to owners of second hand units. Outside the warranty period you may still receive service from AOC, but you’ll have to pay for the parts, labour and shipping yourself.
ISO9241-307 Class I
The q2770Pqu is certified as an ISO9241-307
pixel fault class I display, the same as Eizo ColorEdge CG models. Most
displays are Class II, which allows twice as much separate pixel defects as
well as Type 3 cluster defects.
|
Number of pixel defects allowed per million pixels (ISO9241-307:2008) |
||||||
|
Defect class |
Separate pixel defects |
Cluster defects |
||||
|
Type 1 |
Type 2 |
Type 3 2 ∙ n3A + n3B |
Type 1 |
Type 2 |
Type 3 |
|
|
Class 0 |
0 |
0 |
0 |
0 |
0 |
0 |
|
Class I |
1 |
1 |
5 |
0 |
0 |
0 |
|
Class II |
2 |
2 |
10 |
0 |
0 |
2 |
|
Class III |
5 |
15 |
100 |
0 |
0 |
5 |
|
Class IV |
50 |
150 |
500 |
5 |
5 |
50 |
|
Types of pixel defects |
||
|
Type 1 |
Bright pixel |
Always white |
|
Type 2 |
Dead pixel |
Always black |
|
Type 3A |
Bright subpixel |
One or two, but not all three subpixels of a pixel are always on (counted separately) |
|
Type 3B |
Dead subpixel |
One or two, but not all three subpixels of a pixel are always off (counted separately) |
|
Cluster |
Two or more of the aforementioned defects on separate pixels within a cluster of 5x5 pixels |
|
Because the q2770Pqu has 3.6864 million pixels you can officially have your display replaced for:
|
≥4 bright pixels |
|
≥4 dead pixels |
|
≥10 bright subpixels |
|
9 bright + ≥1 dead subpixels |
|
8 bright + ≥3 dead subpixels |
|
7 bright + ≥5 dead subpixels |
|
6 bright + ≥7 dead subpixels |
|
5 bright + ≥9 dead subpixels |
|
4 bright + ≥11 dead subpixels |
|
3 bright + ≥13 dead subpixels |
|
2 bright + ≥15 dead subpixels |
|
1 bright + ≥17 dead subpixels |
|
≥19 dead subpixels |
Unofficially though, you can have your display replaced for any number of pixel defects of any type.
For the testing of both the speakers and the headphone out audio was transferred to the display over DisplayPort and output was set to a sample frequency of 44.1 kHz and an audio bit depth of 16 bits, matching the MP3 and FLAC files used to test the audio quality.
The q2770Pqu has a 3.5 mm mini-jack stereo input
and also accepts stereo audio over DisplayPort and HDMI. The output can be
provided by either the built-in speakers or by connecting a pair of headphones
to the 3.5 mm mini-jack headphone out.
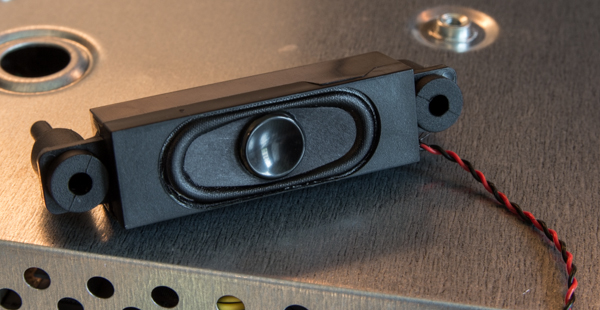
Built-in speakers
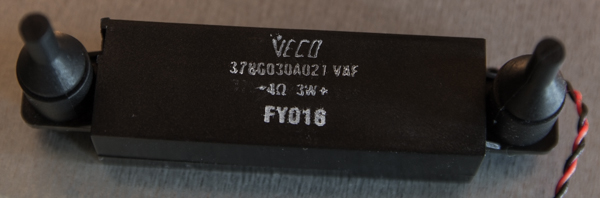
The q2770Pqu has two built-in speakers from Veco,
model 378G030A021. These are 3 W speakers with a 4 Ω impedance and an oval
shaped diaphragm which measures 37 x 14 mm. In total they measure 53 x 17 x
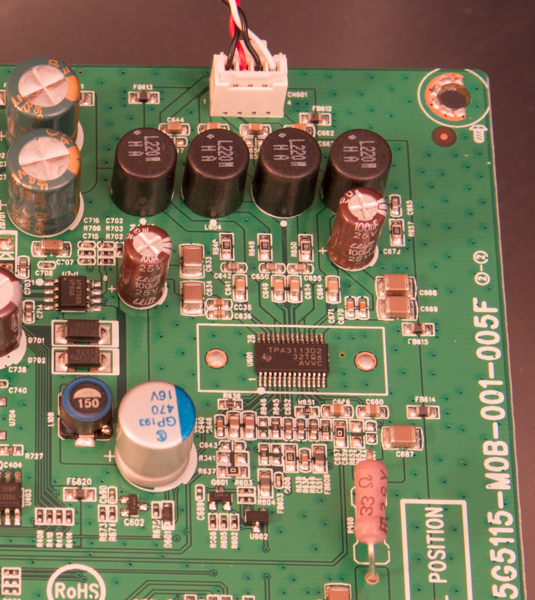
14.5 mm (L x W x D). They are powered by a Texas Instruments TPA3113D2
6W/channel stereo class-D power amplifier.
|
|
|
Above: diaphragm of speaker |
|
|
|
Above: backside of speaker showing brand, model, power output and impedance |
|
|
|
Above: the electronics on the main circuit board that drive the built-in speakers |
The built-in speakers in the q2770Pqu really
require a short break-in period. During the first test the sound was so
distorted that they were really unusable. When testing the maximum energy
consumption of the display, including USB and audio, the speakers were pushed
past clipping. After we got the results of that test the volume was lowered
and the speakers already sounded much better then. After a few more hours of
playback the sound quality was re-assessed, by then they produced a quite
reasonable sound. To get the most of them does require some fiddling around
with the equalizer in the playback software, because the frequency response of
these speakers is far from linear. But even then the sound is reasonable at
best, mainly because of the lack of bass. Especially low pitched instruments
will suffer from this. A bass guitar for instance almost sounds like a regular
guitar, because the volume of frequencies below 350 Hz drops dramatically and
below 130 Hz it doesn’t produce any sound whatsoever. This causes music with
prominent bass lines to sound quite horrible. Because of this, male vocals
don’t sound that well either, female vocals work better with these speakers,
but still lack clarity.
At higher frequencies the speakers perform better, but up from 13.5 kHz you’ll also notice a decline in volume and frequencies above 16.5 kHz can’t be reproduced either. Apart from the narrow frequency response the built-in speakers also lack dynamic range. In music with a high dynamic range you’d have to choose between the hard parts clipping or the soft parts not being produced at all. Altogether the built-in speakers are the most into their own when the sound quality isn’t that important, for instance with the playback of just speech or with low volume background music.
Headphone out
The headphone out was tested with a pair of
Sennheiser HD 595 headphones. There’s really nothing to complain here. I could
not tell it apart from the Realtek ALC889 audio codec on my motherboard,
despite knowing which was which.
USB
The q2770Pqu has a four port USB hub, built
around the
VIA VL811 USB 3.0 hub controller. The USB hub is built on a separate PCB.
It features a USB 3.0 Standard B upstream port to connect the hub to the PC,
two USB 2.0 High Speed ports, one regular USB 3.0 Super Speed port and one USB
3.0 Super Speed Fast Charge port. The USB 2.0 ports and the upstream port are
located at the bottom and the two USB 3.0 ports are located at the right hand
side.
|
|
|
Above: USB hub PCB |
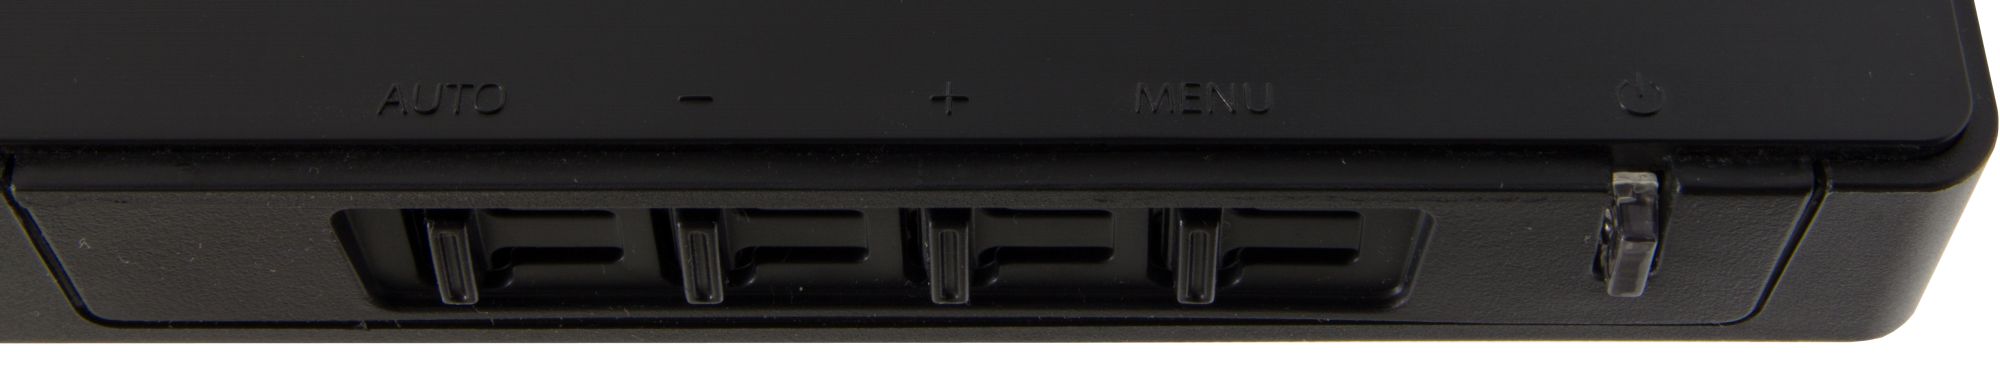
Above: OSD
control buttons
The OSD is controlled by four buttons on the underside of the bottom bezel.
|
Button (from left to right) |
Function outside OSD |
Function inside OSD |
|
Auto |
Input select |
Exit / back |
|
- |
Clear Vision (sharpening) |
Previous / decrease value |
|
+ |
Volume of stereo output/speakers |
Next / increase value |
|
Menu |
Open OSD |
OK |
The OSD works intuitively and has a logical categorization. It’s also more complete than most OSD’s, offering three gamma modes, four overdrive modes and an automatic off timer among the basic settings you’ll find in most OSD’s. The control buttons do their job, but they do not work as nicely as for instance the touch controls on the Dell UltraSharp display with automatic function labelling on screen. They really do require some time to get used to and even then you’ll find yourself pressing the wrong button every now and then.
Photographs of OSD
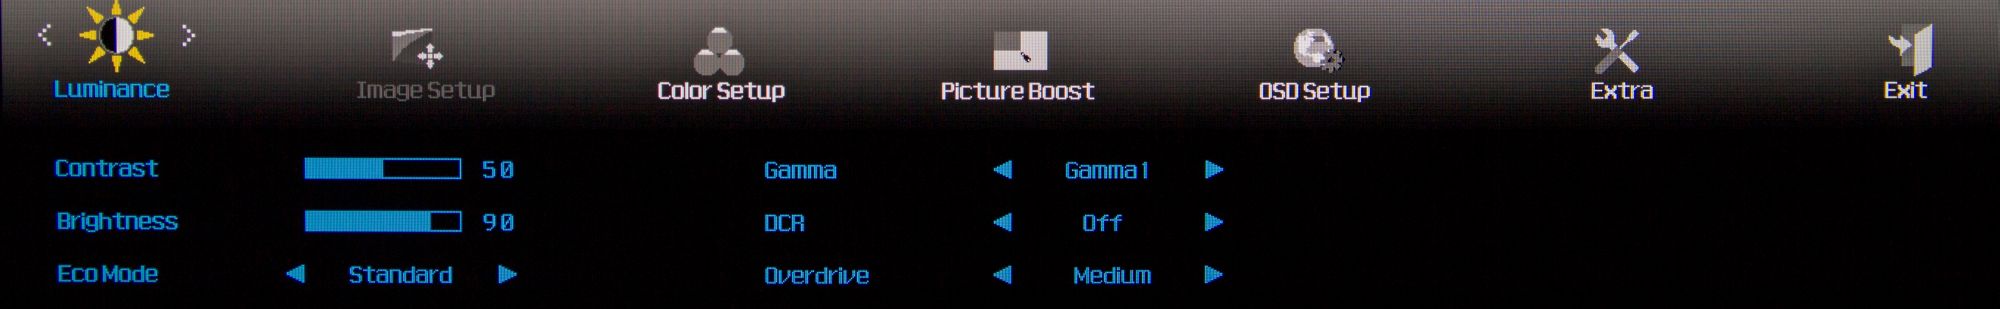
OSD –Luminance

OSD – Image Setup (only
available on VGA)
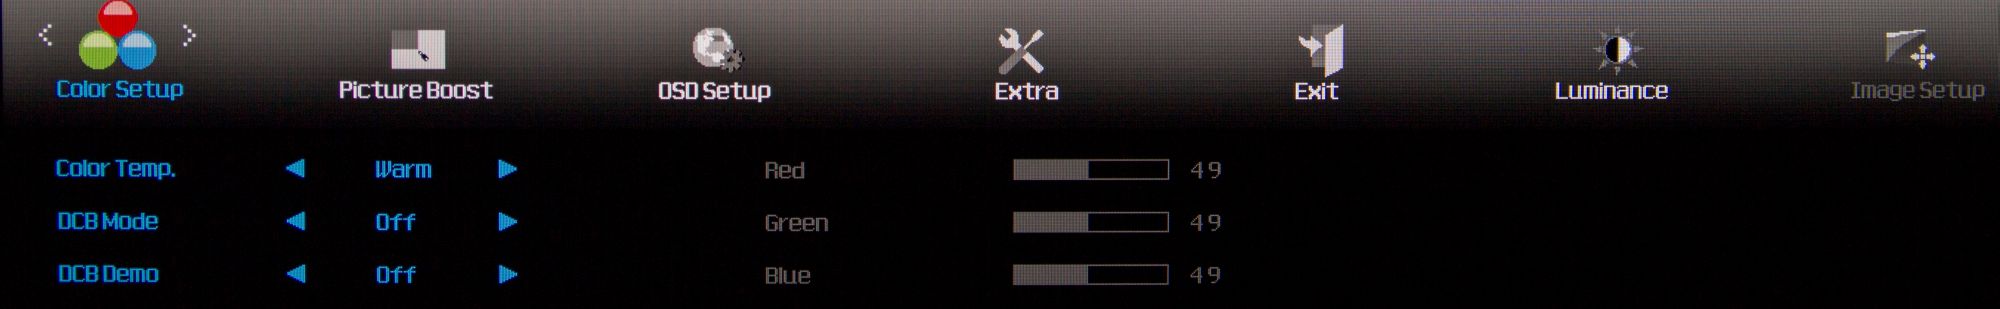
OSD – Colour Setup

OSD – PictureBoost
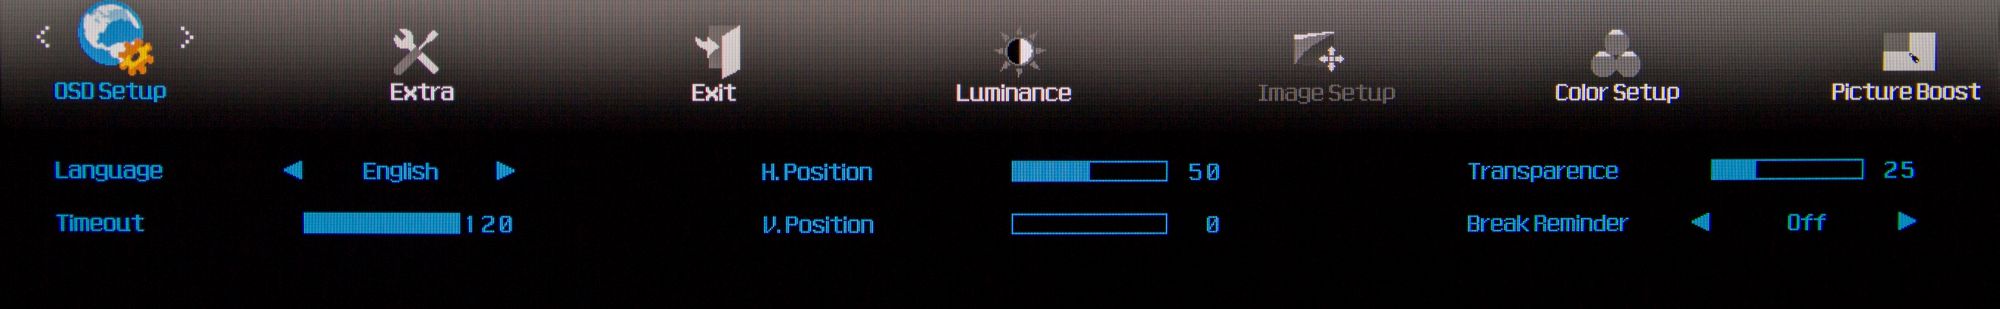
OSD – OSD Setup
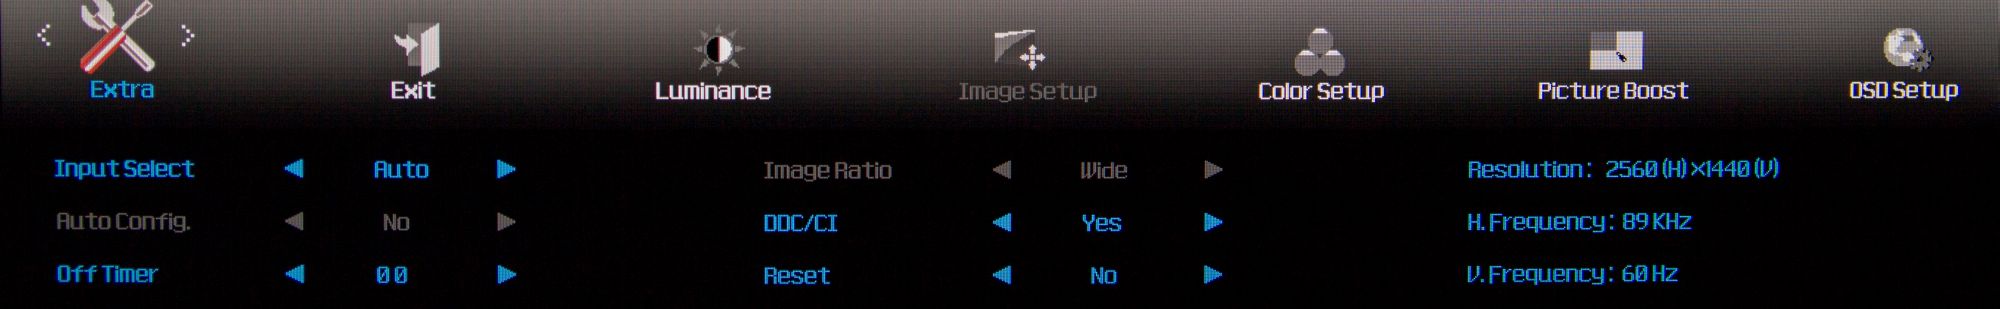
OSD – Extra
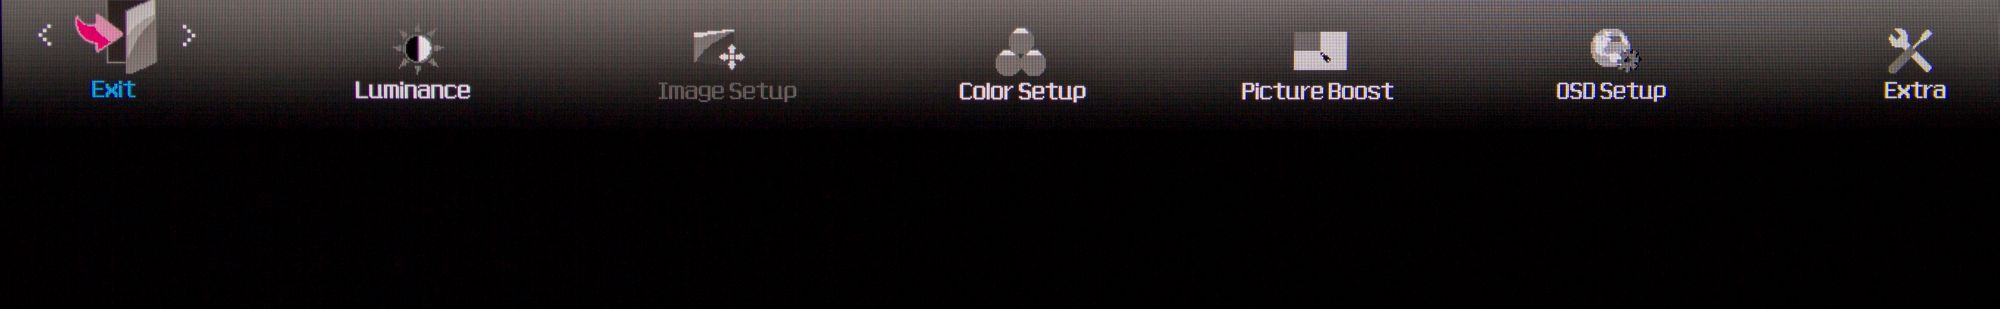
OSD – Exit
Factory OSD
The Factory OSD (also known as Service Menu) is a menu for the manufacturer to set up the display. As an end user there isn’t really a good reason for accessing the factory OSD, except maybe the panel on timer, since the q2770Pqu doesn’t support Active Power On Time over DDC/CI.
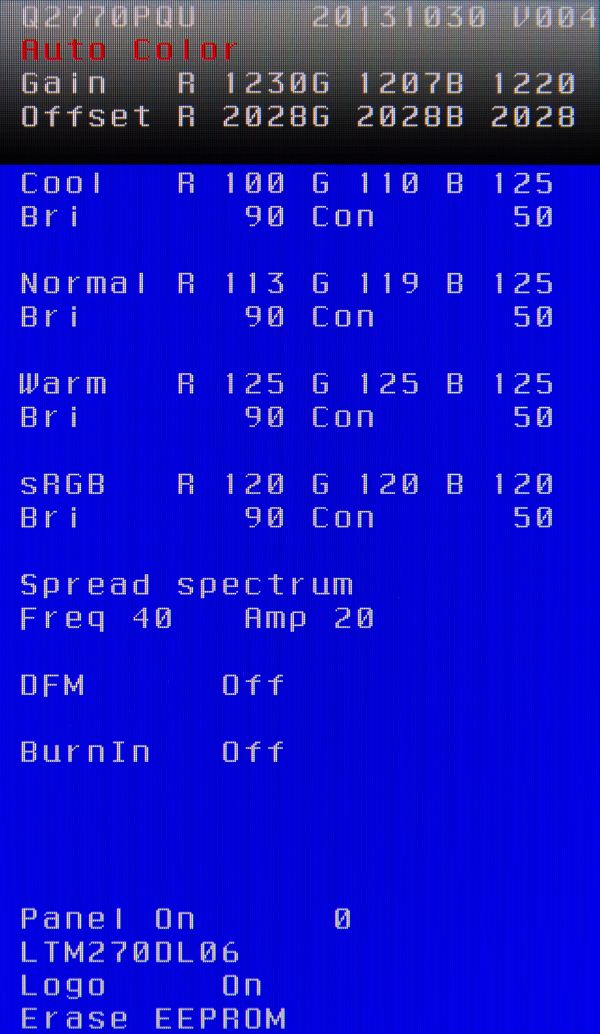
Factory
OSD. Click for larger version
From left to right and top to bottom these settings/values have the following meaning:
|
Q2770PQU |
Display model |
|
20131030 |
Factory OSD version date in YYYYMMDD format |
|
V004 |
Factory OSD version number |
|
Auto Color |
Heading of global gain and offset settings section |
|
Gain |
Global RGB gain settings |
|
Offset |
Global RGB offset settings |
|
Cool Rx Gx Bx |
RGB settings for white balance mode “Cool” (same for other modes) |
|
Bri 90 |
Default brightness for white balance mode = 90 (same for other modes) |
|
Con 50 |
Default contrast for white balance mode = 50 (same for other modes) |
|
Spread spectrum |
Heading for LVDS spread spectrum clocking section |
|
Freq |
Frequency modulation in spread spectrum clocking |
|
Amp |
Amplitude modulation |
|
DFM |
Switch on/off Design For Manufacture mode |
|
BurnIn |
Switch on/off built in burn-in mode |
|
Panel On x |
Panel on time counter in hours |
|
LTM270DL06 |
Panel type number |
|
Logo |
Switch on/off the display of the logo when turning on the display |
|
Erase EEPROM |
Complete reset to Factory Default Settings |
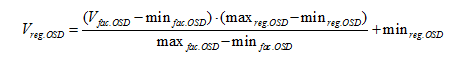
Explanations
Auto
Color: Gain / Offset
Gain and offset are curve adjustments, like gamma. In the simplest model the effect of each on the output is as follows:
![]()
Therefore, gain is a multiplicative modulation, offset an additive modulation and gamma a power modulation. The effect of gain is most prevalent in the highlights, offset in the shadows and gamma in the mid-tones.Because gain and offset are curve adjustments that can be set per channel, they affect both white balance and gamma of the output. The values in the Factory OSD for gain and offset are all 12 bit values (0-4095), which shows that the internal processing bit depth of the controller is 12 bits per channel (incoming signal from graphics card and panel are both 8 b/ch).
While these values can be adjusted and saved the
effect seems to be locked. When you adjust any of them the word “Fail” appears
next to “Auto Color”. Which is a shame for the real power users, because they
could use some tweaking. AOC told us that the values for these settings are
identical on every sample of this model. So there is no factory calibration.
RGB settings for white balance modes
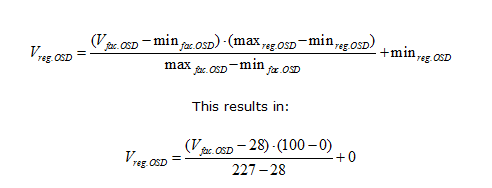
These settings determine the white balance for the four white balance modes. The available range for each of these settings is 28 to 227. The reason for this range is unclear. Their value is not linked to the locked, but visible, RGB settings for each mode in the regular OSD: if you change one of the values in the Factory OSD the corresponding value in the regular OSD won’t change. But there is a relationship between their set value in the Factory OSD and the value displayed in the regular OSD:
This results in:
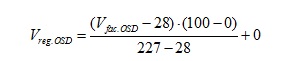
Like the gain and offset settings, these settings
are identical on every sample of this model.
Spread
spectrum
The LVDS spread spectrum clocking settings are used to reduce the EMI emission of the display, while at the same making it less susceptible to EMI emitted by other devices, by widening the bandwidth of the LVDS connection between the controller and the panel electronics. While this reduces the EMI emission at any one frequency, the total radiated energy remains the same. So while narrowband EMI sensitive devices may experience much less interference because of spread spectrum clocking, the situation for broadband EMI sensitive devices remains unchanged. The “Freq” parameter sets the amount of spreading. The standard clock specified for the LTM270DL06 panel is 60.38 MHz and the maximum without spread spectrum is 65.63 MHz. So with spread spectrum the clock would be for instance 60.38 ± 3 MHz. The “Amp” parameter can be used to reduce the amplitude of the signal, therefore reducing the total radiated power.
DFM
Turning this on activates the Design For Manufacture mode. In this mode the AOC-logo at power on will not be shown and the display will go into power safe mode more quickly. This setting is locked by default.
BurnIn
Turning this on activates the built-in burn-in mode of the display: when there is no input source connected the display will automatically alternate between completely black, white, red, green and blue screens every second.
Erase
EEPROM
This function resets all OSD and Factory OSD settings to default. It does not actually erase any of the four EEPROM’s discussed at Electronics. It lets the controller read the back-up values for OSD and Factory OSD from the 24C32WP EEPROM and then write them back to the positions of the corresponding current values on that same EEPROM. Trying to use this function will result in the word “Fail” appearing next to Erase EEPROM. There is probably an additional sequence required to unlock the Gain / Offset, the DFM and the Erase EEPROM functions.
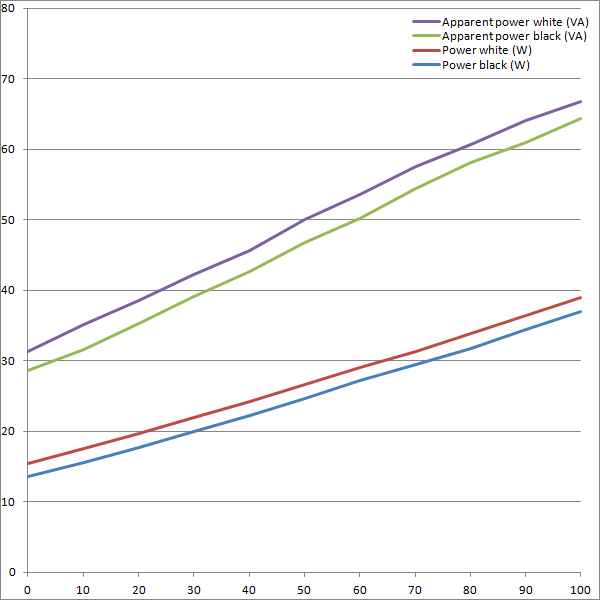
In terms of power consumption the manufacturer lists 45.0W maximum usage, 18.0 "typical" usage and less than 0.5W in standby. We carried out our normal tests to establish its power consumption ourselves.
|
|
|

|
Brightness setting |
Test pattern |
Power (W) |
Apparent power (VA) |
Power factor (cos φ) |
|
0 |
Black |
13.6 |
28.6 |
0.47 |
|
White |
15.4 |
31.3 |
0.49 |
|
|
10 |
Black |
15.6 |
31.6 |
0.49 |
|
White |
17.6 |
35.1 |
0.50 |
|
|
20 |
Black |
17.7 |
35.3 |
0.50 |
|
White |
19.7 |
38.6 |
0.51 |
|
|
30 |
Black |
20.0 |
39.1 |
0.51 |
|
White |
22.0 |
42.3 |
0.52 |
|
|
40 |
Black |
22.3 |
42.7 |
0.52 |
|
White |
24.2 |
45.6 |
0.53 |
|
|
50 |
Black |
24.7 |
46.7 |
0.53 |
|
White |
26.7 |
50.0 |
0.53 |
|
|
60 |
Black |
27.2 |
50.2 |
0.53 |
|
White |
29.0 |
53.6 |
0.54 |
|
|
70 |
Black |
29.5 |
54.4 |
0.54 |
|
White |
31.3 |
57.6 |
0.54 |
|
|
80 |
Black |
31.8 |
58.1 |
0.55 |
|
White |
33.8 |
60.7 |
0.55 |
|
|
90 (factory default) |
Black |
34.4 |
60.9 |
0.57 |
|
White |
36.4 |
64.1 |
0.57 |
|
|
100 |
Black |
37.0 |
64.4 |
0.57 |
|
White |
38.9 |
66.7 |
0.58 |
|
|
|
||||
|
Calibrated to 120 cd/m² |
Black |
17.9 |
34.6 |
0.51 |
|
White |
19.8 |
37.2 |
0.53 |
|
|
|
||||
|
Off |
0.2 |
7.6 |
0.03 |
|
|
Stand-by |
0.4 |
8.0 |
0.05 |
|
|
Maximum |
48.5 |
79.5 |
0.61 |
|
|
|
||||
|
Average increase in power consumption per brightness setting |
0.235 W |
|||
|
Average increase in power consumption per cd/m² of white |
0.113 W |
|||
The EcoModes on the q2770Pqu were not all tested separately, because all they do is change the brightness setting. Therefore there is no difference with setting the brightness to the same value in the Standard mode.
|
EcoMode |
Brightness setting |
Brightness locked |
|
Standard (default mode) |
90 (default value) |
No |
|
Text |
20 |
Yes |
|
Internet |
40 |
Yes |
|
Game |
60 |
Yes |
|
Movie |
80 |
Yes |
|
Sports |
100 |
Yes |
The q2770Pqu is extremely energy efficient, using about 19 W on average when calibrated to 120 cd/m². This is actually less than what a Dell UltraSharp U2412M uses at that brightness and about the same as what a U2312HM uses. Not bad considering the q2770Pqu offers a 77.78% larger desktop area and a 37.35% larger display area. Even at the highest brightness setting it still only uses 38 W on average. The highest measured peak in power consumption was 48.5 W with the brightness on the highest setting, displaying a completely white screen, all USB-ports in use and the built-in speakers blasting at full volume (actually pushing them past clipping).
Apart from the q2770Pqu being energy efficient the results of this test also clearly show that the q2770Pqu does not have a power supply with power factor correction. This is usually the case with computer hardware with a power consumption of less than 75 W, as it is not mandatory for those. The result is that the power factor is quite low, because of a leading current caused by the smoothing capacitors in the power supply. The reason the power factor increases at higher brightness settings is that under higher loads the capacitor will have a higher duty cycle. But the low power factor is nothing to get too excited about as a consumer; your energy bill won’t be higher because of it.
energy consumption
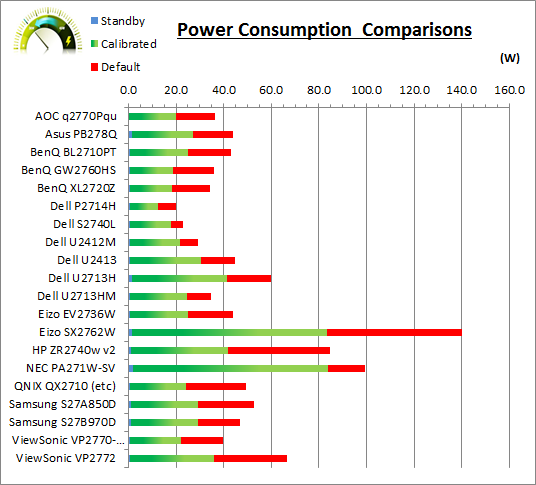
energy consumption comparison graph
Activation time
Although not the most interesting field of performance, it might still be relevant to some, as it can be quite a nuisance if it takes the display very long to produce an image on screen when you turn it on. The switch on time is measured from the moment you press the power button on the display to the moment you get an image on screen. Going in stand-by is measured from the moment the screen turns black to the moment the LED in the power button turns orange, which is when the monitor actually enters the stand-by mode, as could be verified by the energy monitor the display is plugged in to. Getting out of stand-by is measured from the moment you move the mouse to moment you get an image on screen. All measurements are in seconds and were performed on native resolution and frequency: 2560x1440 @ 60 Hz.
|
Display input interface |
Switch on |
Going in stand-by |
Getting out stand-by |
|
DisplayPort |
6.9 |
15.9 |
20.4 |
|
HDMI |
6.1 |
20.3 |
3.7 |
|
DVI-D (DL) |
6.2 |
12.5 |
3.2 |
|
VGA |
5.4 |
11.3 |
2.6 |
The results show that it the q2770Pqu around 6 second to switch on. Not particularly fast, but not extremely slow either. How long it takes for the display to go in stand-by varies greatly from one input to the other, with VGA being almost twice as fast as HDMI.
Getting out of stand-by takes the display around 3
seconds, with the exception of DisplayPort. When the screen enters stand-by the
connection between the graphics card and display is lost (probably to save
power). With DisplayPort it had trouble re-establishing that connection and once
you get an image on screen you’ll get a message that there was a link failure.
Apparently this has to do with pin 20 being connected in the DisplayPort cable.
To avoid this problem either use a cable with pin 20 not connected or turn the
display off instead of using the stand-by mode.
Switching Input Interface
The time it takes to switch from one input to
another has also been measured. DVI to VGA and vice versa have not been tested,
because the graphics card has one DVI-D single link and one DVI-I dual link
port, therefore a native output on both connections simultaneously was not
possible.
|
Display input interface |
End |
||||
|
DisplayPort |
HDMI |
DVI-D (DL) |
VGA |
||
|
Start |
DisplayPort |
- |
3.1 |
3.2 |
2.2 |
|
HDMI |
2.9 |
- |
3.3 |
2.0 |
|
|
DVI-D (DL) |
3.0 |
3.5 |
- |
- |
|
|
VGA |
3.0 |
3.3 |
- |
- |
|
|
Panel Manufacturer |
Samsung |
Colour Palette |
16.78 million |
|
Panel Technology |
PLS |
Colour Depth |
8-bit |
|
Panel Module |
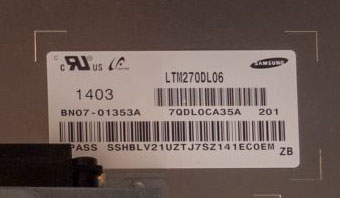
LTM270DL06 |
Colour space |
Standard gamut / sRGB |
|
Backlighting Type |
W-LED |
Colour space coverage (%) |
~79.6% NTSC, 100% sRGB, ~79.2% Adobe RGB |
Panel Part and Colour Depth
The AOC q2770Pqu utilises a Samsung LTM270DL06 PLS (Plane to Line Switching) panel which is capable of producing 16.78 million colours. This is achieved through a true 8-bit colour depth as opposed to Frame Rate Control (FRC) being needed.
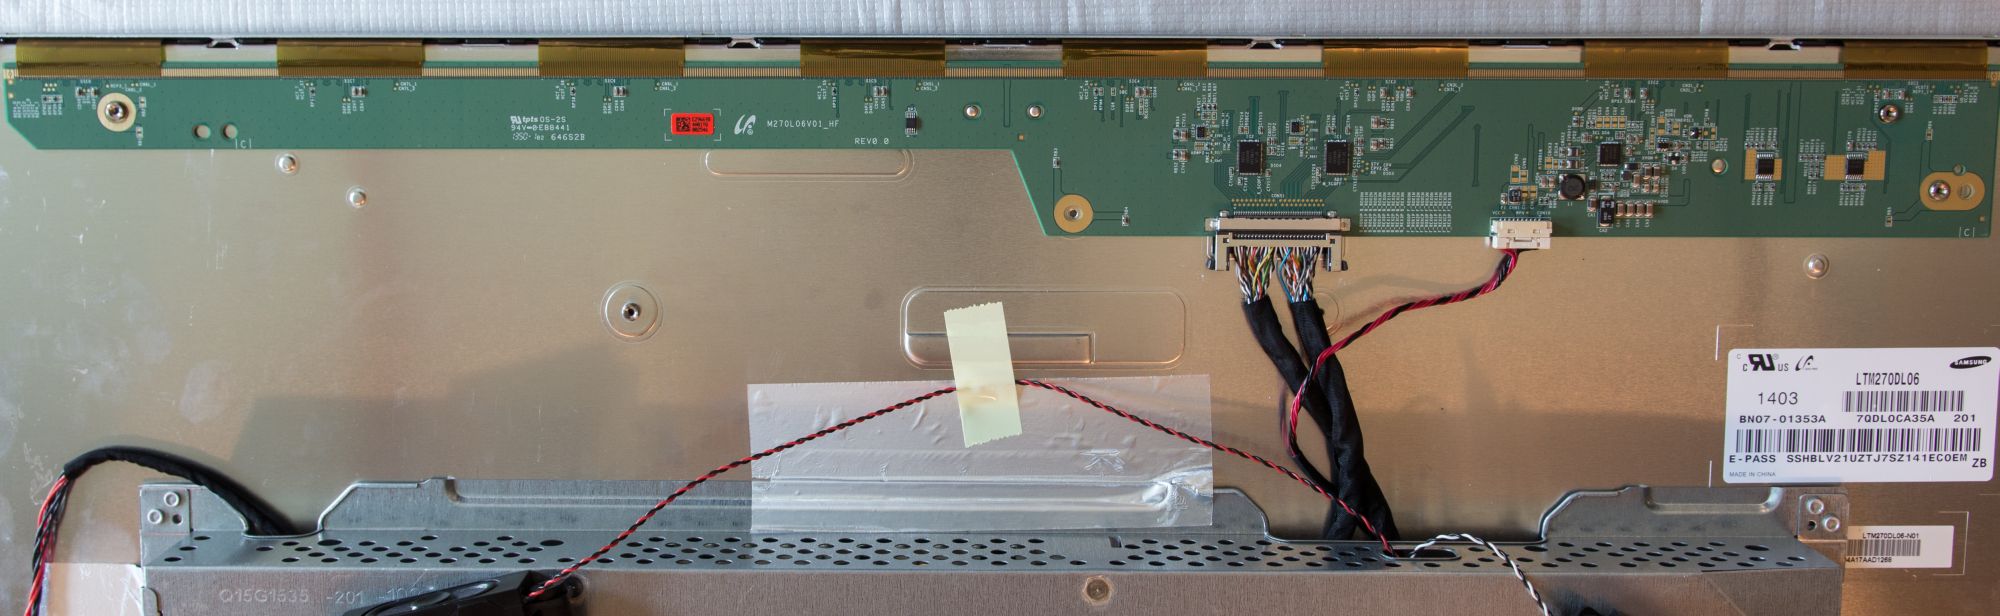
The panel is confirmed when dismantling the screen as shown:
Display Electronics
To verify what panel was used in the q2770Pqu the bezels and rear case were removed. Because the display did not have any backlight on hours on arrival the glue of the foil tape connecting the electronics chassis to the panel assembly (top picture below) wasn’t heated yet and therefore the tape could easily be removed without tearing it. Because of this it took little effort to take a look at the display electronics.
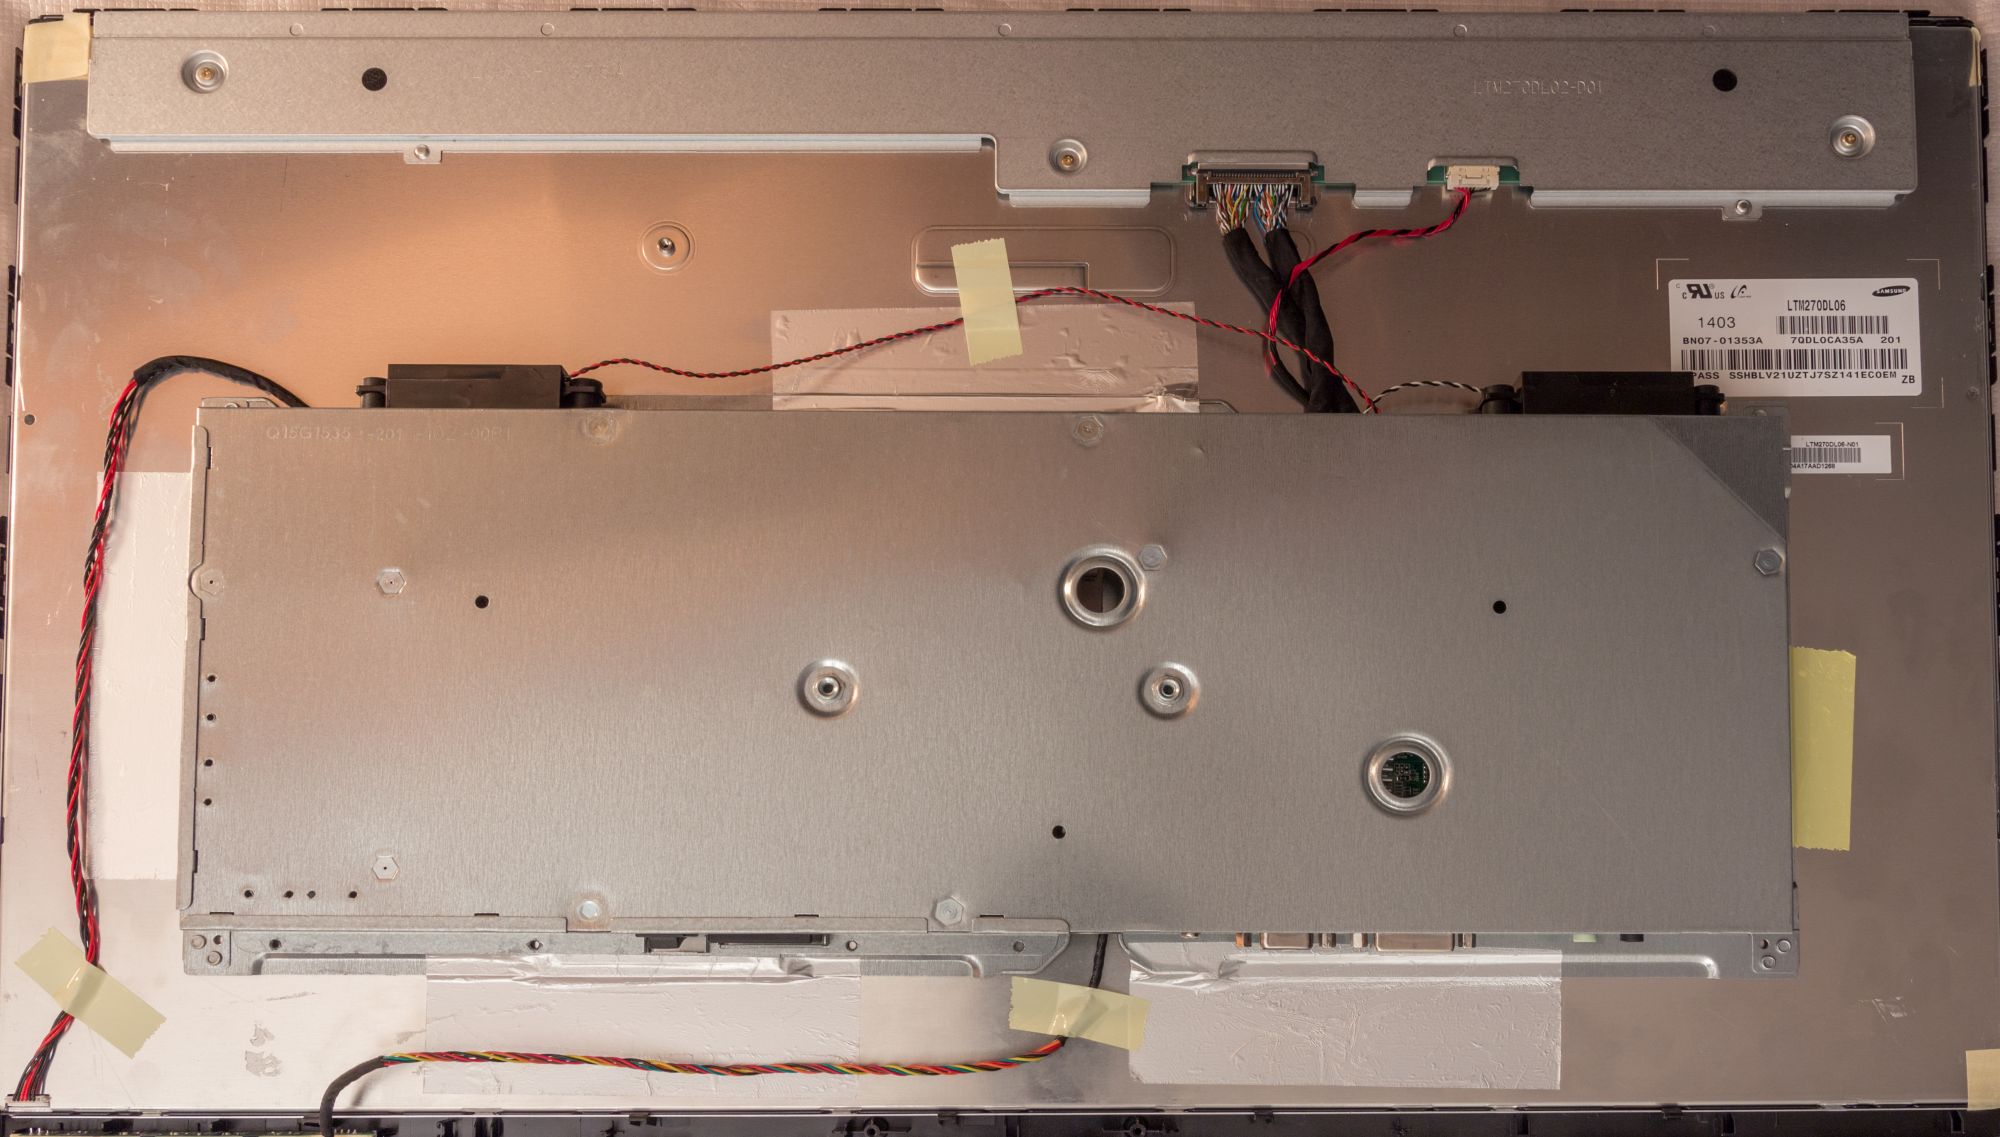
panel assembly and display electronics chassis. Click for larger version
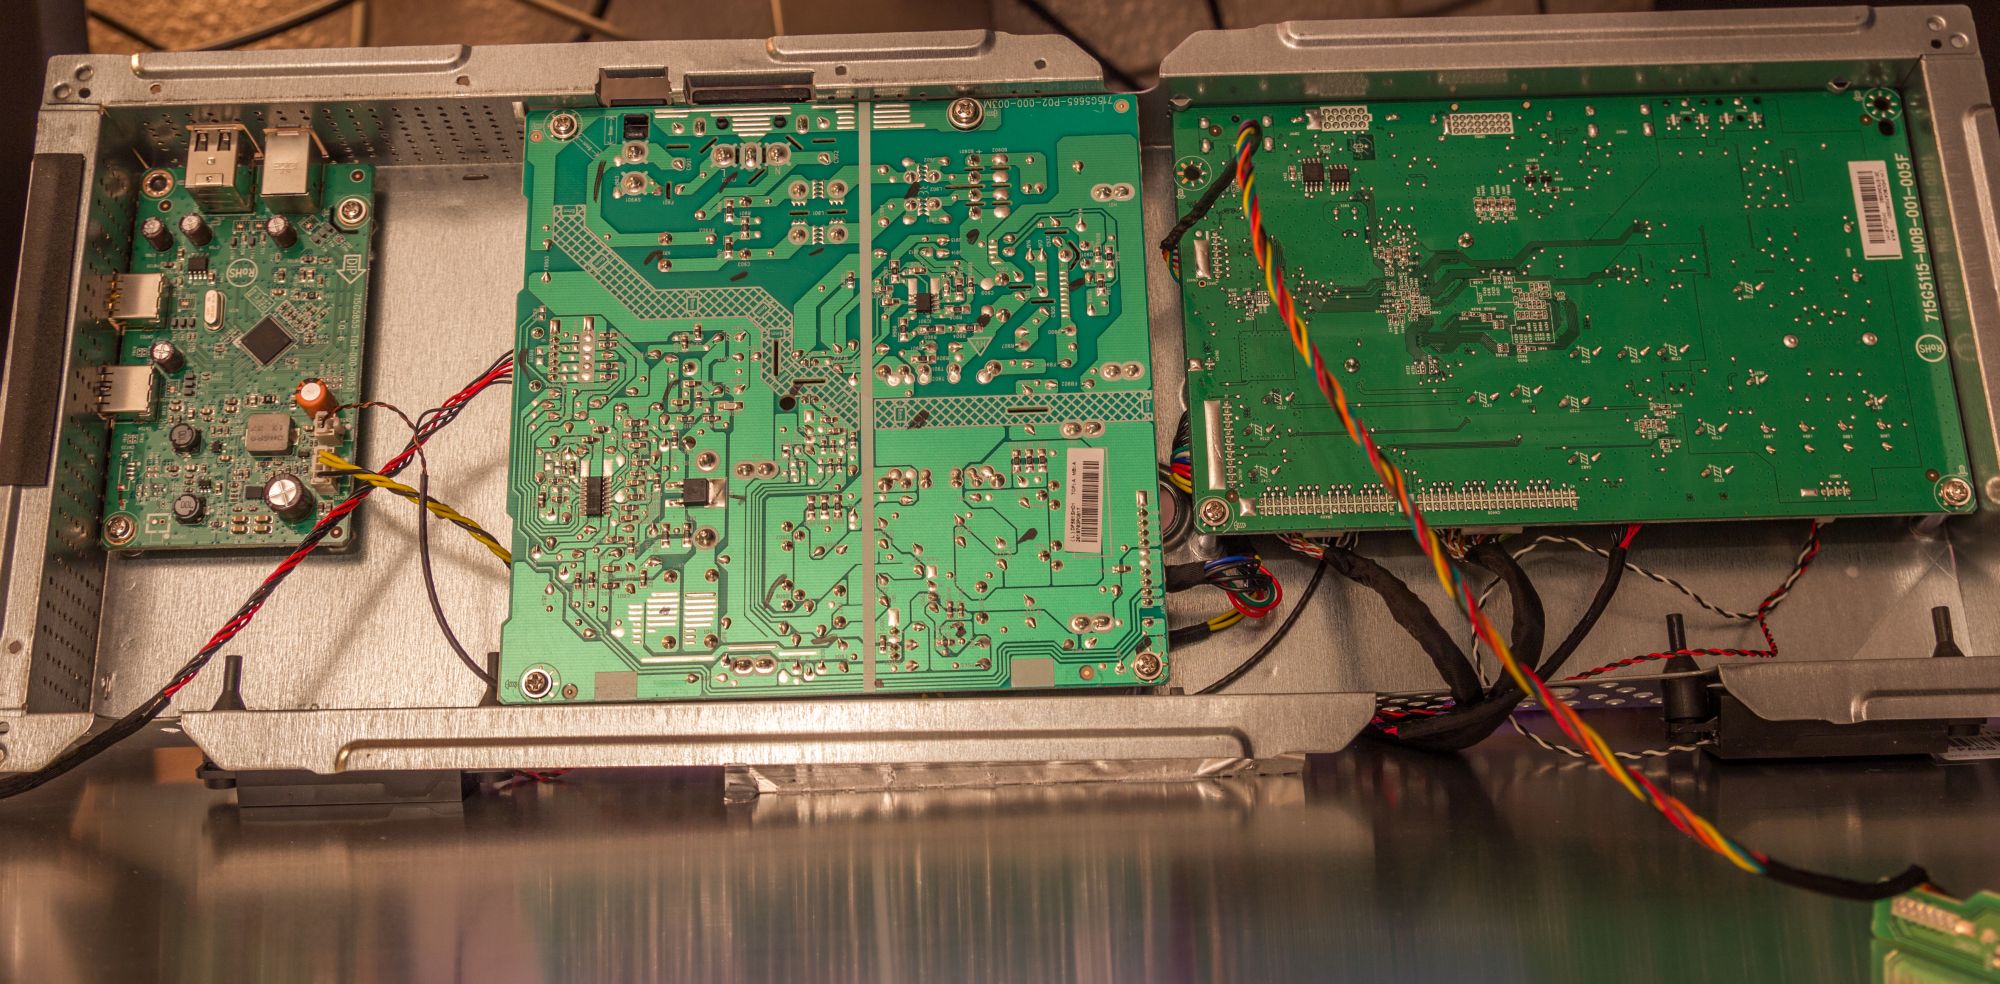
circuit boards from lefts to right: USB hub - power circuit - main circuit board
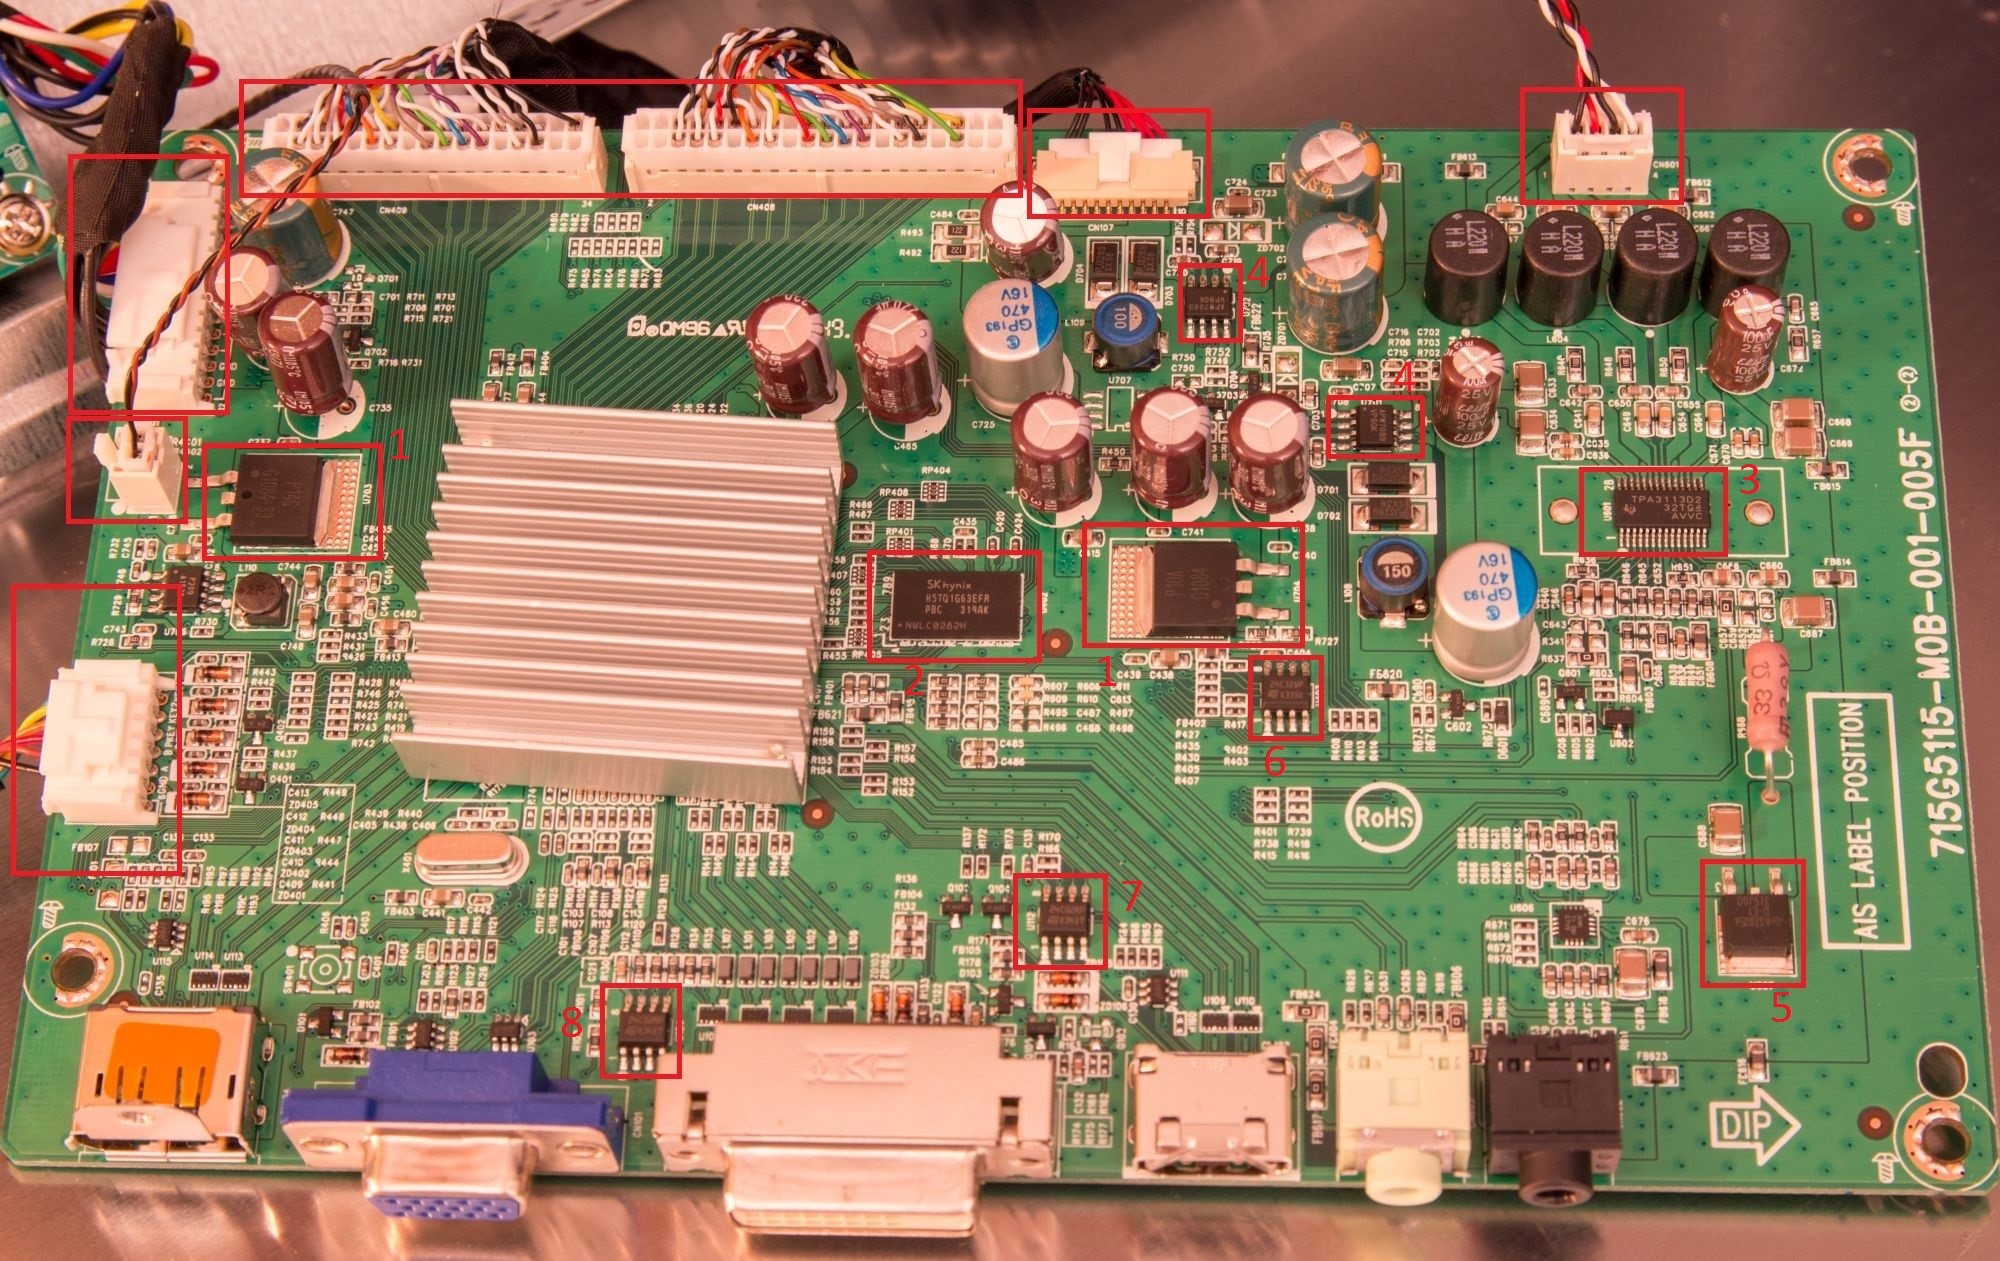
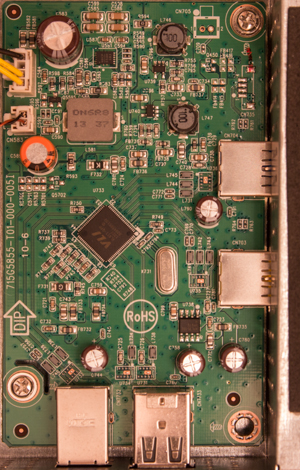
main circuit board
Once to the electronics were revealed all the connectors on the main circuit board could easily be identified, as well as most of the integrated circuits.
Connectors
Starting middle left in clockwise direction
· OSD controls
· USB
· Power
· LVDS Pair #1 and #2 to panel electronics
· Power to panel electronics
· Speakers
Integrated circuits
1. GMT G1084-33
· 3.3V 5A Low-Dropout Linear Regulator
2. SKhynix H5TQ1G63EFR
· 1Gb (128 MB) DDR3 RAM
· 64M x 16 configuration
· Normal power consumption
· DDR3-1600 11-11-11 clock speed and timings
· Used by the controller for the frame/line buffer
3. Texas Instruments TPA3113D2
· 6W/channel stereo class-D power amplifier
· Drives the built-in speakers
4. Anpec APW7089
· 4A 26V 380kHz Asynchronous Step-Down Converter
5. Diodes Incorporated AS7805A
· 1A 3-Terminal Positive Voltage Regulator
6. Atmel 24C32WP
· 32Kb 2-Wire Serial EEPROM
· Used for:
o DP EDID
o Factory OSD current values
o Factory OSD factory defaults back-up
o Regular OSD current values
o Regular OSD factory defaults back-up
7. Atmel 24C02WP
· 2Kb 2-Wire Serial EEPROM
· Used for HDMI EDID
8. Atmel 24C02WP
· 2Kb 2-Wire Serial EEPROM
· Used for DVI-D EDID
9. Atmel 24C02WP (the smaller one of the two IC’s in the top left corner on main PCB in the second photo above)
· 2Kb 2-Wire Serial EEPROM
· Used for VGA EDID
Panel Electronics
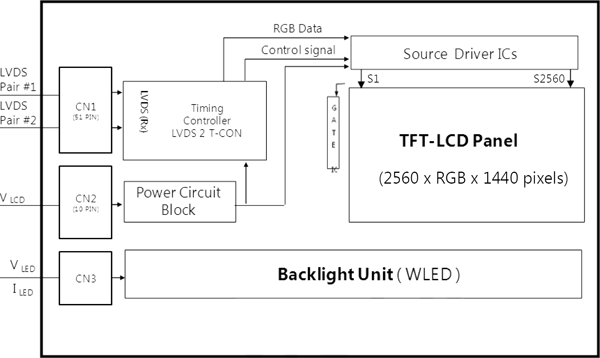
block diagram of the panel electronics
panel electronics
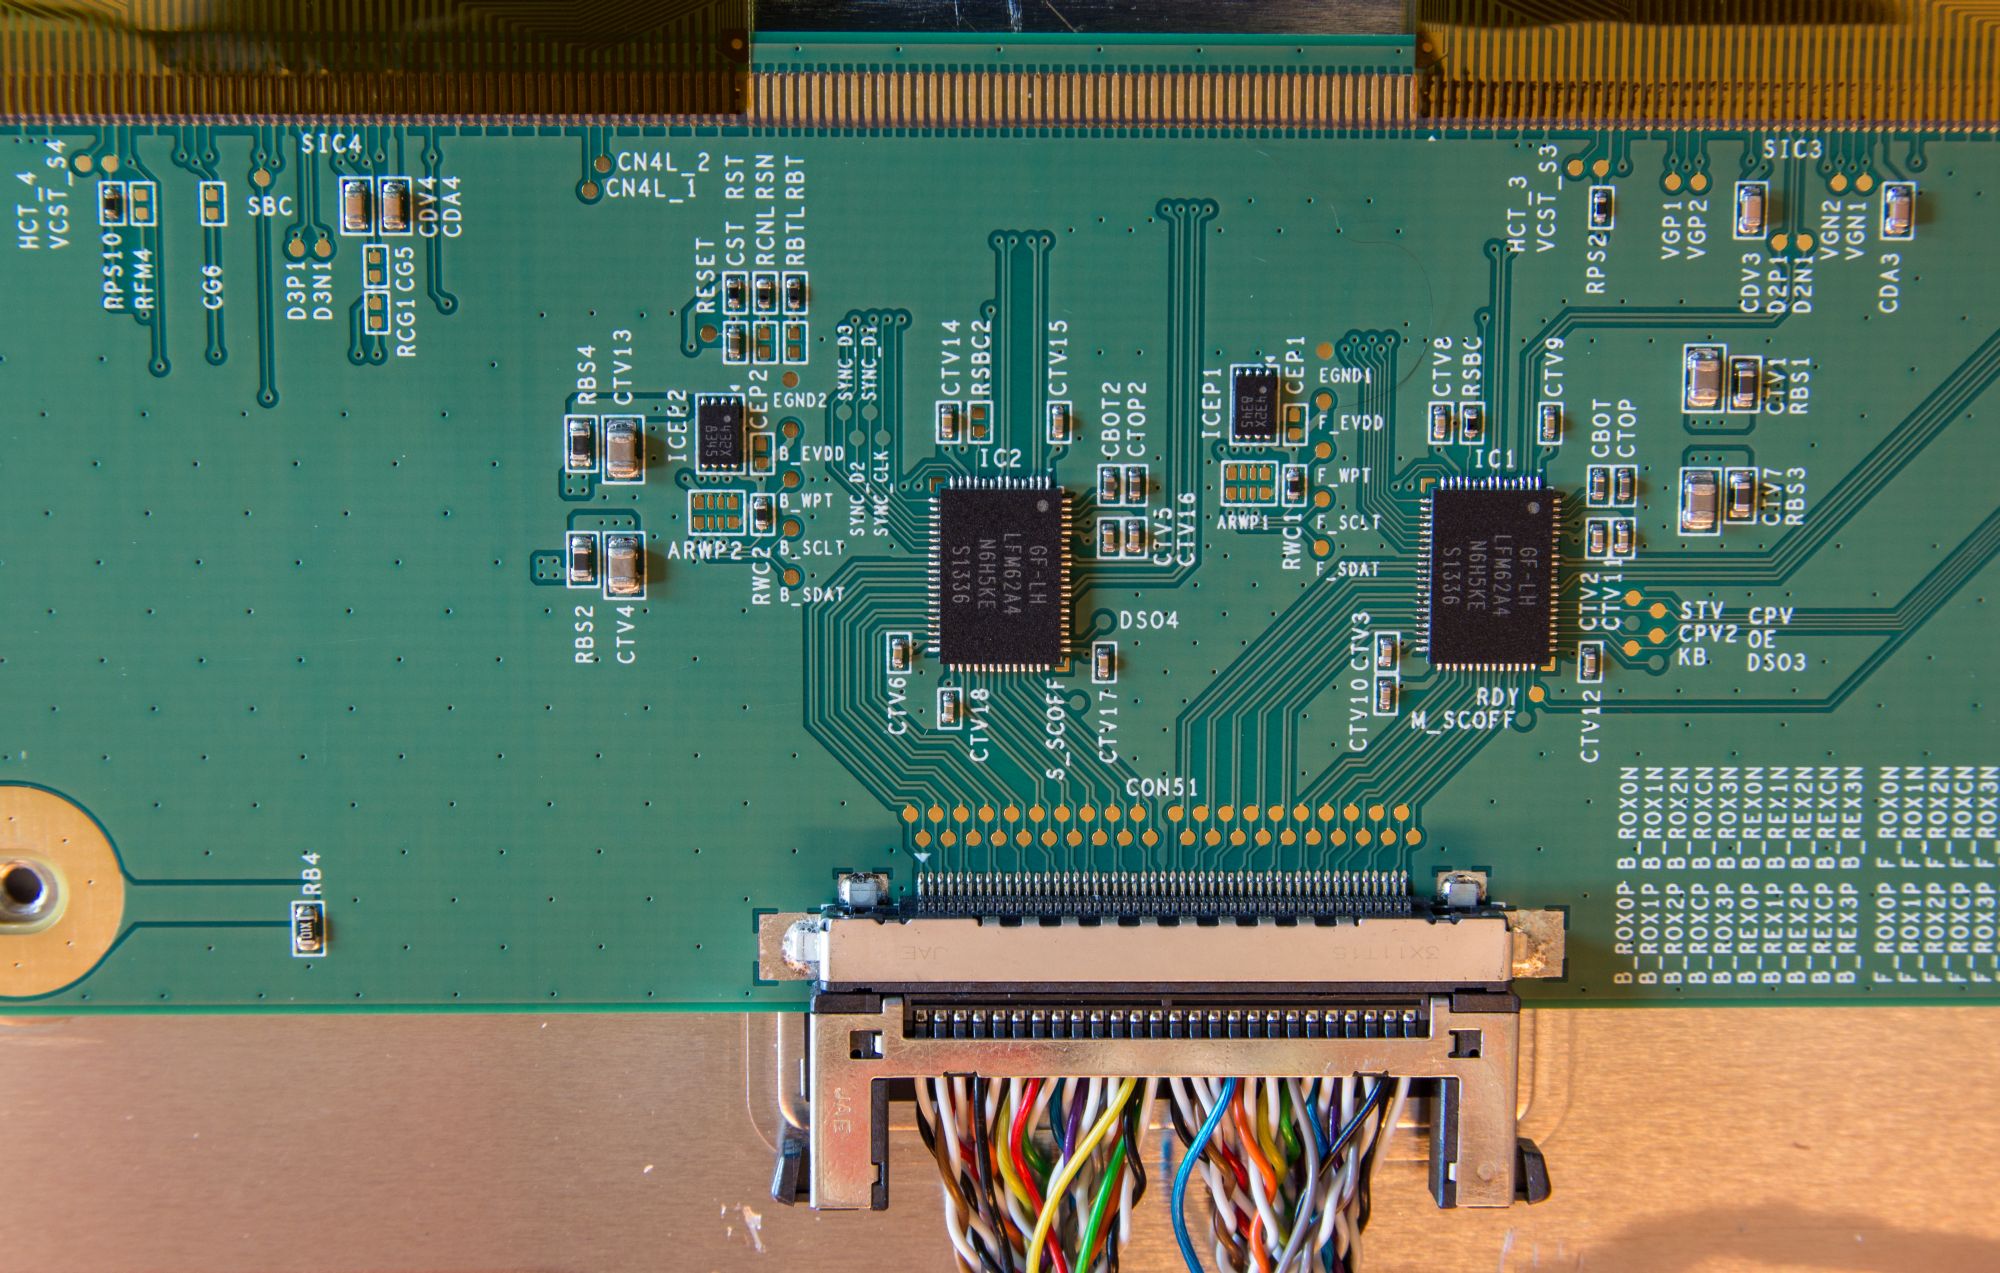
LVDS Pair #1 and #2 from main circuit board, together with the timing
controllers
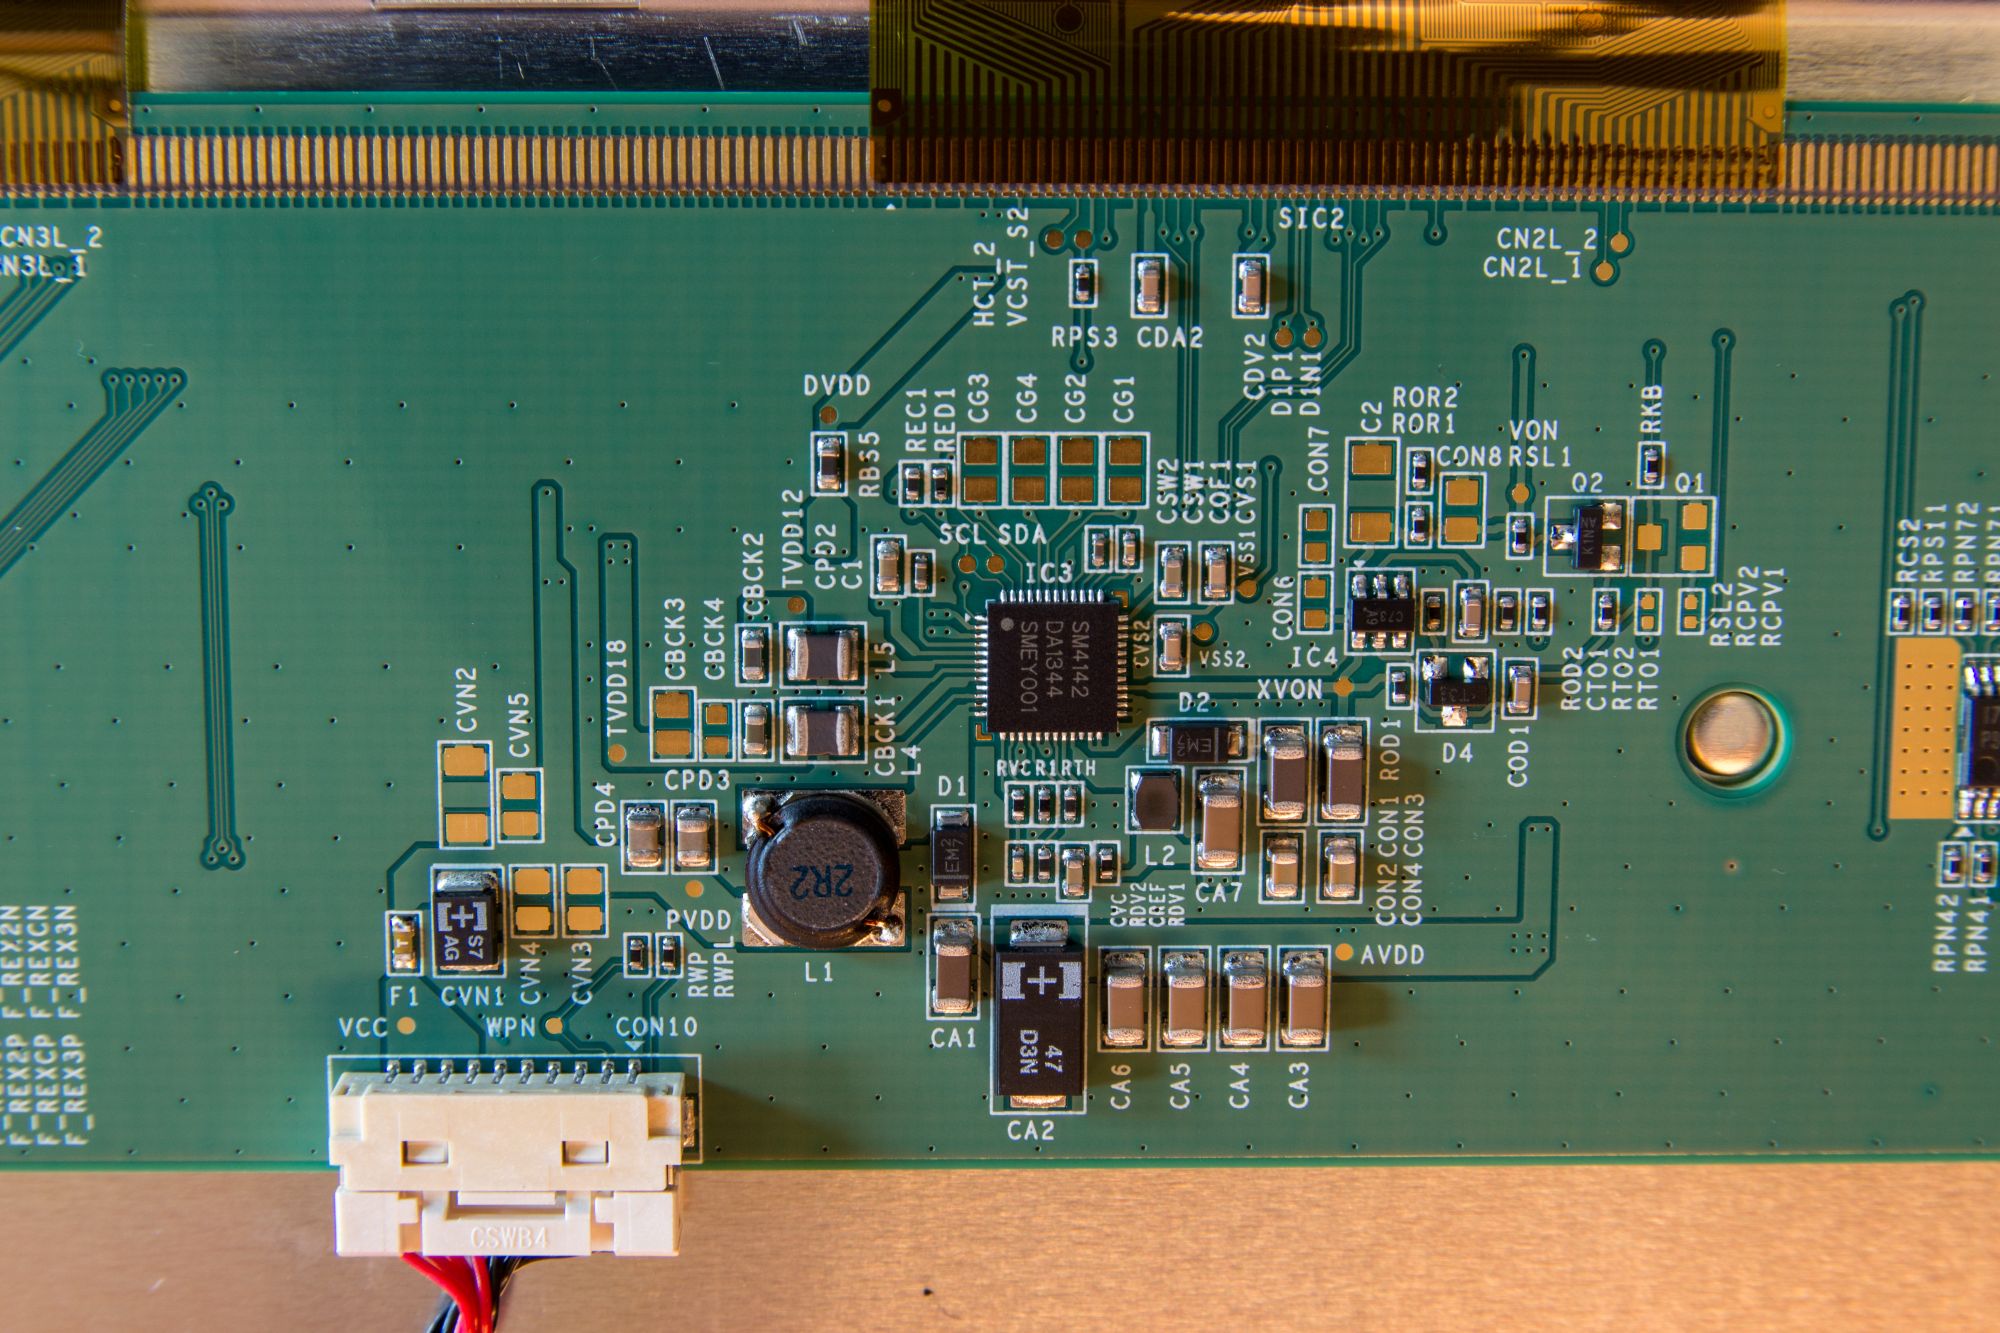
power from main circuit board, together with the panel electronics power
circuit

These IC’s
probably are the Source Driver IC’s
EDID
The EDID (Extended Display Identification Data) is a piece of information that tells the graphics card what display modes it supports amongst some other specifications. The EDID varies slightly per input interface. The DisplayPort EDID is displayed below.
|
Monitor Model name............... Q2770 Manufacturer............. AOC Plug and Play ID......... AOC2770 Serial number............ n/a Manufacture date......... 2014, ISO week 4 Filter driver............ None ------------------------- EDID revision............ 1.4 Input signal type........ Digital (DisplayPort) Color bit depth.......... 8 bits per primary color Color encoding formats... RGB 4:4:4, YCrCb 4:4:4, YCrCb 4:2:2 Screen size.............. 600 x 340 mm (27,2 in) Power management......... Active off/sleep Extension blocs.......... 1 (CEA-EXT) ------------------------- DDC/CI................... Supported MCCS revison............. 2.1 Display technology....... TFT Controller............... Mstar 0x1600 Firmware revision........ 0.4 Active power on time..... Not supported Power consumption........ Not supported Current frequency........ 88,90kHz, 60,03Hz
Color characteristics Default color space...... Non-sRGB Display gamma............ 2,20 Red chromaticity......... Rx 0,660 - Ry 0,330 Green chromaticity....... Gx 0,310 - Gy 0,630 Blue chromaticity........ Bx 0,150 - By 0,040 White point (default).... Wx 0,313 - Wy 0,329 Additional descriptors... None
Timing characteristics Range limits............. Not available GTF standard............. Not supported Additional descriptors... None Preferred timing......... Yes Native/preferred timing.. 2560x1440p at 60Hz (16:9) Modeline............... "2560x1440" 241,500 2560 2608 2640 2720 1440 1443 1448 1481 +hsync +vsync
Standard timings supported 640 x480p at60Hz - IBM VGA 640 x480p at72Hz - VESA 640 x480p at75Hz - VESA 800 x600p at56Hz - VESA 800 x600p at60Hz - VESA 800 x600p at72Hz - VESA 800 x600p at75Hz - VESA 1024 x768p at60Hz - VESA 1024 x768p at70Hz - VESA 1024 x768p at75Hz - VESA 1280 x 1024p at75Hz - VESA 1920 x 1080p at60Hz - VESA STD 1680 x 1050p at60Hz - VESA STD 1440 x900p at60Hz - VESA STD 1280 x 1024p at60Hz - VESA STD 1280 x960p at60Hz - VESA STD 1280 x720p at60Hz - VESA STD
EIA/CEA-861 Information Revision number.......... 3 IT underscan............. Supported Basic audio.............. Supported YCbCr 4:4:4.............. Supported YCbCr 4:2:2.............. Supported Native formats........... 1 Detailed timing #1....... 1920x1080p at 60Hz (16:9) Modeline............... "1920x1080" 148,500 1920 2008 2052 2200 1080 1084 1089 1125 +hsync +vsync Detailed timing #2....... 1280x720p at 60Hz (16:9) Modeline............... "1280x720" 74,250 1280 1390 1430 1650 720 725 730 750 +hsync +vsync Detailed timing #3....... 720x480p at 60Hz (16:9) Modeline............... "720x480" 27,000 720 736 798 858 480 489 495 525 -hsync -vsync Detailed timing #4....... 720x576p at 50Hz (16:9) Modeline............... "720x576" 27,000 720 732 796 864 576 581 586 625 -hsync -vsync
CE video identifiers (VICs) - timing/formats supported 640 x480p at60Hz - Default (4:3, 1:1) 720 x480p at60Hz - EDTV (16:9, 32:27) 1920 x 1080i at60Hz - HDTV (16:9, 1:1) 1920 x 1080i at50Hz - HDTV (16:9, 1:1) 1280 x720p at60Hz - HDTV (16:9, 1:1) 1280 x720p at50Hz - HDTV (16:9, 1:1) 1920 x 1080p at50Hz - HDTV (16:9, 1:1) 720 x576p at50Hz - EDTV (16:9, 64:45) 720 x480p at60Hz - EDTV (4:3, 8:9) 720 x576p at50Hz - EDTV (4:3, 16:15) 1920 x 1080p at60Hz - HDTV (16:9, 1:1) [Native] NB: NTSC refresh rate = (Hz*1000)/1001
CE audio data (formats supported) LPCM2-channel, 16/20/24 bit depths at 32/44/48 kHz
CE speaker allocation data Channel configuration.... 2.0 Front left/right......... Yes Front LFE................ No Front center............. No Rear left/right.......... No Rear center.............. No Front left/right center.. No Rear left/right center... No Rear LFE................. No
CE vendor specific data (VSDB) IEEE registration number. 0x000C03 CEC physical address..... 1.0.0.0 Maximum TMDS clock....... 165MHz
Report information Date generated........... 17-6-2014 Software revision........ 2.90.0.1000 Data source.............. Real-time 0x1300 Operating system......... 6.1.7601.2.Service Pack 1
Raw data 00,FF,FF,FF,FF,FF,FF,00,05,E3,70,27,00,00,00,00,04,18,01,04,A5,3C,22,78,3A,25,95,A9,54,4F,A1,26, 0A,50,54,2F,CF,00,D1,C0,B3,00,95,00,81,80,81,40,81,C0,01,01,01,01,56,5E,00,A0,A0,A0,29,50,30,20, 35,00,80,68,21,00,00,1E,00,00,00,FC,00,51,32,37,37,30,0A,20,20,20,20,20,20,20,00,00,00,10,00,00, 00,00,00,00,00,00,00,00,00,00,00,00,00,00,00,10,00,00,00,00,00,00,00,00,00,00,00,00,00,00,01,77, 02,03,1E,F1,4B,01,03,05,14,04,13,1F,12,02,11,90,23,09,07,07,83,01,00,00,65,03,0C,00,10,00,02,3A, 80,18,71,38,2D,40,58,2C,45,00,55,50,21,00,00,1E,01,1D,00,72,51,D0,1E,20,6E,28,55,00,55,50,21,00, 00,1E,8C,0A,D0,8A,20,E0,2D,10,10,3E,96,00,55,50,21,00,00,18,8C,0A,D0,90,20,40,31,20,0C,40,55,00,
55,50,21,00,00,18,00,00,00,00,00,00,00,00,00,00,00,00,00,00,00,00,00,00,00,00,00,00,00,00,00,ED |
Screen
Coating
The screen coating on the q2770Pqu is a light, semi-glossy anti-glare (AG) offering. It retains its anti-glare properties to avoid too many unwanted reflections of a full glossy coating, but does not produce an overly grainy or dirty image that some thicker AG coatings can. There were no cross-hatching patterns visible on the coating.
Backlight Type and Colour Gamut
The screen uses a White-LED (W-LED) backlight unit which has become very popular in today's market. This helps reduce power consumption compared with older CCFL backlight units and brings about some environmental benefits as well. The W-LED unit offers a standard colour gamut which is approximately equal to the sRGB colour space. Studying the detailed panel spec sheet for DL06 panel we know that the backlight offers a 79.6% NTSC, 100.0% sRGB and 79.2% Adobe RGB coverage. Anyone wanting to work with wider colour spaces would need to consider wide gamut CCFL screens, or the newer range of GB-r-LED displays available now. If you want to read more about colour spaces and gamut then please have a read of our detailed article.
Backlight
Dimming and Flicker
We tested the screen to establish the methods used to control backlight dimming. Our in depth article talks in more details about a common method used for this which is called Pulse Width Modulation (PWM). This in itself gives cause for concern to some users who have experienced eye strain, headaches and other symptoms as a result of the flickering backlight caused by this technology. We used a camera method as described in that article. This allows us to identify:
1) Whether PWM is being used to control the
backlight
2) The frequency and other characteristics at which this operates, if it is used
3) Whether a flicker may be introduced or potentially noticeable at certain
settings
If PWM is used for backlight dimming, the higher the frequency, the less likely you are to see artefacts and flicker. The duty cycle (the time for which the backlight is on) is also important and the shorter the duty cycle, the more potential there is that you may see flicker. The other factor which can influence flicker is the amplitude of the PWM, measuring the difference in brightness output between the 'on' and 'off' states. Please remember that not every user would notice a flicker from a backlight using PWM, but it is something to be wary of. It is also a hard thing to quantify as it is very subjective when talking about whether a user may or may not experience the side effects.
The AOC q2770Pqu uses a Direct Current (DC) method for backlight dimming and does not use PWM at all. It can therefore be classified as flicker free.
|
Pulse Width Modulation Used |
No |
|
Cycling Frequency |
n/a |
|
Possible Flicker at |
|
|
100% Brightness |
No |
|
50% Brightness |
No |
|
20% Brightness |
No |
|
0% Brightness |
No |
For an up to date list of all flicker-free (PWM free) monitors please see our Flicker Free Monitor Database.
![]()
Contrast
Stability and Brightness
We wanted to see how much variance there was in the screens contrast as we adjusted the monitor setting for brightness. In theory, brightness and contrast are two independent parameters, and good contrast is a requirement regardless of the brightness adjustment. Unfortunately, such is not always the case in practice. We recorded the screens luminance and black depth at various OSD brightness settings, and calculated the contrast ratio from there. Graphics card settings were left at default with no ICC profile or calibration active.
With sequential contrast black and white are not reproduced simultaneously, but one after the other, hence sequential. First you measure the brightness of a completely white screen followed by a measurement of a completely black screen. The contrast ratio is then calculated by the dividing the result of the white measurement by the result of the black measurement, as is always the case with contrast ratios. Static contrast ratio refers to sequential contrast with a constant backlight brightness, dynamic contrast ratio refers to sequential contrast with a varying backlight brightness (higher for white than for black).
AOC specifies a typical static contrast ratio of 1000:1. Samsung specifies the same typical static contrast ratio for the LTM270DL06 panel, with a minimum of 600:1. Both specify a typical brightness of white of 300 cd/m², with a minimum of 250 cd/m² specified by Samsung for this panel. AOC also specifies a dynamic contrast ratio of 80M:1, but one should not attach much value to numbers like these.
|
OSD Brightness |
Luminance |
Black Point (cd/m2) |
Contrast Ratio |
|
0 |
69.79 |
0.0763 |
914.8 |
|
5 |
81.77 |
0.0885 |
923.5 |
|
10 |
93.52 |
0.1013 |
923.0 |
|
15 |
105.1 |
0.1137 |
924.3 |
|
20 |
116.5 |
0.1260 |
924.8 |
|
25 |
127.7 |
0.1381 |
924.0 |
|
30 |
138.6 |
0.1503 |
922.4 |
|
35 |
149.6 |
0.1619 |
924.1 |
|
40 |
160.2 |
0.1735 |
923.0 |
|
45 |
170.8 |
0.1849 |
923.9 |
|
50 |
182.3 |
0.1973 |
923.8 |
|
55 |
192.4 |
0.2086 |
922.6 |
|
60 |
202.4 |
0.2193 |
923.1 |
|
65 |
212.2 |
0.2301 |
922.1 |
|
70 |
221.9 |
0.2410 |
920.8 |
|
75 |
231.6 |
0.2512 |
921.9 |
|
80 |
241.1 |
0.2617 |
921.4 |
|
85 |
250.3 |
0.2720 |
920.4 |
|
90 |
259.4 |
0.2818 |
920.4 |
|
95 |
268.4 |
0.2917 |
919.9 |
|
100 |
277.3 |
0.3017 |
919.1 |
|
Total Luminance Adjustment Range (cd/m2) |
207.51 |
Brightness OSD setting controls backlight? |
|
|
Total Black Point Adjustment Range (cd/m2) |
0.225 |
||
|
Average Static Contrast Ratio |
922:1 |
PWM Free? |
|
|
Recommended OSD setting for 120 cd/m2 |
22 |
All measurements were performed five times and averaged for increased accuracy. The results show that the q2770Pqu fails to achieve the specified 1000:1 contrast ratio at all brightness settings. Still, the q2770Pqu performs well here, with an average contrast of 922.1 and a calibrated contrast ratio of 906.5. The average increase in brightness per brightness setting point was 2.076 cd/m2 and the black point was 0.00226 cd/m2.
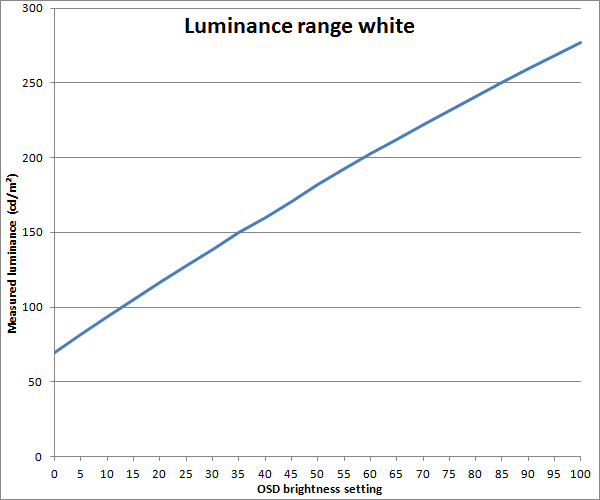
Luminance range of white
As the graph above shows the relation between the measured brightness for white and the brightness setting is almost perfectly linear. Any deviations here might just as well be caused by the i1Display Pro. On average the slope of the graph is 2.076 cd/m² / brightness setting. The brightness of the backlight is regulated through a direct current method. The q2770Pqu does not use PWM at any brightness setting to reduce the brightness.
The q2770Pqu does not achieve the specified 300 cd/m² for white at the highest brightness setting, but this should not be a problem for anyone, because it is far higher than the recommended brightness for most applications. Depending on the ambient lighting conditions a brightness of 100-160 cd/m² is recommended, with 120 cd/m² being the most used.
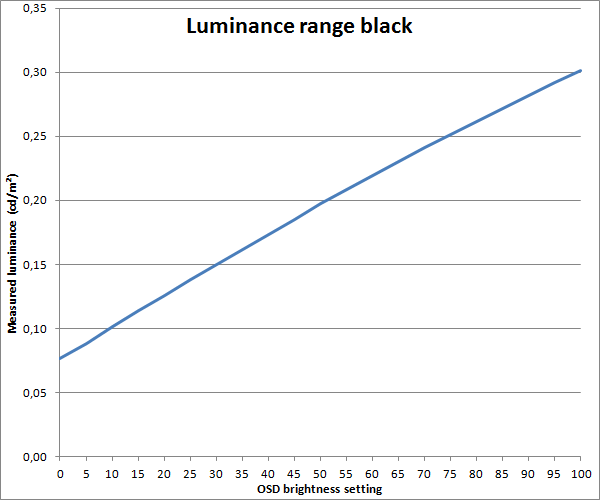
Luminance range of black
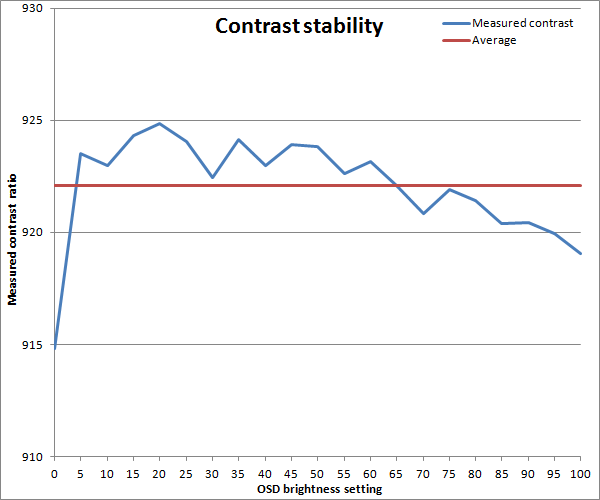
Contrast
stability
The graph above shows that the contrast ratio is
very stable for all brightness settings, with the lowest contrast being only
1.085% lower than the highest.
Simultaneous contrast I: 4x4 ANSI checkerboard
The required checkerboard patterns were created in
Photoshop CS5 Extended and displayed in FastPictureViewer Pro 1.9.
With simultaneous contrast measurements black and white are reproduced simultaneously in a certain pattern. The most common pattern is the ANSI 4x4 checkerboard, which starts with black in the top left corner. The contrast ratio is then determined by dividing the average brightness of the 8 white patches by the average brightness of the 8 black patches.
Simultaneous contrast measurements give a more realistic representation of the perceived contrast with actual content. After all, most people won’t spend their time behind a computer looking at a white or black screen.
|
Average brightness white (cd/m²) |
Average brightness black (cd/m²) |
Contrast |
|
250.0 |
0.2968 |
842.2 |
The resulting contrast is lower than the sequential contrast at the same settings. The difference can be explained by the uniformity of the panel. The contrast hardly drops because of the simultaneous rendering of both black and white.
Calibrated
The same test was also performed after calibration of the display.
|
Average brightness white (cd/m²) |
Average brightness black (cd/m²) |
Contrast |
|
117.1 |
0.1354 |
865.4 |
Simultaneous contrast II: 16x9 checkerboard
To get an even more accurate representation of the
real life contrast a 16x9 checkerboard was measured. Due to the size of the
i1Display Pro the corners could not be measured, therefore 70 white and 70 black
patches were measured.
|
Average brightness white (cd/m²) |
Average brightness black (cd/m²) |
Contrast |
|
248.9 |
0.3011 |
826.8 |
Like with the 4x4 checkerboard the lower contrast ratio is mostly caused by the uniformity of panel.
Default settings of the screen were as follows:
|
Monitor OSD Option |
Default Settings |
|
Brightness |
90 |
|
Contrast |
50 |
|
Gamma |
Gamma1 |
|
Temperature |
Warm |
We went on to test the default setup of the screen in various areas as described in the following sections.
![]()
Support TFTCentral,
buy the AOC q2770Pqu using our affiliate link

Colour Banding
To assess whether the q2770Pqu suffers from
banding 19 gradients were examined in FastPictureViewer Pro 1.9. These were
created in Photoshop CS5 Extended and saved as 16-bit uncompressed TIFF. The
consequence of insufficient colour depth is colour banding:
Two colours that differ enough from one another to
be perceived as two different colours when viewed side-by-side do not differ
enough from one another to be reproduced by the display in question as two
different colours.
Most banding we come across is the result of compression of the source, as is the case with JPEG with high compression. However, displays also cause banding themselves. By definition every display has colour banding, because the number of levels that makes up the gradient is at most equal to the horizontal resolution. To avoid any further banding the number of levels per channel has to higher than or equal to the horizontal resolution. Assuming an even number bit depth per channel that requires 12 bits per channel or higher for all common resolutions up to 4096 pixels wide.
That is however assuming that the gradient covers the full range of levels. A screen wide gradient that only covers a quarter of the range would require four times as many levels per channel. To avoid banding caused by colour depth altogether 16 bits per channel would suffice. With such high colour depth you could reproduce a perfectly fluent screen wide gradient on a cinema 8K (8192x4320) display that covers only one eighth of the range. Perceivable banding is mostly caused by differences in brightness across the gradient. There is only perceivable chromaticity banding with 6 bit colour depth. For chromaticity 8 bits per channel is more than enough for colour gamuts similar to the sRGB colour space. Even for the largest RGB colour spaces (with real primaries) 9 bits colour depth per channel would be more than enough, although that would be rounded up to 10, because odd numbers aren’t used for colour depth. Even when the colour depth does cause more banding than the resolution, gradients may still be perceived as fluent if the colour difference between two adjacent levels is smaller than our eyes can perceive.
To assess whether the q2770Pqu suffers from
banding 19 gradients were examined. The first 7 gradients have constant
chromaticity across the gradient and differ only in brightness. The other 12
gradients vary in both brightness and chromaticity from left to right.
|
Number |
Gradient |
RGB value left |
RGB value right |
∆Y norm L→R |
Banding visible |
|
1 |
Black-white |
[0;0;0] |
[255;255;255] |
1.0000 |
Yes |
|
2 |
Black-red |
[0;0;0] |
[255;0;0] |
0.2208 |
No |
|
3 |
Black-green |
[0;0;0] |
[0;255;0] |
0.7281 |
Yes |
|
4 |
Black-blue |
[0;0;0] |
[0;0;255] |
0.0511 |
No |
|
5 |
Black-yellow |
[0;0;0] |
[255;255;0] |
0.9489 |
Yes |
|
6 |
Black-magenta |
[0;0;0] |
[255;0;255] |
0.2719 |
No |
|
7 |
Black-cyan |
[0;0;0] |
[0;255;255] |
0.7792 |
Yes |
|
8 |
White-red |
[255;255;255] |
[255;0;0] |
-0.7792 |
No |
|
9 |
White-green |
[255;255;255] |
[0;255;0] |
-0.2719 |
No |
|
10 |
White-blue |
[255;255;255] |
[0;0;255] |
-0.9489 |
Yes |
|
11 |
White-yellow |
[255;255;255] |
[255;255;0] |
-0.0511 |
No |
|
12 |
White-magenta |
[255;255;255] |
[255;0;255] |
-0.7281 |
No |
|
13 |
White-cyan |
[255;255;255] |
[0;255;255] |
-0.2208 |
No |
|
14 |
Red-green |
[255;0;0] |
[0;255;0] |
0.5073 |
No |
|
15 |
Red-blue |
[255;0;0] |
[0;0;255] |
-0.1697 |
No |
|
16 |
Green-blue |
[0;255;0] |
[0;0;255] |
-0.6770 |
No |
|
17 |
Yellow-magenta |
[255;255;0] |
[255;0;255] |
-0.6770 |
No |
|
18 |
Yellow-cyan |
[255;255;0] |
[0;255;255] |
-0.1697 |
No |
|
19 |
Magenta-cyan |
[255;0;255] |
[0;255;255] |
0.5073 |
No |
The results show that the 8 bit colour depth is not enough to prevent brightness banding. All gradients that show banding have a high brightness difference from left to right. Differences in chromaticity actually make it harder to see any banding on this display, otherwise gradients 8 and 12 would also have shown banding (16 and 17 probably too). Altogether the display performs here as expected. Nearly all 8 bit displays show banding with gradients 1, 3, 5 and 7. With 8 bits per channel there are only 256 combinations, which means that with a full width gradient each level is at least 10 pixels (or 2.331 mm) wide on a 2560x1440 @ 27” display. With those gradients the colour difference of adjacent levels is large enough for our eyes to see.
With 6 bit colour depth more gradients would show banding and the gradients that already show banding with 8 bit colour depth would show far more conspicuous banding. With 10 bits colour depth there might not be any perceivable banding at all, but I’ve never tested a display with native 10 bit colour depth, so I couldn’t say. If a display shows more banding than expected based on the colour depth, it’s most likely caused by a faulty gamma response. A calibration would probably solve that.
![]()
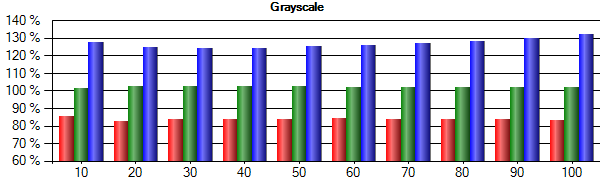
White Balance and Colour Temperatures
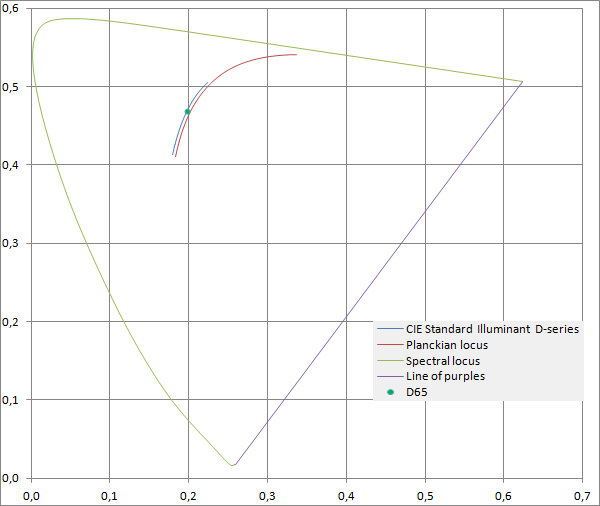
The white balance determines the spectral distribution (proportion of wavelengths in a colour) of all grey levels (colours with equal value for red, green and blue channels). The white balance should be equal for all grey levels; they should only differ in brightness, with that difference based on the gamma value. For displays the white balance is often specified as the Correlated Colour Temperature (CCT) in Kelvin, but this is only a one dimensional system. Around CCT’s of roughly 6500 K it describes the proportion of blue and yellow. But a white point with a constant CCT can still vary along the green-magenta axis. A better way to describe the white point is based on chromaticity.
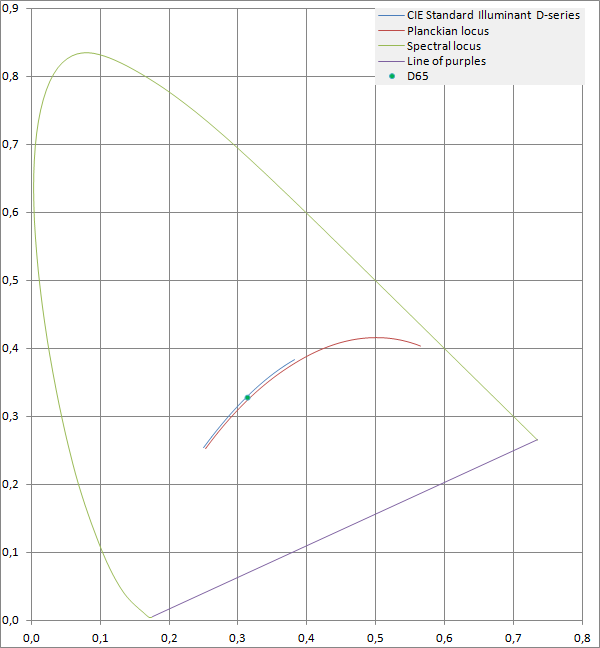
Many common colour spaces, among which are sRGB and Adobe RGB, use CIE Standard Illuminant D65 as white point. D65 is a standardized daylight simulator from the D-series. It’s a simulator, because its spectral distribution differs from the spectral distribution of actual sunlight. The chromaticity coordinates of D65 in the CIE 1931 xy chromaticity diagram are x = 0.31271 and y = 0.32902, the CCT is 6503.6 K. These values are often rounded off to x = 0.313, y = 0.329 and 6500 K. Nearly all display panels, including the LTM270DL06 used in the q2770Pqu, use a white point with chromaticity coordinates equal to D65. However, the display white points are not equal to D65, because they differ in spectral distribution. They are just perceptually equal and therefore metamers.
|
|
|
D65 in CIE 1931 xy chromaticity diagram |
|
|
|
D65 in CIE 1976 u’v’ chromaticity diagram |
White balance modes
The q2770Pqu has four preset white balance that can be selected from the OSD. These cannot be altered from the regular OSD, only in the Factory OSD. The values in the regular OSD are not linked to the values in the Factory OSD: if you change one of the values in the Factory OSD the corresponding value in the regular OSD won’t change, even though the white balance will in fact change. However, the values in the regular OSD are derived from the default values in the Factory OSD using the following formula:
The white balance for all modes is also influenced by the global Gain and Offset settings in the Factory OSD. This probably explains why the white balance in the Warm and sRGB modes, which both have equal RGB-settings, does not correspond with the native white point of the panel. For the ∆E calculations only the chromaticity was considered for all modes. The reason for this is that differences in brightness are not due to variations in white balance, but due to variations in gamma. Including the brightness values would conceal the actual accuracy of the white balance modes, because it would be hard to tell if deviations are caused by the white balance or the gamma. For both the reference and the tested value the theoretical normalized brightness was used of:
![]()
Where the grey level is the fractional value, for instance 10% grey is 0.10, and γ = 2.2. For the chromaticity CIE Standard Illuminant D65 was used as a reference and the tested values are obviously the measured data.
Warm
The Warm setting in the OSD is the factory default
setting for the q2770Pqu. The average CCT in this mode is 6094 K and the white
balance is slightly greener than a D-series illuminant of this CCT would have.
|
|
R |
G |
B |
|
Value per channel in OSD |
49 |
49 |
49 |
|
Value per channel in Factory OSD |
125 |
125 |
125 |
|
Grey level |
x |
y |
CCT (K) |
∆E00 |
∆E94 |
|
10% |
0.3097 |
0.3236 |
6720 |
0.49 |
0.44 |
|
15% |
0.3182 |
0.3353 |
6179 |
0.84 |
0.83 |
|
20% |
0.3197 |
0.3382 |
6093 |
1.49 |
1.42 |
|
25% |
0.3205 |
0.3401 |
6050 |
2.11 |
1.95 |
|
30% |
0.3216 |
0.3418 |
5993 |
2.74 |
2.50 |
|
35% |
0.3219 |
0.3417 |
5978 |
3.01 |
2.75 |
|
40% |
0.3219 |
0.3419 |
5977 |
3.36 |
3.04 |
|
45% |
0.3218 |
0.3416 |
5980 |
3.55 |
3.21 |
|
50% |
0.3218 |
0.3413 |
5985 |
3.72 |
3.36 |
|
55% |
0.3213 |
0.3410 |
6006 |
3.87 |
3.47 |
|
60% |
0.3211 |
0.3404 |
6018 |
3.91 |
3.52 |
|
65% |
0.3209 |
0.3400 |
6029 |
4.01 |
3.61 |
|
70% |
0.3205 |
0.3395 |
6051 |
4.03 |
3.62 |
|
75% |
0.3202 |
0.3390 |
6066 |
4.03 |
3.63 |
|
80% |
0.3197 |
0.3385 |
6091 |
4.01 |
3.60 |
|
85% |
0.3194 |
0.3380 |
6110 |
3.97 |
3.57 |
|
90% |
0.3188 |
0.3372 |
6141 |
3.83 |
3.45 |
|
95% |
0.3181 |
0.3365 |
6180 |
3.62 |
3.27 |
|
100% |
0.3168 |
0.3350 |
6252 |
3.08 |
2.78 |
|
|
|||||
|
Average |
0.3197 |
0.3385 |
6094 |
3.14 |
2.84 |
|
|
|
balance of primaries in the Warm white balance mode |
Normal
Despite its name the Normal mode is not the
default preset in the OSD. The average CCT in this mode is 6989 K, which results
in relatively cool colours (slightly blueish). Like the Warm preset the white
balance is slightly greener than its D-series counterpart.
|
|
R |
G |
B |
|
Value per channel in OSD |
43 |
46 |
49 |
|
Value per channel in Factory OSD |
113 |
119 |
125 |
|
Grey level |
x |
y |
CCT (K) |
∆E00 |
∆E94 |
|
10% |
0.3024 |
0.3196 |
7211 |
0.89 |
0.86 |
|
15% |
0.3009 |
0.3235 |
7246 |
1.65 |
1.31 |
|
20% |
0.3064 |
0.3270 |
6876 |
1.20 |
0.90 |
|
25% |
0.3051 |
0.3271 |
6948 |
1.79 |
1.29 |
|
30% |
0.3071 |
0.3296 |
6808 |
1.98 |
1.32 |
|
35% |
0.3063 |
0.3296 |
6854 |
2.48 |
1.65 |
|
40% |
0.3066 |
0.3284 |
6850 |
2.27 |
1.56 |
|
45% |
0.3060 |
0.3294 |
6875 |
3.00 |
2.00 |
|
50% |
0.3060 |
0.3290 |
6881 |
3.11 |
2.09 |
|
55% |
0.3058 |
0.3284 |
6893 |
3.17 |
2.16 |
|
60% |
0.3051 |
0.3272 |
6946 |
3.30 |
2.34 |
|
65% |
0.3051 |
0.3267 |
6956 |
3.35 |
2.43 |
|
70% |
0.3046 |
0.3268 |
6985 |
3.81 |
2.72 |
|
75% |
0.3041 |
0.3258 |
7025 |
3.96 |
2.92 |
|
80% |
0.3043 |
0.3262 |
7007 |
4.11 |
2.99 |
|
85% |
0.3040 |
0.3254 |
7034 |
4.20 |
3.16 |
|
90% |
0.3031 |
0.3240 |
7106 |
4.52 |
3.56 |
|
95% |
0.3028 |
0.3240 |
7121 |
4.82 |
3.75 |
|
100% |
0.3015 |
0.3217 |
7232 |
5.29 |
4.37 |
|
|
|||||
|
Average |
0.3046 |
0.3263 |
6989 |
3.10 |
2.28 |
|
|
|
balance of primaries in the Normal white balance mode |
Cool
The Cool preset has the highest CCT, with an
average value of 8683 K.
|
|
R |
G |
B |
|
Value per channel in OSD |
36 |
41 |
49 |
|
Value per channel in Factory OSD |
100 |
110 |
125 |
|
Grey level |
x |
y |
CCT (K) |
∆E00 |
∆E94 |
|
10% |
0.2882 |
0.3024 |
8601 |
2.37 |
2.24 |
|
15% |
0.2846 |
0.3008 |
8959 |
3.71 |
3.42 |
|
20% |
0.2867 |
0.3068 |
8594 |
3.96 |
3.56 |
|
25% |
0.2888 |
0.3065 |
8435 |
4.40 |
3.98 |
|
30% |
0.2879 |
0.3074 |
8484 |
5.01 |
4.43 |
|
35% |
0.2886 |
0.3081 |
8404 |
5.35 |
4.70 |
|
40% |
0.2876 |
0.3070 |
8518 |
6.07 |
5.27 |
|
45% |
0.2878 |
0.3072 |
8494 |
6.50 |
5.59 |
|
50% |
0.2867 |
0.3061 |
8611 |
7.21 |
6.13 |
|
55% |
0.2876 |
0.3065 |
8533 |
7.44 |
6.31 |
|
60% |
0.2867 |
0.3054 |
8639 |
8.12 |
6.81 |
|
65% |
0.2860 |
0.3045 |
8721 |
8.73 |
7.25 |
|
70% |
0.2858 |
0.3043 |
8742 |
9.18 |
7.56 |
|
75% |
0.2854 |
0.3028 |
8828 |
9.80 |
8.01 |
|
80% |
0.2855 |
0.3033 |
8798 |
10.07 |
8.18 |
|
85% |
0.2855 |
0.3037 |
8787 |
10.38 |
8.38 |
|
90% |
0.2849 |
0.3018 |
8906 |
11.12 |
8.88 |
|
95% |
0.2848 |
0.3018 |
8911 |
11.44 |
9.09 |
|
100% |
0.2834 |
0.2996 |
9113 |
12.36 |
9.67 |
|
|
|||||
|
Average |
0.2864 |
0.3045 |
8683 |
7.54 |
6.29 |
|
|
|
balance of primaries in the Cool white balance mode |
sRGB
The name of this mode may give the idea that this
is a calibrated mode, that however is not the case. Out of the four presets it
does come closest to D65, but the average difference is still roughly 400 K. The
∆E00 colour difference of 3.00 would be clearly visible, even without
a side by side comparison.
|
|
R |
G |
B |
|
Value per channel in OSD |
46 |
46 |
46 |
|
Value per channel in Factory OSD |
120 |
120 |
120 |
|
Grey level |
x |
y |
CCT (K) |
∆E00 |
∆E94 |
|
10% |
0.3106 |
0.3201 |
6697 |
0.98 |
0.78 |
|
15% |
0.3178 |
0.3341 |
6205 |
0.71 |
0.70 |
|
20% |
0.3199 |
0.3375 |
6086 |
1.39 |
1.34 |
|
25% |
0.3207 |
0.3389 |
6043 |
1.88 |
1.79 |
|
30% |
0.3213 |
0.3401 |
6012 |
2.39 |
2.23 |
|
35% |
0.3218 |
0.3410 |
5986 |
2.84 |
2.62 |
|
40% |
0.3216 |
0.3410 |
5991 |
3.11 |
2.85 |
|
45% |
0.3217 |
0.3410 |
5989 |
3.39 |
3.09 |
|
50% |
0.3212 |
0.3405 |
6013 |
3.51 |
3.18 |
|
55% |
0.3210 |
0.3403 |
6024 |
3.66 |
3.31 |
|
60% |
0.3207 |
0.3398 |
6041 |
3.74 |
3.37 |
|
65% |
0.3204 |
0.3394 |
6058 |
3.80 |
3.42 |
|
70% |
0.3200 |
0.3388 |
6077 |
3.80 |
3.43 |
|
75% |
0.3197 |
0.3384 |
6093 |
3.80 |
3.43 |
|
80% |
0.3193 |
0.3379 |
6117 |
3.80 |
3.42 |
|
85% |
0.3190 |
0.3374 |
6134 |
3.76 |
3.39 |
|
90% |
0.3185 |
0.3369 |
6158 |
3.67 |
3.31 |
|
95% |
0.3180 |
0.3362 |
6188 |
3.50 |
3.17 |
|
100% |
0.3172 |
0.3353 |
6233 |
3.21 |
2.91 |
|
|
|||||
|
Average |
0.3195 |
0.3376 |
6107 |
3.00 |
2.72 |
|
|
|
balance of primaries in the sRGB white balance mode |
User
Unlike the other four modes this mode is not defined in the Factory OSD. The first time you start the monitor this mode will have the RGB values displayed in the table below. If you reset the OSD to factory defaults the latest values of this mode will still be saved. The only way to reset this mode is with the Erase EEPROM function in the Factory OSD, but that function is locked. Surprisingly though it does offer the best white balance, with an average CCT of 6541 K, which is very close to the desired 6504 K.
|
|
R |
G |
B |
|
Value per channel in OSD |
50 |
50 |
50 |
|
|
x |
y |
CCT (K) |
∆E00 |
∆E94 |
|
10% |
0.3022 |
0.3221 |
7184 |
0.86 |
0.77 |
|
15% |
0.3097 |
0.3306 |
6656 |
0.88 |
0.58 |
|
20% |
0.3134 |
0.3320 |
6449 |
0.65 |
0.51 |
|
25% |
0.3132 |
0.3337 |
6448 |
1.30 |
0.99 |
|
30% |
0.3137 |
0.3326 |
6425 |
0.99 |
0.80 |
|
35% |
0.3139 |
0.3321 |
6421 |
0.92 |
0.77 |
|
40% |
0.3140 |
0.3332 |
6406 |
1.38 |
1.12 |
|
45% |
0.3137 |
0.3326 |
6426 |
1.32 |
1.06 |
|
50% |
0.3143 |
0.3332 |
6393 |
1.56 |
1.29 |
|
55% |
0.3131 |
0.3310 |
6471 |
0.90 |
0.71 |
|
60% |
0.3131 |
0.3311 |
6469 |
1.05 |
0.82 |
|
65% |
0.3126 |
0.3306 |
6499 |
1.00 |
0.73 |
|
70% |
0.3123 |
0.3300 |
6522 |
0.87 |
0.60 |
|
75% |
0.3125 |
0.3309 |
6501 |
1.38 |
1.00 |
|
80% |
0.3114 |
0.3289 |
6578 |
0.86 |
0.60 |
|
85% |
0.3110 |
0.3281 |
6604 |
0.83 |
0.69 |
|
90% |
0.3107 |
0.3280 |
6624 |
1.04 |
0.86 |
|
95% |
0.3099 |
0.3266 |
6679 |
1.41 |
1.34 |
|
100% |
0.3107 |
0.3293 |
6609 |
1.76 |
1.17 |
|
|
|||||
|
Average |
0.3119 |
0.3304 |
6541 |
1.10 |
0.86 |
|
|
|
balance of primaries in the User white balance mode |
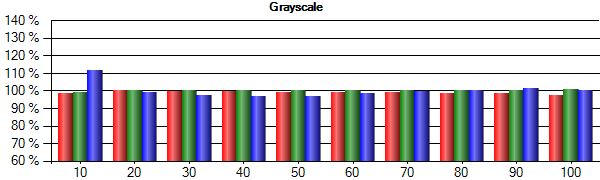
![]()
The gamma value determines the brightness of all grey levels between black and white based on the brightness of white. The reason for gamma encoding is that human contrast perception is proportionate to brightness: you can discriminate smaller differences in brightness at a lower brightness. It would for instance be hard to distinguish between 200 and 201 cd/m², but the difference between 1 and 2 cd/m² is easily perceivable. The absolute difference is the same, but the relative difference is 200 times greater. Since display work with fixed point encoding (integers) you would have a very low relative brightness resolution near black and very high near white with linear gamma (linear relation between grey levels and brightness).
Example with white 100 cd/m² and black 0 cd/m²
|
8-bit grey level |
Brightness γ=1 (cd/m²) |
Difference (cd/m²) |
Brightness γ=2.2 (cd/m²) |
Difference (cd/m²) |
|
0 |
0 |
0.392 |
0 |
5.07 · 10-4 |
|
1 |
0.392 |
5.07 · 10-4 |
||
|
|
||||
|
254 |
99.608 |
0.392 |
99.139 |
0.861 |
|
255 |
100 |
100 |
||
The difference between RGB0 and RGB1 is reduced by a factor 772 while the difference between RGB254 and RGB255 increases by a factor of 2.19, when γ=2.2 instead of γ=1.
The gamma response of the AOC q2770Pqu is tested
for all three gamma settings available in the OSD (Gamma1, Gamma2 and Gamma3)
and is also tested after calibration. To test the gamma response the brightness
has been measured for 20 grey levels, from 5% to 100% in 5% increments. Most RGB
colour spaces use a gamma of 2.2, which is also the native gamma of most display
panels. Therefore a gamma of 2.2 will be used as a target value for all modes.
The gamma value is then obtained by
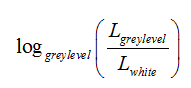
Example for 10% grey=1.53 cd/m² and white=263.46 cd/m²
The target brightness is obtained by
![]()
Example for 10% grey with γ=2.2 and white=263.46 cd/m²
![]()
Gamma1
The default gamma setting for the q2770Pqu is the
Gamma1 mode. With an average measured gamma value of 2.29 it’s the closest to
the 2.2 gamma value used by many colour spaces, which is also the native gamma
of the LTM270DL06 panel used in this display.
The largest deviations in gamma value can be found
on both ends of the scale, but especially near white. The largest relative
deviations in brightness can be found at the dark end of the scale. The 5% grey
level stands out from the rest in that it’s only measured grey level with a
gamma value that’s lower than 2.2, therefore it’s also the only grey level with
a measured brightness higher than the target brightness. This is often the case
near black and has to do with the black point of the panel: the brightness of
black isn’t 0 cd/m² and therefore grey levels near black have an offset as well.
Adjusting this in the gamma curve would result in black crush.
|
Grey level |
Measured brightness (cd/m²) |
Calculated gamma |
Target brightness cd/m² |
Deviation from target brightness |
|
100% |
263.46 |
|
263.46 |
|
|
95% |
232.72 |
2.42 |
235.34 |
-1.1% |
|
90% |
205.90 |
2.34 |
208.95 |
-1.5% |
|
85% |
179.47 |
2.36 |
184.26 |
-2.6% |
|
80% |
157.84 |
2.30 |
161.25 |
-2.1% |
|
75% |
136.87 |
2.28 |
139.91 |
-2.2% |
|
70% |
115.69 |
2.31 |
120.21 |
-3.8% |
|
65% |
97.08 |
2.32 |
102.12 |
-4.9% |
|
60% |
81.68 |
2.29 |
85.63 |
-4.6% |
|
55% |
66.32 |
2.31 |
70.71 |
-6.2% |
|
50% |
53.42 |
2.30 |
57.34 |
-6.8% |
|
45% |
41.53 |
2.31 |
45.48 |
-8.7% |
|
40% |
32.21 |
2.29 |
35.09 |
-8.2% |
|
35% |
23.42 |
2.31 |
26.16 |
-10.5% |
|
30% |
16.46 |
2.30 |
18.64 |
-11.7% |
|
25% |
10.86 |
2.30 |
12.48 |
-13.0% |
|
20% |
6.81 |
2.27 |
7.64 |
-10.8% |
|
15% |
3.67 |
2.25 |
4.06 |
-9.4% |
|
10% |
1.53 |
2.24 |
1.66 |
-8.2% |
|
5% |
0.60 |
2.03 |
0.36 |
67.0% |

measured
brightness for Gamma1 compared to target brightness for γ=2.2
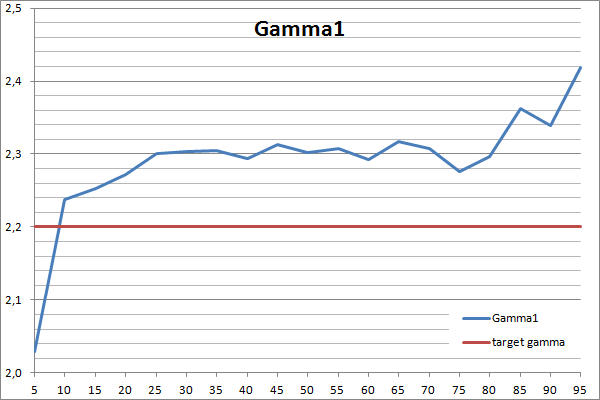
calculated gamma for Gamma1 compared to γ=2.2
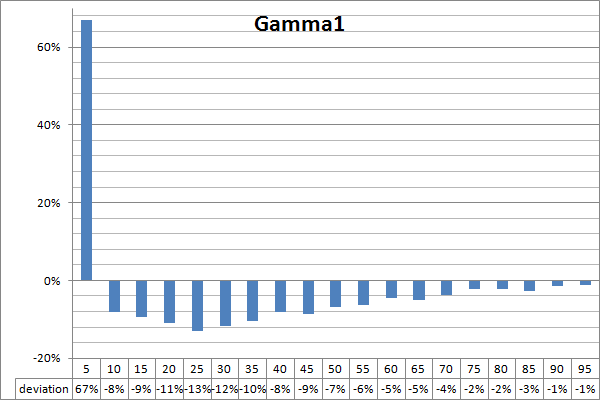
deviation in measured brightness for Gamma1 compared to target
brightness for γ=2.2
Gamma2
The Gamma2 mode has a lower gamma, meaning that
the brightness of the grey levels between black and white have a higher
brightness. The average gamma value in this mode is 2.02, but the gamma value
shows very large deviations. This mode might be useful to start from when a
gamma value below 2.2 is required (for instance 1.8, used by some colour
spaces), but it would definitely require a calibration.
|
Grey level |
Measured brightness (cd/m²) |
Calculated gamma |
Target brightness cd/m² |
Deviation from target brightness |
|
100% |
247.52 |
|
247.52 |
|
|
95% |
219.37 |
2.35 |
221.11 |
-0.8% |
|
90% |
197.86 |
2.13 |
196.31 |
0.8% |
|
85% |
177.45 |
2.05 |
173.12 |
2.5% |
|
80% |
160.92 |
1.93 |
151.50 |
6.2% |
|
75% |
143.93 |
1.88 |
131.45 |
9.5% |
|
70% |
124.55 |
1.93 |
112.94 |
10.3% |
|
65% |
106.73 |
1.95 |
95.95 |
11.2% |
|
60% |
90.58 |
1.97 |
80.45 |
12.6% |
|
55% |
75.33 |
1.99 |
66.44 |
13.4% |
|
50% |
61.69 |
2.00 |
53.87 |
14.5% |
|
45% |
49.23 |
2.02 |
42.73 |
15.2% |
|
40% |
39.00 |
2.02 |
32.97 |
18.3% |
|
35% |
29.36 |
2.03 |
24.58 |
19.4% |
|
30% |
21.03 |
2.05 |
17.51 |
20.1% |
|
25% |
14.28 |
2.06 |
11.72 |
21.8% |
|
20% |
9.20 |
2.05 |
7.18 |
28.2% |
|
15% |
5.21 |
2.04 |
3.81 |
36.7% |
|
10% |
2.19 |
2.05 |
1.56 |
39.9% |
|
5% |
0.78 |
1.92 |
0.34 |
128.4% |
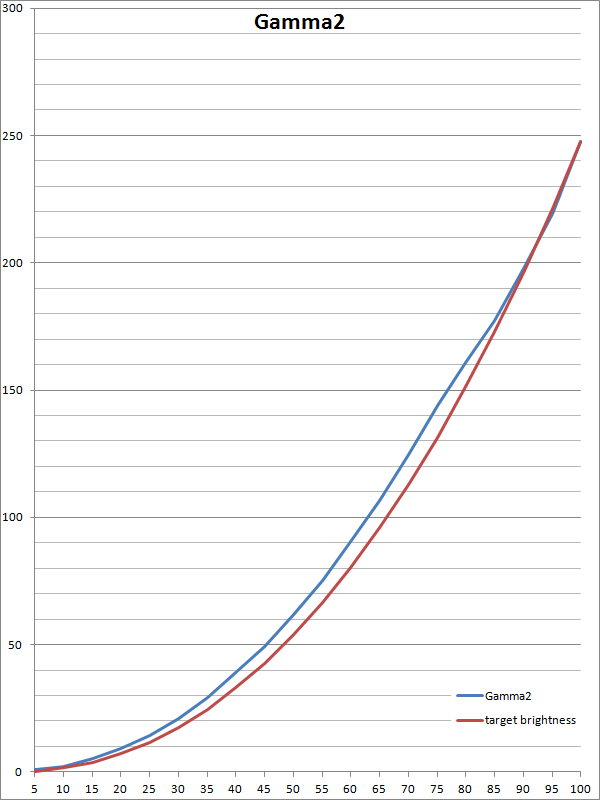
measured brightness for Gamma2 compared to target brightness for γ=2.2
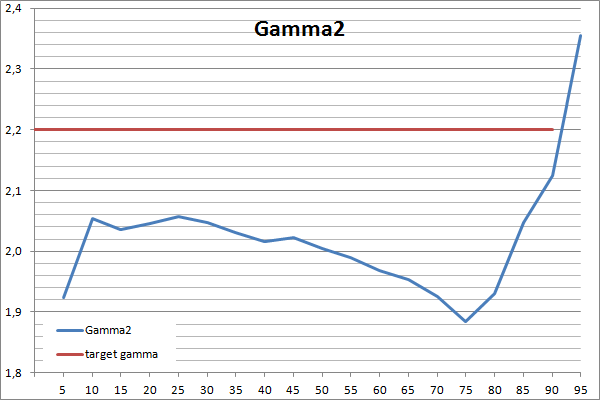
calculated gamma for Gamma2 compared to γ=2.2
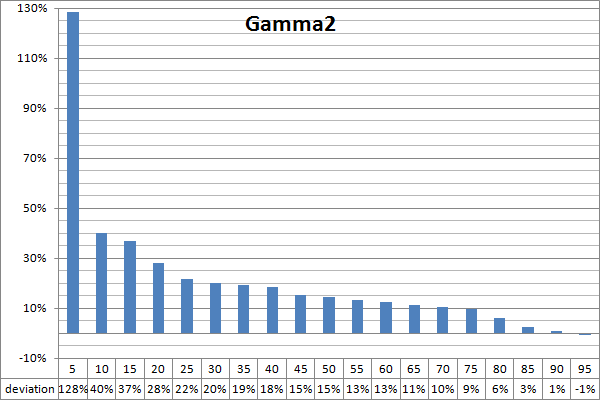
deviation in measured brightness for Gamma2 compared to target
brightness for γ=2.2
Gamma3
The Gamma3 mode has a high average gamma value of
2.48. Like in the Gamma2 mode the gamma value in the Gamma3 mode shows very
large deviations. Gamma values above 2.4 are hardly used and for gamma 2.4 the
Gamma1 mode is probably a better choice. It’s easier to lower the brightness
through calibration than to increase it and the Gamma1 mode also has a more
constant gamma value. Therefore the Gamma3 mode on the q2270Pqu isn’t
particularly useful.
|
Grey level |
Measured brightness (cd/m²) |
Calculated gamma |
Target brightness cd/m² |
Deviation from target brightness |
|
100% |
243.20 |
|
243.20 |
|
|
95% |
210.77 |
2.79 |
217.25 |
-3.0% |
|
90% |
186.05 |
2.54 |
192.88 |
-3.5% |
|
85% |
163.27 |
2.45 |
170.09 |
-4.0% |
|
80% |
145.25 |
2.31 |
148.85 |
-2.4% |
|
75% |
123.73 |
2.35 |
129.15 |
-4.2% |
|
70% |
101.96 |
2.44 |
110.96 |
-8.1% |
|
65% |
84.57 |
2.45 |
94.27 |
-10.3% |
|
60% |
69.18 |
2.46 |
79.05 |
-12.5% |
|
55% |
55.34 |
2.48 |
65.28 |
-15.2% |
|
50% |
43.35 |
2.49 |
52.93 |
-18.1% |
|
45% |
32.61 |
2.52 |
41.98 |
-22.3% |
|
40% |
24.42 |
2.51 |
32.40 |
-24.6% |
|
35% |
16.67 |
2.55 |
24.15 |
-31.0% |
|
30% |
11.22 |
2.55 |
17.20 |
-34.8% |
|
25% |
7.07 |
2.55 |
11.52 |
-38.6% |
|
20% |
4.21 |
2.52 |
7.05 |
-40.3% |
|
15% |
2.04 |
2.52 |
3.74 |
-45.6% |
|
10% |
0.95 |
2.41 |
1.53 |
-38.0% |
|
5% |
0.38 |
2.16 |
0.33 |
12.5% |
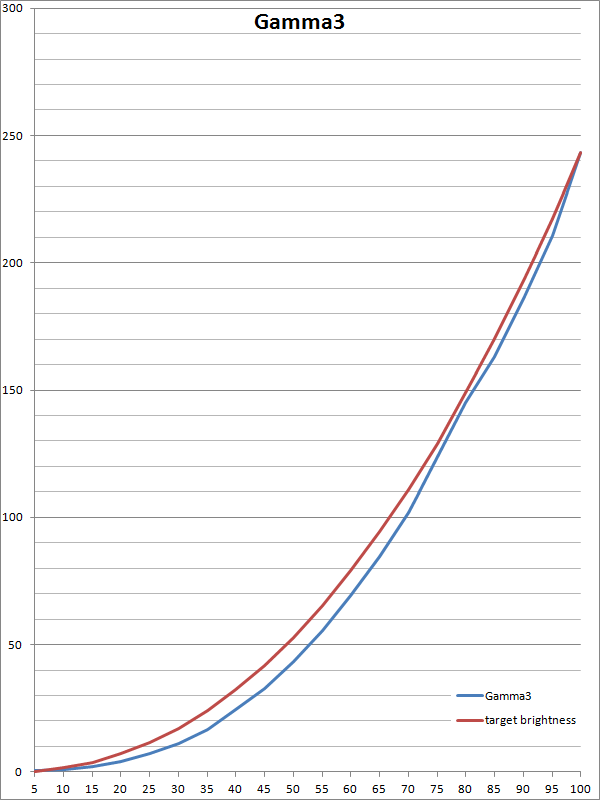
measured
brightness for Gamma3 compared to target brightness for γ=2.2
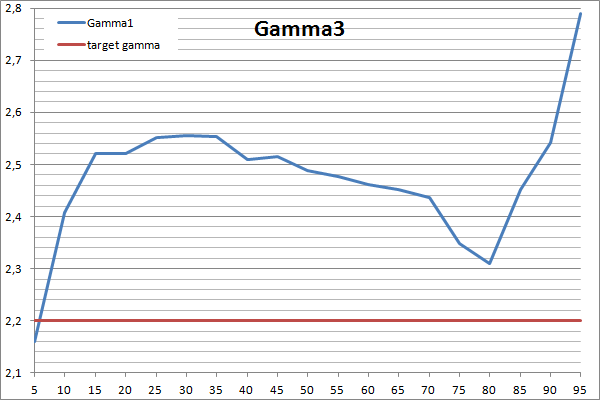
calculated gamma for Gamma3 compared to γ=2.2
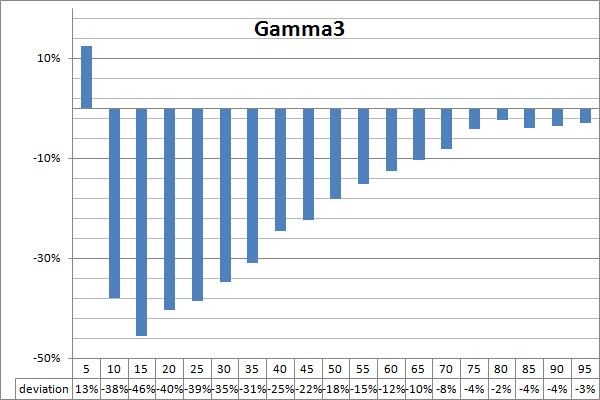
deviation in measured brightness for Gamma3 compared to target
brightness for γ=2.2
Colour Gamut
The colour gamut of the q2770Pqu is very similar to the sRGB colour space, but slightly larger. This display does stand out from the average sRGB display though. First of all it covers 100.0% of it in the CIE 1931 xy chromaticity diagram. Most sRGB displays don’t go higher than 96% coverage. Higher sRGB coverage is usually only found on wide gamut displays. But what’s more, red and blue are very saturated. Red is very close to monochrome 612 nm and blue is very close to 464 nm (based on ∆E00 and ∆E94). The Euclidean distance in the CIE 1931 xy chromaticity diagram would suggest otherwise: 608 and 463 nm. That difference can be explained by the path of the equi-hue lines. The colour difference is the lowest on the equi-hue lines, even if that results in a far larger difference in saturation.
In fact, the blue primary has the deepest hue and highest saturation of all blue primaries I’ve ever seen on LCD displays (including all LCD panels discussed in the Pointer’s gamut article), with a colour difference from 464 nm of only∆E00 = 1.36 (with normalized brightness of blue primary calculated from other primaries and white point). The red primary is not of a particularly deep hue, lying on the 612 nm equi-hue line, which is more of an orangey red than true red. sRGB and Adobe RGB have a red that’s on the 622 nmequi-hue line, although far less saturated. Most wide gamut displays have a red with a hue equal to 625-635 nm, but with slightly lower saturation than on this panel. Because of the higher saturation the red of the q2770Pqu does look redder than the sRGB / Adobe RGB red, despite the more orangey hue.
The downside of these saturated primaries is that
without calibration colours will look oversaturated. Furthermore, they are
difficult to measure accurately with consumer grade colorimeters, like the
X-Rite i1Display Pro. An i1Basic Pro 2 kit (which includes the i1Pro 2
spectrophotometer) would cost nearly five times as much and more than twice as
much as the display itself.
Colour space coverage
|
|
CIE 1931 xy chromaticity diagram |
CIE 1976 u’v’ chromaticity diagram |
|
Relative size of NTSC 1953 |
79.6% |
100.6% |
|
Coverage of sRGB / Rec. 709 |
100.0% |
99.8% |
|
Coverage of Adobe RGB |
79.2% |
88.6% |
|
Coverage of Rec. 2020 |
59.3% |
66.1% |
|
Coverage of DCI-P3 |
81.9% |
87.7% |
|
Coverage of Pointer’s gamut |
76.2% |
77.6% |

sRGB
colour space versus specified colour gamut in CIE 1931 xy chromaticity diagram
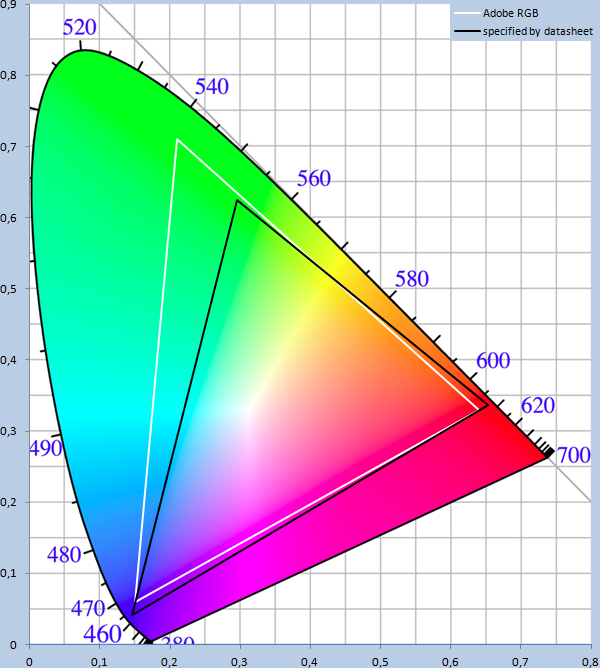
Adobe RGB colour space versus specified colour gamut in CIE 1931 xy
chromaticity diagram

Pointer’s gamut versus specified colour gamut in CIE 1931 xy chromaticity diagram
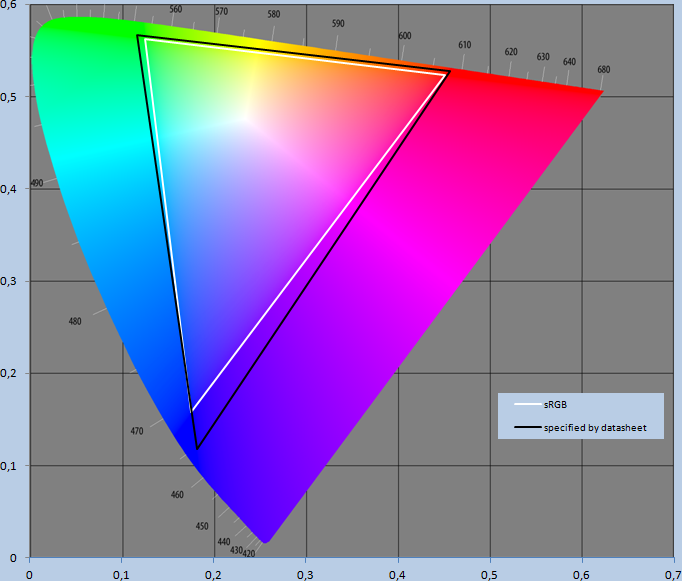
sRGB colour space versus specified colour gamut in CIE 1976 u’v’
chromaticity diagram
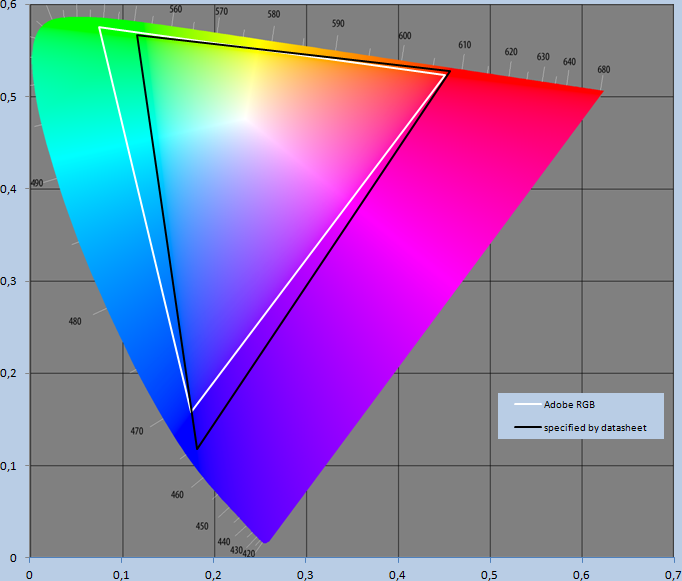
Adobe RGB colour space versus specified colour gamut in CIE 1976 u’v’
chromaticity diagram
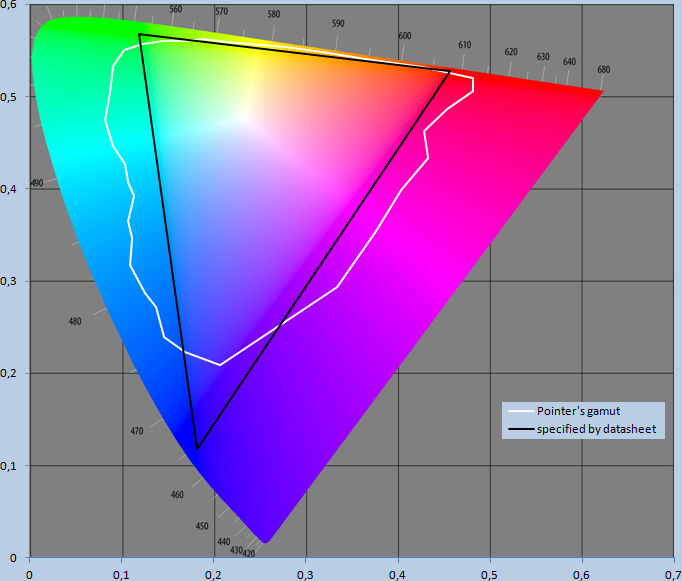
Pointer’s gamut versus specified colour gamut in CIE 1976 u’v’
chromaticity diagram
Measurements
The colour gamut was tested for all four factory
set white balance modes, as these can sometimes influence the gamut. This
however was not the case; all modes had the same gamut, including the sRGB mode.
The deviations between the different modes were insignificant and most likely
caused by repeatability deviations of the measurement equipment. Therefore only
the test results at the factory default settings are included in the table
below.
|
Colour |
CIE 1931 xy chromaticity diagram |
CIE 1976 u’v’ chromaticity diagram |
||||||
|
Specified |
Measured |
Specified |
Measured |
|||||
|
x |
y |
x |
y |
u’ |
v’ |
u’ |
v’ |
|
|
White |
0.313 |
0.329 |
0.3160 |
0.3338 |
0.198 |
0.468 |
0.1983 |
0.4714 |
|
Red |
0.653 |
0.336 |
0.6601 |
0.3295 |
0.456 |
0.528 |
0.4687 |
0.5264 |
|
Green |
0.295 |
0.625 |
0.3051 |
0.6198 |
0.117 |
0.567 |
0.1242 |
0.5676 |
|
Blue |
0.146 |
0.042 |
0.1442 |
0.0492 |
0.182 |
0.118 |
0.1747 |
0.1341 |

measured
colour gamut versus specified colour gamut in CIE 1931 xy chromaticity diagram
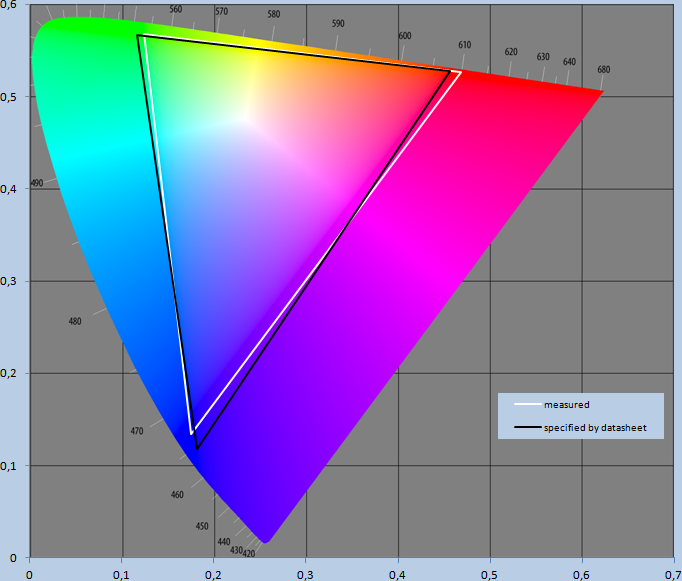
measured colour gamut versus specified colour gamut in CIE 1976 u’v’
chromaticity diagram
![]()
Calibration
-
The calibration was performed with default profile settings
-
The target white point was set to CIE Illuminant D65
-
The target brightness was set to 120 cd/m²
-
The target gamma was set to 2.2
-
The patch size was set to large – 462
-
Brightness and RGB gains were adjusted manually in the OSD
The calibrated screen settings are listed below for reference. You can use our settings and try our calibrated ICC profile if you wish, which are available in our ICC profile database. Keep in mind that results will vary from one screen to another and from one computer / graphics card to another.
Because the backlight of a display does not have a constant brightness or colour over its lifetime a calibration expires rather quickly. This is especially true for new displays. The difference in brightness and colour between 0 and 1000 backlight on hours is far greater than between 5000 and 6000 backlight on hours. All the calibrated tests were performed at around 50 backlight on hours, but now, at 260 backlight on hours that calibration was already very inaccurate. Therefore the display was recalibrated for this section.
|
Monitor OSD Option |
Default Settings |
|
Brightness |
22 |
|
Contrast |
50 |
|
RGB Gain |
48, 49, 49 |
|
Gamma |
Gamma 1 |
|
Temperature |
User |
|
|
|
|
Calibrated luminance |
121.1 |
|
Calibrated Black point |
0.1336 |
|
Calibrated Contrast Ratio |
907:1 |
Calibrated White Balance (User)
The white balance was also tested after calibration. First the white balance for
100% grey (white) was corrected as best as possible with the RGB-controls
offered by the User mode, based on the directions given by the calibration
software. The white balance was then further corrected by the graphics card LUT
through the use of an ICC profile created by the X-Rite i1Profiler software.
Like with the other calibrated tests this is just as much, if not more, a test
for the calibration software, as it is for the display. But it is still
important to know how well a display performs after calibration to see how much
you can get out of it.
The values used in the OSD for the first
correction are:
|
|
R |
G |
B |
|
Value per channel in OSD |
48 |
49 |
51 |
|
Grey level |
x |
y |
CCT (K) |
∆ CCT (K) |
∆E00 |
∆E94 |
|
10% |
0.3115 |
0.3276 |
6580 |
76 |
0.12 |
0.12 |
|
20% |
0.3133 |
0.3301 |
6466 |
-37 |
0.21 |
0.18 |
|
30% |
0.3132 |
0.3303 |
6471 |
-33 |
0.35 |
0.29 |
|
40% |
0.3137 |
0.3321 |
6432 |
-71 |
1.03 |
0.84 |
|
50% |
0.3133 |
0.3301 |
6467 |
-37 |
0.38 |
0.34 |
|
60% |
0.3144 |
0.3315 |
6395 |
-108 |
0.92 |
0.87 |
|
70% |
0.3147 |
0.3312 |
6383 |
-120 |
0.91 |
0.89 |
|
80% |
0.3144 |
0.3315 |
6396 |
-107 |
1.15 |
1.08 |
|
90% |
0.3149 |
0.3323 |
6365 |
-139 |
1.63 |
1.51 |
|
100% |
0.3127 |
0.3289 |
6507 |
4 |
0.12 |
0.09 |
|
|
||||||
|
Average |
0.3136 |
0.3306 |
6446 |
-58 |
0.68 |
0.62 |
The table above and graph below show that the white
balance was quite decent after calibration, although 60-90% grey still showed a
deviation that would be visible in a side by side comparison with the reference
target, especially 90% grey.
|
|
|
balance of primaries in the User white balance mode after calibration |
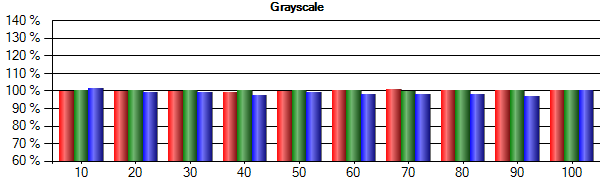
Calibrated Gamma
The gamma response was also tested after
calibration. The Gamma1 mode was used as a starting point and the gamma curve
was corrected by the graphics card LUT through the use of an ICC profile created
by the X-Rite i1Profiler software. Like with the other calibrated tests this is
just as much, if not more, a test for the calibration software, as it is for the
display. But it is still important to know how well a display performs after
calibration to see how much you can get out of it.
The average gamma after calibration is 2.22, which is a very good result. Near white the gamma value is slightly too high, but this results in only minor deviations in brightness. At 5% grey the brightness is still quite a bit higher than the target value, but as said before adjusting this in the gamma curve would result in black crush, which would be worse. For the ∆E calculations only the brightness was considered. For both the reference targets and the measurements the chromaticity coordinates of D65 were used. The reason for this is twofold: firstly, the i1Display Pro isn’t accurate enough to properly measure chromaticity and secondly, gamma is about the brightness of grey levels, not the chromaticity.
|
Grey level |
Measured brightness (cd/m²) |
Calculated gamma |
Target brightness cd/m² |
Deviation from target brightness |
∆E94 |
∆E00 |
|
100% |
121.70 |
|
121.70 |
|
|
|
|
95% |
108.09 |
2.31 |
108.71 |
-0.6% |
0.1 |
0.2 |
|
90% |
95.65 |
2.29 |
96.52 |
-0.9% |
0.2 |
0.3 |
|
85% |
83.64 |
2.31 |
85.11 |
-1.7% |
0.4 |
0.6 |
|
80% |
73.78 |
2.24 |
74.49 |
-0.9% |
0.2 |
0.3 |
|
75% |
64.18 |
2.22 |
64.63 |
-0.7% |
0.2 |
0.2 |
|
70% |
54.49 |
2.25 |
55.53 |
-1.9% |
0.4 |
0.6 |
|
65% |
46.18 |
2.25 |
47.17 |
-2.1% |
0.5 |
0.6 |
|
60% |
39.21 |
2.22 |
39.56 |
-0.9% |
0.2 |
0.2 |
|
55% |
32.27 |
2.22 |
32.66 |
-1.2% |
0.3 |
0.3 |
|
50% |
25.84 |
2.24 |
26.49 |
-2.4% |
0.6 |
0.6 |
|
45% |
20.59 |
2.23 |
21.01 |
-2.0% |
0.4 |
0.4 |
|
40% |
16.29 |
2.19 |
16.21 |
0.5% |
0.1 |
0.1 |
|
35% |
12.04 |
2.20 |
12.08 |
-0.4% |
0.1 |
0.1 |
|
30% |
8.50 |
2.21 |
8.61 |
-1.2% |
0.2 |
0.2 |
|
25% |
5.72 |
2.20 |
5.76 |
-0.7% |
0.1 |
0.1 |
|
20% |
3.69 |
2.17 |
3.53 |
4.5% |
0.4 |
0.5 |
|
15% |
1.98 |
2.17 |
1.87 |
5.7% |
0.3 |
0.5 |
|
10% |
0.79 |
2.19 |
0.77 |
2.5% |
0.1 |
0.1 |
|
5% |
0.27 |
2.04 |
0.17 |
60.2% |
0.4 |
0.7 |
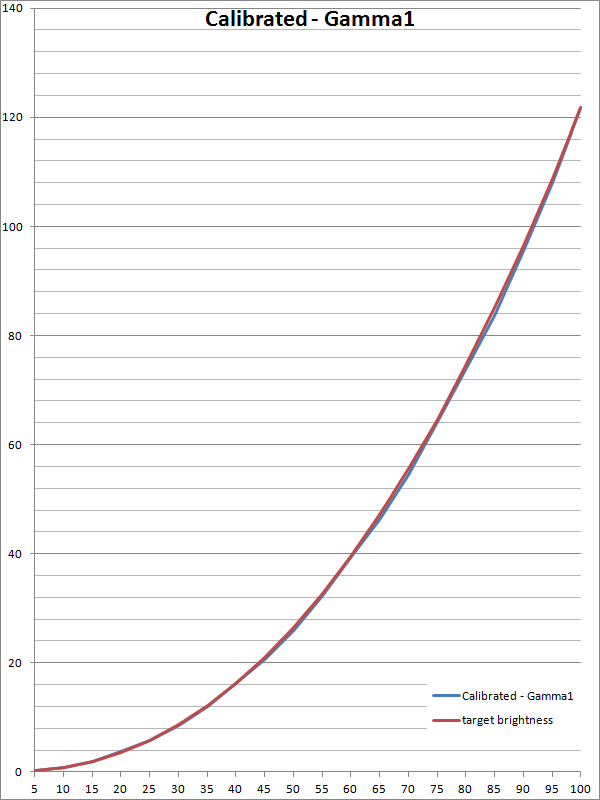
measured brightness after calibration compared to target brightness for γ=2.2
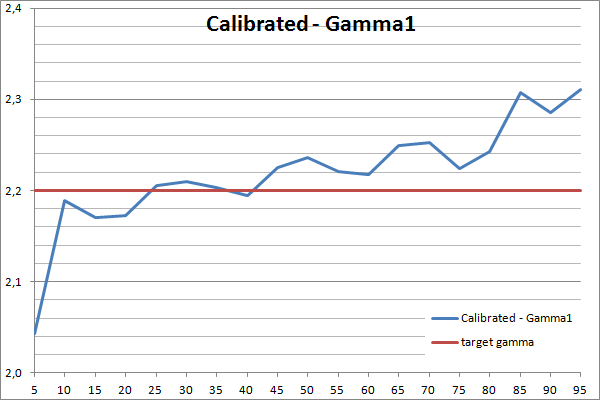
calculated gamma after calibration compared to γ=2.2
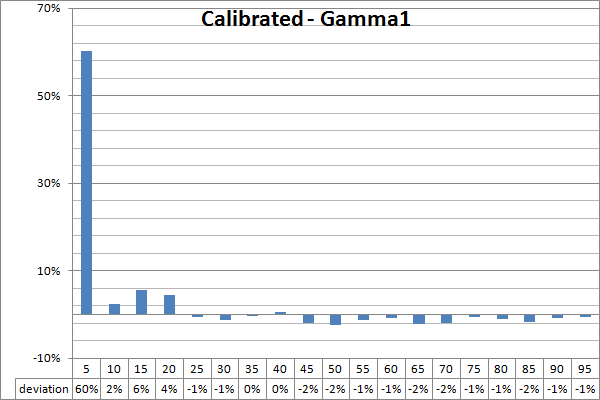
deviation in measured brightness after calibration compared to target brightness
for γ=2.2
Calibrated Colour Accuracy
For the calibrated test separate testing patterns
with the sRGB colour profile assigned were made in Photoshop CS5 Extended and
saved as 16-bit uncompressed TIFF. These were displayed by FastPictureViewer Pro
1.9.
To see how well the display performs after
calibration it received a full calibration by the X-Rite i1Pro with the
i1Profiler software. It was then tested with sRGB testing patterns.
|
Colour |
CIE 1931 xy chromaticity diagram |
Colour difference |
||||
|
sRGB |
Measured |
∆E00 |
∆E94 |
|||
|
x |
y |
x |
y |
|
||
|
White |
0.313 |
0.329 |
0.313 |
0.329 |
0.40 |
0.28 |
|
Red |
0.640 |
0.330 |
0.643 |
0.329 |
0.35 |
0.36 |
|
Green |
0.300 |
0.600 |
0.301 |
0.601 |
0.32 |
0.45 |
|
Blue |
0.150 |
0.060 |
0.148 |
0.059 |
0.26 |
0.23 |
The results show that once calibrated the q2770Pqu
has excellent colour accuracy. If you have a keen eye for colours a difference
of ∆E00 = 0.40 may just be perceivable, but most people would not be
able to distinguish such a colour difference. The excellent accuracy is also
shown in the diagram below from ChromaPure. The squares are the target values
and the circles are the measured values.
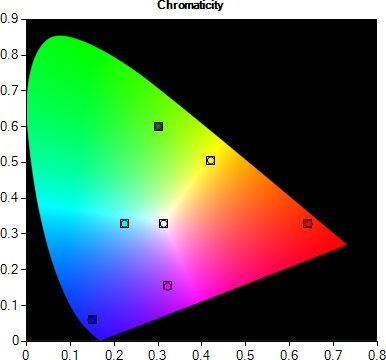
calibrated
performance with sRGB testing patterns
ICC profile supplied by manufacturer
An alternative to calibrating the display yourself
is using the ICC profile supplied by the manufacturer. On the manual / driver CD
supplied with the screen you’ll find a file named Q2770.icm, which is the ICC
profile. This profile was analyzed using Matlab.
|
Basic profile properties |
|
Header: [1x1 struct] TagTable: {14x3 cell} Copyright: 'Copyright (C) 2013 AOC International (Europe) GmbH' Description: [1x1 struct] MediaWhitePoint: [0.9526 1 1.0860] MediaBlackPoint: [0 0 0] DeviceMfgDesc: [1x1 struct] DeviceModelDesc: [1x1 struct] Luminance: [171.0900 180 196.0200] Technology: 'Active Matrix Display' MatTRC: [1x1 struct] PrivateTags: {} Filename: 'Q2770.icm' |
|
Header |
|
Size: 6984 CMMType: 'MSFT' Version: '2.1.0' DeviceClass: 'display' ColorSpace: 'RGB' ConnectionSpace: 'XYZ' CreationDate: '16-Apr-2013 14:49:36' Signature: 'acsp' PrimaryPlatform: 'Microsoft' Flags: 0 IsEmbedded: 0 IsIndependent: 1 DeviceManufacturer: 'AOC ' DeviceModel: '2770' Attributes: 2.4035e+09 IsTransparency: 1 IsMatte: 0 IsNegative: 0 IsBlackandWhite: 0 RenderingIntent: 'perceptual' Illuminant: [0.9642 1 0.8249] Creator: 'AOC ' |
|
MatTRC |
|
RedColorant: [0.3956 0.1978 0.0058] GreenColorant: [0.3698 0.7524 0.0723] BlueColorant: [0.1872 0.0498 1.0078] RedTRC: [1024x1 uint16] GreenTRC: [1024x1 uint16] BlueTRC: [1024x1 uint16] |
In the basic profile properties you’ll find the
white point. In the Header you’ll find the profile connection space illuminant
and in MatTRC you’ll find the primaries relative to the profile connection space
illuminant. All these are specified as XYZ values. The profile assumes a
brightness for white of 180 cd/m², shown by the Luminance field, which is the
XYZ value of D65 multiplied by 180.
The white point can easily be converted to xyY.
The primaries first require a chromatic adaptation to D65 to get the actual
primaries (the specified PCS illuminant is D50). The chromatic adaptation matrix
used is the
D50 to D65 Bradford matrix from Bruce Lindbloom. The results can be found in
the table below. These have been compared to the values specified by the
datasheet and the measured values. The normalized brightness Y was also included
in those comparison calculations, but the values of Y were not included in the
table.
|
Colour |
CIE 1931 xy chromaticity diagram |
∆E00 colour difference |
||
|
Specified by ICC profile |
Compared to datasheet |
Compared to measured |
||
|
x |
y |
|
||
|
White |
0.3135 |
0.3291 |
0.6 |
2.7 |
|
Red |
0.6546 |
0.3304 |
4.2 |
2.5 |
|
Green |
0.2894 |
0.6381 |
1.2 |
2.1 |
|
Blue |
0.1464 |
0.0401 |
3.8 |
5.1 |
Unfortunately the ICC profile supplied with the display isn’t a very good alternative to calibration. Especially the blue primary shows a large deviation, mostly caused by a difference in brightness. So for accurate colour reproduction there is no way around a calibration.
For the viewing angles test a reference photograph was displayed in FastPictureViewer Pro 1.9 and photographed with the Canon EOS 600D at a 45° angle from top, bottom, left and right from a tripod. For all angles, including the front view, the same ISO, relative aperture and shutter speed were used, with only minor variations in focal length. The results were cropped and combined in Photoshop CS5 Extended. Apart from that the results were not edited.
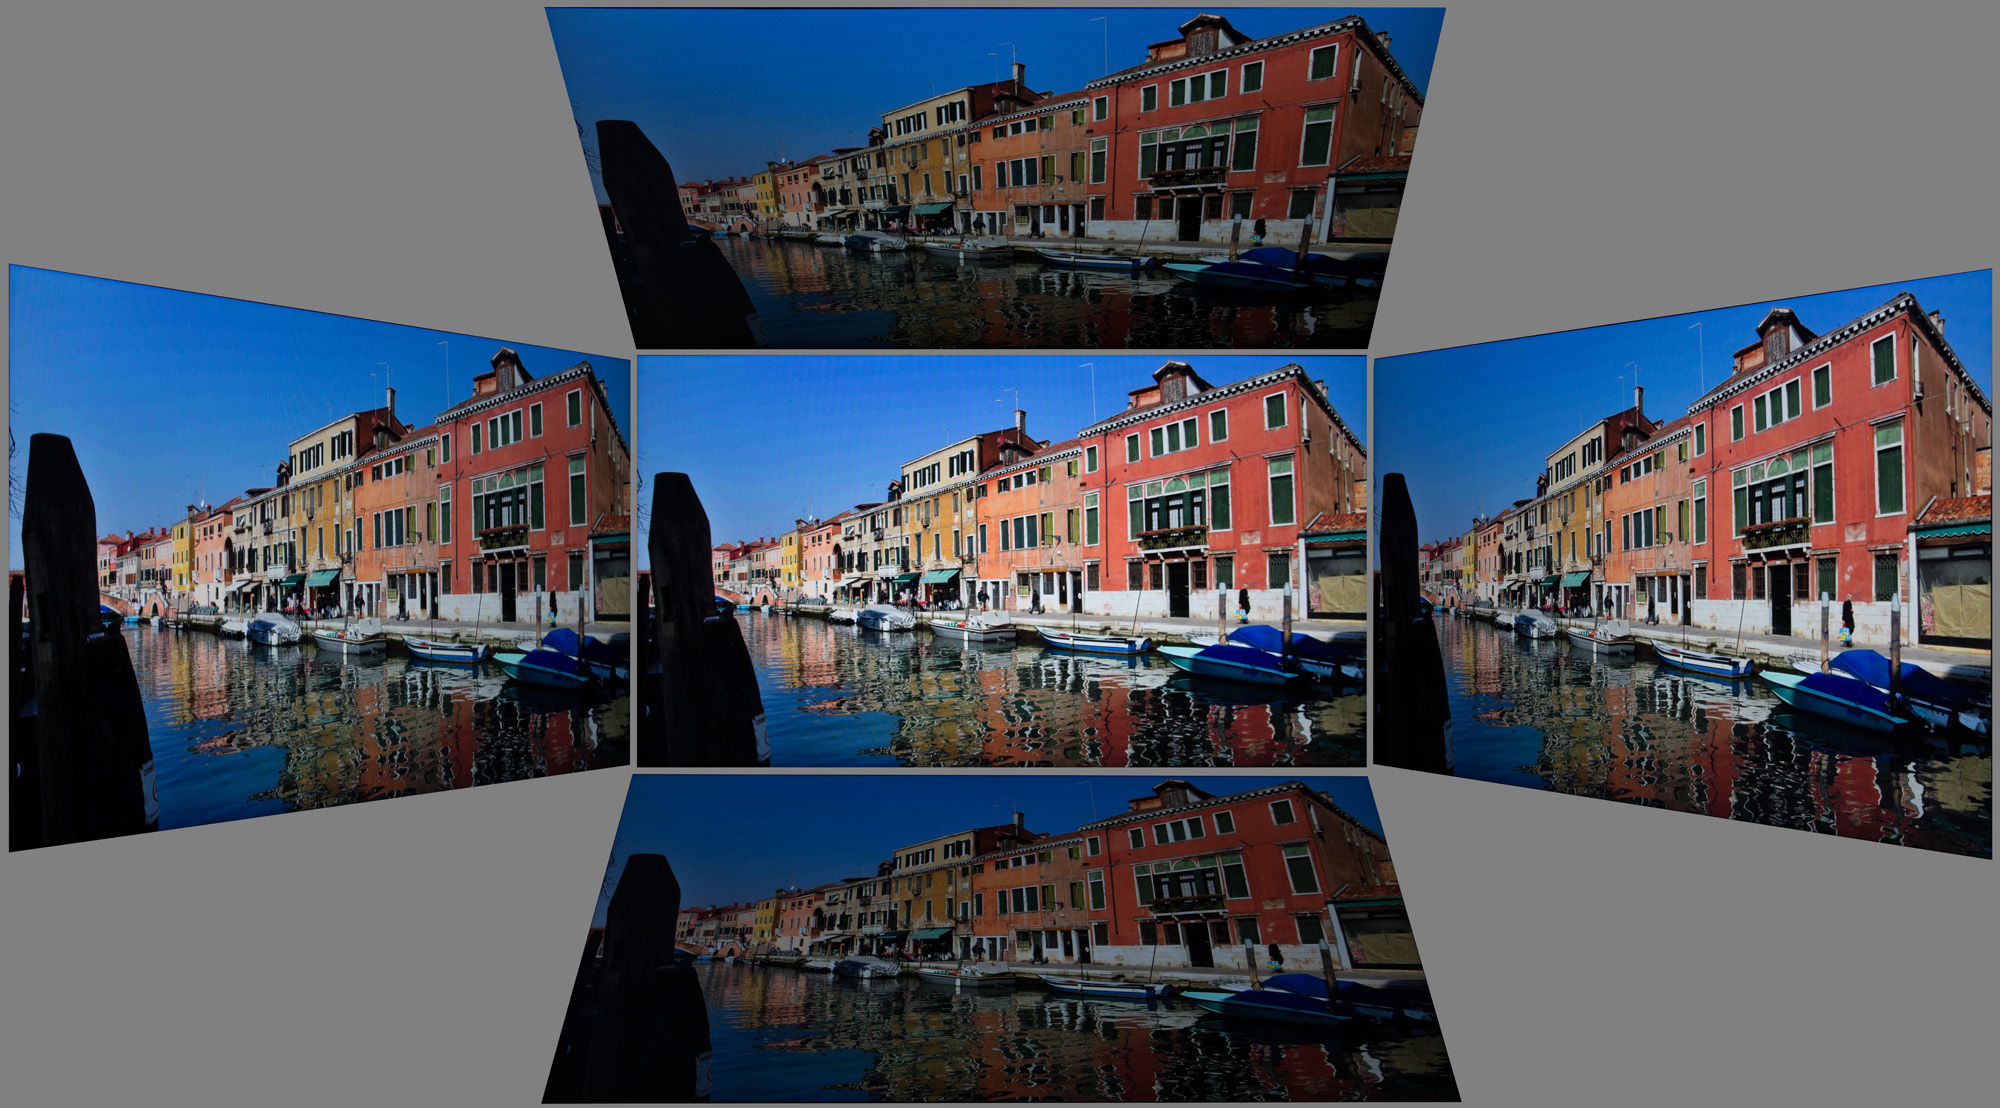
Above: Viewing
angles shown from front and side, and from above and below. Click for
larger image
Viewing angles really are one of the strengths of the Samsung PLS technology. IPS and VA technologies already do a very good job at keeping colour and gamma shifts to a minimum, but it seems PLS performs even a bit better. But what makes PLS stand out from the other two is that the brightness losses at an angle are far lower. Especially horizontally the losses are fairly insignificant at a 45° angle. It goes without saying that this panel leaves the average TN panel in the dust when it comes to viewing angles.
Off Angle Glow
Technologies similar to IPS, like AU Optronics AHVA and Samsung PLS often show a glow when viewing a black image off angle. To test this, a black image was photographed with equal camera settings from six different angles.
|
|
|
|
Fig a: front view |
|
|
|
|
|
Fig b: right 45° |
Fig c: right 65° |
|
|
|
|
Fig d: top 45° |
Fig e: top 65° |
|
|
|
|
Fig f: top right (roughly 60° total off angle) |
|

On the q2770Pqu the off angle glow was negligible horizontally. Vertically it was somewhat noticeable at 65°, but under normal circumstances the screen would not be viewed from such an extreme angle. Only when viewed from diagonal off angles the display clearly showed a glow. At normal viewing angles there is no perceivable glow.
The uniformity of a display is one of the most
important performance aspects that determine the image quality, together with
contrast ratio and colour depth. The reason for that is that unlike gamma
response, white balance, brightness and colour gamut these can’t be calibrated.
Or at least not on the vast majority of displays: some very high-end displays,
like the Eizo ColorEdge CG models, have a uniformity equalizer.
The uniformity has been measured by dividing the screen in 9x5 zones of 66.3 x 67.1 mm and measuring the brightness and chromaticity at the centre of each zone. This was done for a completely white screen and a completely black screen.
![]()
White Uniformity
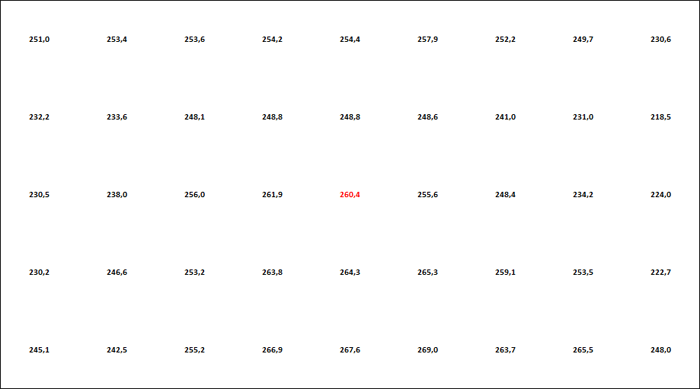
measured brightness values for white (cd/m²)
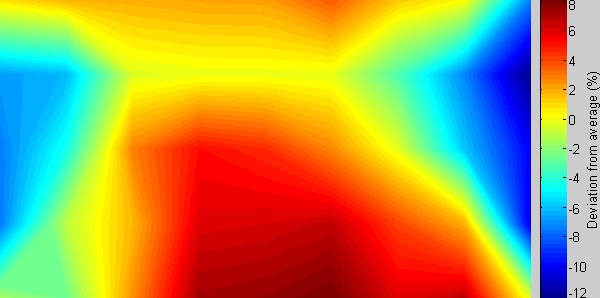
deviation in brightness for white compared to average of all points
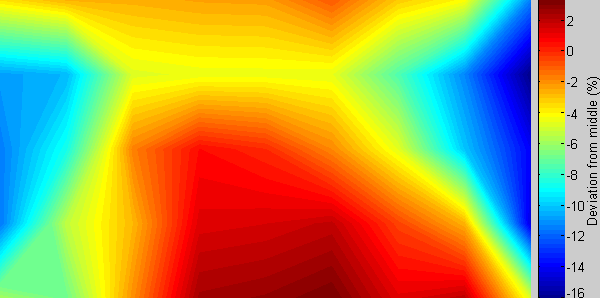
deviation in brightness for white compared to the centre of the screen
|
Compared to average |
Largest negative deviation |
-12.21% |
|
Largest positive deviation |
+8.10% |
|
|
Compared to centre |
Largest negative deviation |
-16.09% |
|
Largest positive deviation |
+3.32% |
The brightness uniformity of white is rather mediocre. Samsung specifies the following for uniformity of white for a 9 point measurement:
This basically says that the lowest brightness should be at least 75% of the highest brightness. Even with the 45 point measurement it still qualifies, with a value of 18.79%. But this says more about the requirement than the performance of the panel. To give an idea of the measured difference: on a 2.2 gamma curve the lowest value would be 92% grey, or 8-bit grey level RGB232 if you consider the highest value to be white.
|
|
|
RGB255 and RGB232 side by side |

Even if the chromaticity is perfectly uniform across the screen a value of 25% here would give a colour difference of ∆E94 = 10.61 and ∆E00 = 6.36. A value above 5.0 for either would disqualify a display for any task where colour accuracy is even fairly important. Unfortunately panel manufacturers seem to have problems with achieving decent uniformity; therefore this applies to the majority of displays. Ideally you would want a value of less than 3.0 for both metrics, which would mean that the result of that formula should be less than 7.56% with perfectly uniform chromaticity. Uniformity can be considered perfect when the value for both metrics is less than 1.0, which means a result of this formula of less than 2.56% with perfectly uniform chromaticity. Naturally, any deviation in chromaticity would require these values to be even lower. For the 18.79% value for this panel the maximum colour difference would be ∆E94 = 7.78 and ∆E00 = 4.60 when ignoring chromaticity differences.
![]()
Chromacity Uniformity
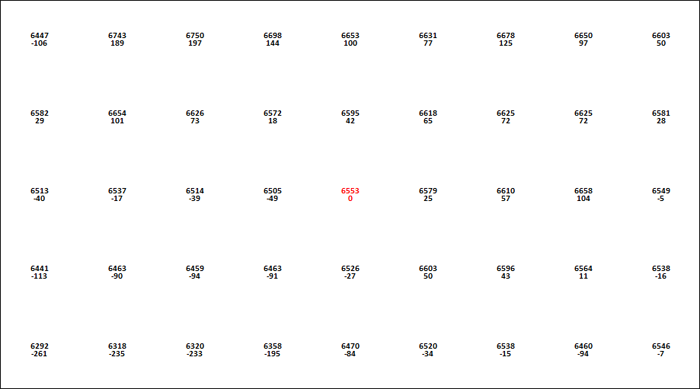
calculated CCT (K) for each point and absolute difference in CCT (K)
compared to the centre
The best way to assess the chromaticity of white separately is by looking at the correlated colour temperature (CCT) in Kelvin. It should be noted here that the chromaticity measurements of the i1Display Pro are not very accurate. However, since all measurements are in the same region of the chromaticity diagram, any offset would be near identical for all measurements. Therefore the calculated CCT at each point might not be very accurate, but the difference in CCT is fairly accurate.
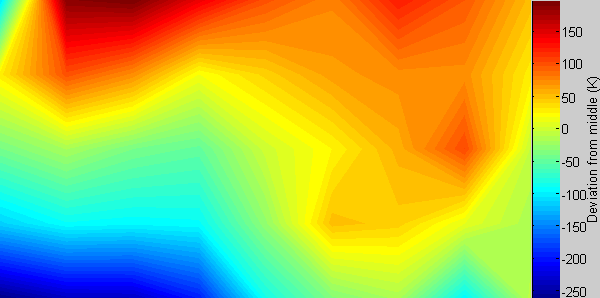
deviation in CCT (K) compared to the centre of the screen
|
Largest negative deviation |
-261 K |
|
Largest positive deviation |
+197 K |
|
Average absolute deviation from centre |
82.1 K |
|
Average absolute deviation from centre for lowest 90% |
67.2 K |
Here the panel performs slightly better. Ignoring any brightness deviations would result in a maximum colour difference of ∆E94 = 4.61 and ∆E00 = 4.86.
Combined
To calculate the actual colour difference (taking
into account both deviations in brightness and chromaticity) the
Excel ∆E calculator from ChromaPure was modified to calculate the difference
for each of the 45 points to the other 44 points (1980 transitions in total).
Special thanks here to Michiel Nijkamp for his work on the VBA code required to
achieve this. For all ∆E calculations the brightness was normalized to the
brightness of the brightest point.
|
∆E00 |
||
|
All transitions |
Average |
2.29 |
|
Maximum |
4.92 |
|
|
Centre 7x3 points |
Average |
1.56 |
|
Maximum |
3.30 |
|
|
Lowest 95% |
Average |
2.19 |
|
Maximum |
3.96 |
|
|
Transitions to/from centre |
Average |
1.87 |
|
Maximum |
3.89 |
|
|
Transitions to/from average xyY |
Average |
1.63 |
|
Maximum |
2.90 |
|
|
∆E94 |
||
|
All transitions |
Average |
2.94 |
|
Maximum |
7.92 |
|
|
Centre 7x3 points |
Average |
2.14 |
|
Maximum |
5.29 |
|
|
Lowest 95% |
Average |
2.75 |
|
Maximum |
5.77 |
|
|
Transitions to/from centre |
Average |
2.52 |
|
Maximum |
6.52 |
|
|
Transitions to/from average xyY |
Average |
2.10 |
|
Maximum |
4.81 |
|
The results show what the problem lies mainly with the worst 5% of all transitions, especially with the ∆E94 metric. Ignoring the highest 5% shaves off nearly a point in ∆E00 and over two points in ∆E94. With ∆E94 the highest 5% are mainly transitions to or from points 18, 27 and 36, which are the middle three rows in the far right column, which have a far lower brightness than the rest of the screen. With ∆E00 those same points contribute to the highest 5% together with transitions from the top left corner to the bottom right corner of the screen. In both cases the highest colour differences are found with transitions to or from points adjacent to the edges of the screen. Ignoring those outside points and looking at just the centre 7x3 points yields far lower results in ∆E00 with a maximum of 3.30 and an average of 1.56, which is already quite good. With ∆E94 the maximum is still 5.29, but the average dropped to 2.14. Based on those values the display should be usable to assess colours with a fair amount of accuracy when not using the screen area close to the borders.
![]()
Black Uniformity
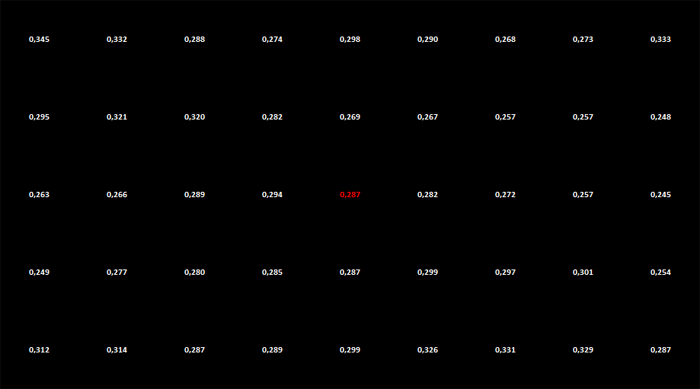
measured brightness
values for black (cd/m²)

deviation in brightness for black compared to average of all points
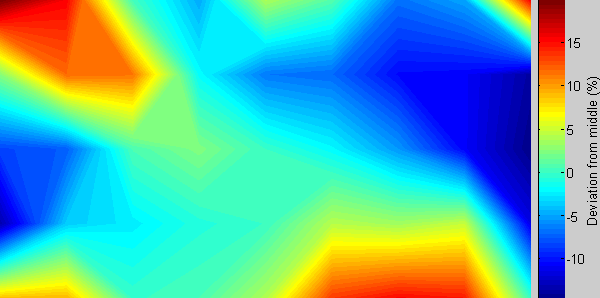
deviation in brightness for black compared to the centre of the
screen
|
Compared to average |
Largest negative deviation |
-14.92% |
|
Largest positive deviation |
+19.51% |
|
|
Compared to centre |
Largest negative deviation |
-14.58% |
|
Largest positive deviation |
+19.99% |
For black it’s not practical to look at the colour difference in ∆E, because it would largely depend on what you normalize to. When normalized to the average brightness of a white screen both ∆E94 and ∆E00 are < 0.60 for all transitions. However, if the brightest colour on the screen when comparing black across the screen is not white, these values can be much higher. Therefore we’ll only look at the relative deviation in brightness for black. The uniformity of black is quite good. When compared to white the values might indicate otherwise, but with black larger deviations are acceptable to achieve the same perceptual uniformity. Displays with a lot of backlight bleeding can have deviations in black level in excess of 100%. The measured deviation of -15% / +20% is acceptable in most cases and as said before actually quite good.
![]()
Contrast Uniformity
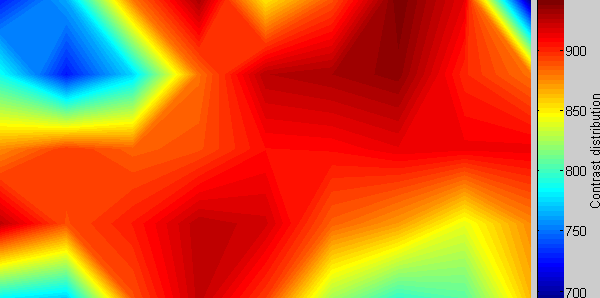
calculated
contrast ratio across the screen
The above image is the result of dividing the brightness results of white by the brightness results of black.
|
Total |
Minimum |
693:1 |
|
Average |
868:1 |
|
|
Highest 80% |
Minimum |
807:1 |
|
Average |
895:1 |
Considering the centre contrast is 920:1 at brightness setting 90 (default), the contrast uniformity is quite decent with an average of 868:1. Only the both of the top corners show a far lower contrast: 729:1 in the top left corner and 693:1 in the top right corner.
![]()
Backlight Leakage
The brightness uniformity test of black already showed that the panels suffers from a little backlight bleeding, but actually it’s quite well under control. When looking at a completely black screen in a darkened room at default settings it’s visible, but when the screen is calibrated to 120 cd/m² for white it’s already hardly noticeable. Under normal conditions it should not be a problem.
|
Quoted G2G Response Time |
5ms G2G |
|
Quoted ISO Response Time |
12ms |
|
Panel Manufacturer and Technology |
Samsung PLS |
|
Panel Part |
LTM270DL06 |
|
Overdrive Used |
Yes |
|
Overdrive Control Available to User |
'Overdrive' |
|
Overdrive Settings |
Off, Weak, Medium, Strong |
The q2770Pqu is rated by AOC as having a 5ms G2G response time
which indicates the panel uses
overdrive /
response time compensation (RTC) technology to boost pixel transitions
across grey to grey changes. There is user control over the overdrive impulse
within the OSD menu using the 'overdrive' option. The
part
being used is the
Samsung LTM270DL06 PLS (Plane to Line Switching) panel. Have a read about response time in
our
specs section if you need additional information about this measurement.
The liquid crystals in the panel have a certain transition time to go from one state to the other. The consequence of this is that for a short period of time both the old and new image are visible. This is called ghosting. A little ghosting can actually be desirable, as it makes moving images appear more fluent. However, too much ghosting will cause images to appear blurry. Most display technologies have more ghosting than desirable, among which is PLS. To improve transition times, displays often incorporate overdrive technologies, sometimes abbreviated as RTC (Response Time Compensation). The downside of this is that strong overdrive often causes an overshoot, resulting in a halo, which looks a bit like a ghost with inversed colours.
The q2770Pqu has four overdrive modes that can be selected from the OSD. The ghosting has been tested for each of these modes using the PixPerAn tool. When capturing photos in each mode you tend to get various different examples as shown by the pictures below. For each overdrive mode (off, weak, medium and strong) we've included a table showing approximately how many of the photos captured fall into each category.
|
Overdrive mode |
Halo |
Ghost |
2x Halo |
Ghost + Halo |
2x Ghost |
|
Off |
|
29% |
|
|
71% |
|
Weak |
|
40% |
|
|
60% |
|
Medium (default) |
26% |
35% |
|
39% |
|
|
Strong |
33% |
|
19% |
48% |
|
So for example, the "off" setting results in 29% of the photos looking like the "ghost" picture below and 71% looking like the 2x ghost picture. The default "medium" setting results in 26% of the pictures looking like the halo image, 35% looking like the ghost image and 39% looking like the ghost + halo image.
Overdrive = Off


ghost (29%), and
2x ghost (71%)
Overdrive = Weak
ghost (40%), and
2x ghost (60%)
Overdrive = Medium


halo (26%) top left, ghost (35%) top right,
and ghost and halo (39%) at bottom
Overdrive = Strong


halo (33%) top
left, two halos (19%) top right,
and ghost and halo (48%) at bottom
The results show that the default mode, medium, is probably the best setting in most cases. The overshoot in this mode is moderate, making a halo less obvious than a ghost. In this mode ghosting is hardly noticeable under normal circumstances. With the overdrive turned off, or at its lowest setting, ghosting is easily noticeable. At the highest setting the overshoot is so high that the halos are actually worse than the ghosts.
Display Modes
Frame Rates
After seeing how far the Iiyama Vision Master Pro 451 (A902MT) CRT monitor (used as a reference in the display lag test below) could be pushed with Custom Resolution Utility, the same was done for the q2770Pqu. The more so because both the EDID and the manual specified multiple display modes at frequencies higher than 60 Hz and the vertical scan range is specified in the manual as 50-76 Hz.
|
Connection |
Default maximum |
Real maximum |
|
DisplayPort |
2560x1440@60Hz |
2560x1440@80Hz |
|
HDMI |
2560x1440@60Hz |
2560x1440@73Hz |
|
DVI |
2560x1440@60Hz |
2560x1440@80Hz |
|
VGA |
1920x1080@60Hz |
2560x1440@80Hz |
At first it appeared that the q2770Pqu performed well beyond its specifications here, with a maximum supported display mode of 2560x1440@80Hz for DP, HDMI and VGA, 73 Hz on HDMI. Because that would be a nice feature for gamers the ghosting (motion blur) test was performed again at 80 Hz. However, while performing that test it immediately became clear that the panel was not actually running at 80 Hz. The Extra section in the OSD showed that the display did receive the expected signal from the graphics card: 2560x1440@80Hz, 73 Hz for HDMI. But apparently the controller converts the 80 Hz signal to a 60 Hz signal by dropping frames. This results in a stuttering motion with moving images.
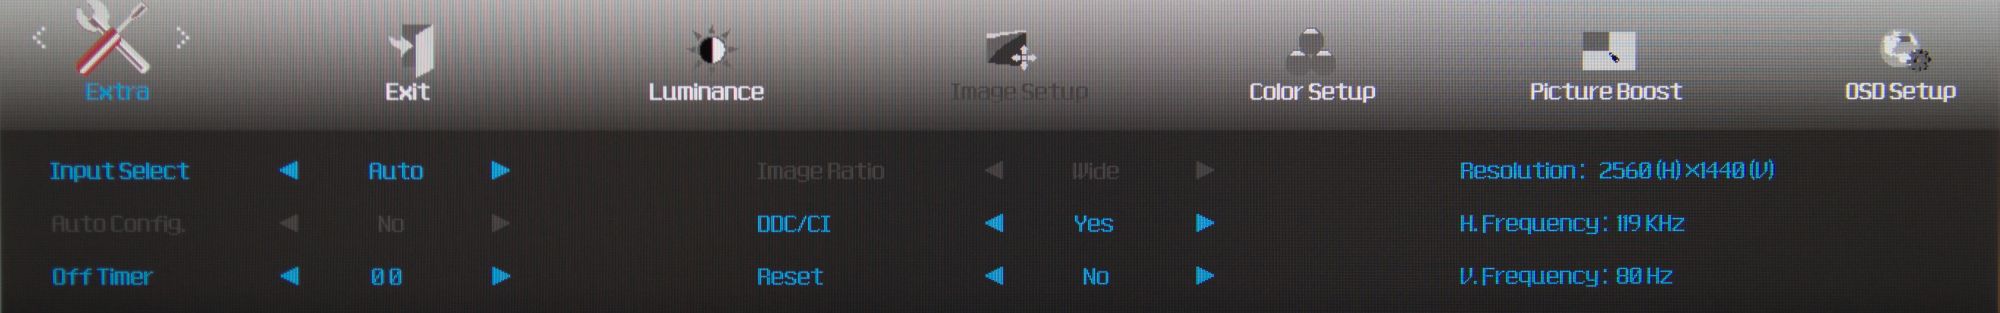
Extra section in OSD showing the signal received from the graphics
card: 80 Hz for DP, DVI and VGA
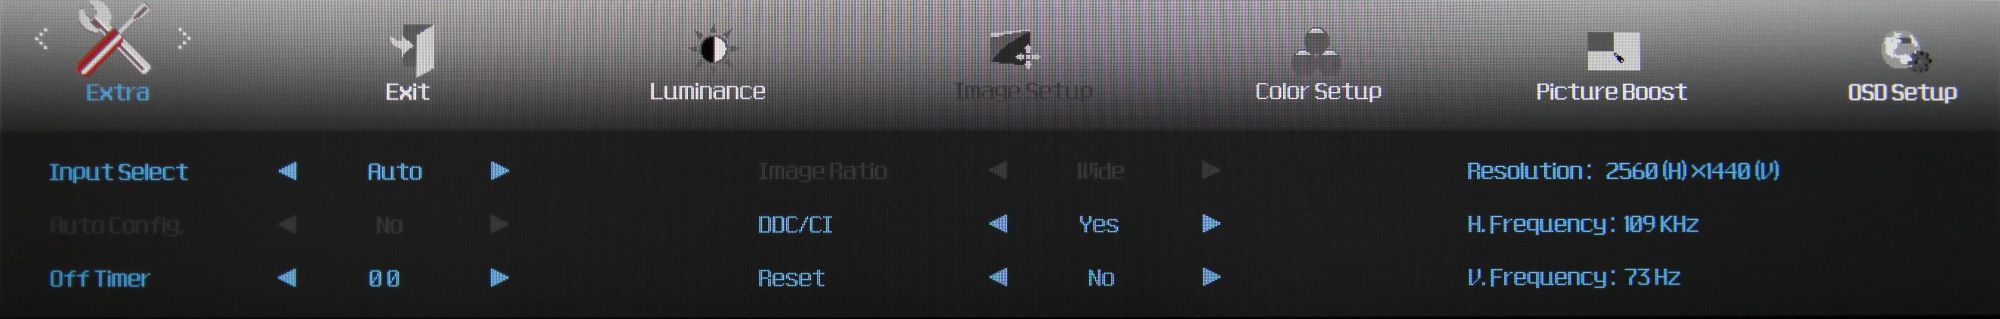
Extra section in OSD showing the signal received from the graphics
card: 73 Hz for HDMI
This not only happened at 2560x1440@80Hz, but for all frequencies higher than 60 Hz at any resolution and over any connection, including the natively supported display modes specified by the EDID and manual with frequencies higher than 60 Hz. It is still nice that the q2770Pqu supports the native display mode of 2560x1440@60Hz by default on DP, HDMI and DVI and with some tweaking also on VGA. But the display shouldn’t have any trouble with correctly displaying display modes specified by the manual and EDID. Especially since the whole point of the EDID is that you can only send a signal to the display that it can render correctly.
For video playback, especially from non-computer devices, it can be useful if the display can run at the actual frame rate of the source. This was only tested over HDMI, because it is most likely that that connection is used. All common video frame rates up to 60 Hz (listed below) give a correct image (no artefacts). However, without an oscilloscope it is hard to determine if the panel runs at the correct frequency. The lowest input frequency supported (over HDMI) is 8 Hz.
-
23.976 Hz
-
24 Hz
-
25 Hz
-
29.97 Hz
-
30 Hz
-
47.952 Hz
-
48 Hz
-
50 HZ
-
59.94 HZ
-
60 Hz
When looking at motion blur tests, like PixPerAn, you do get the idea that the panel is still running at 60 Hz and that the frame rate of the input is converted to 60 Hz, because the motion does not look very fluent. But at the lower frequencies that might just as well be because the frequency is simply too low for the motion to appear fluent. Regardless of whether the frame rate the panel runs at corresponds with the input signal, the q2770Pqu probably still isn’t the best solution for video playback from external sources, because nowhere in the OSD and manual is there any mentioning of YPBPR / YCBCR. Therefore it’s safe to assume that the q2770Pqu only supports RGB video signals.
Scaling and interpolation
All the resolutions supported by the q2770Pqu were tested over DisplayPort and HDMI. They performed identical, except for the resolutions 1920x1080 and 1280x720 (see note below table).
|
Resolution |
Maximum screen height and/or width used |
Correct aspect ratio |
Scaling factor |
Quality of interpolation |
|
|
Decimal value |
Fractional value |
||||
|
800x600 |
Y |
Y |
2.400 : 1 |
12:5 |
Satisfactory |
|
1024x768 |
Y |
Y |
1.875 : 1 |
15:8 |
Good |
|
1152x648 |
N |
Y |
2.000 : 1 |
2:1 |
Very good |
|
1280x720 |
Y |
Y |
2.000 : 1 |
2:1 |
Very good |
|
1280x768 |
N |
Y |
1.500 : 1 |
3:2 |
Very good |
|
1280x960 |
Y |
Y |
1.500 : 1 |
3:2 |
Very good |
|
1280x1024 |
Y |
N, 4:3 |
1.500 : 1 H |
3:2 H |
Good |
|
1440x900 |
Y |
N, 16:9 |
1.778 : 1 H |
16:9 H |
Good |
|
1600x900 |
Y |
N, 160:81 |
1.600 : 1 H |
8:5 H |
Mediocre |
|
1600x1200 |
Y |
Y |
1.200 : 1 |
6:5 |
Very good |
|
1680x1050 |
Y |
N, 16:9 |
1.524 : 1 H |
32:21 H |
Good |
|
1776x1000 |
N |
Y |
1.333 : 1 |
4:3 |
Very good |
|
1792x1344 |
Y |
Y |
1.071 : 1 |
15:14 |
Satisfactory |
|
1800x1440 |
Y |
Y |
1.000 : 1 |
1:1 |
N/A |
|
1856x1392 |
Y |
Y |
1.034 : 1 |
30:29 |
Mediocre |
|
1920x1080 |
Y |
Y |
1.333 : 1 |
4:3 |
Very good |
|
1920x1200 |
Y |
Y |
1.200 : 1 |
6:5 |
Good |
|
1920x1440 |
Y |
Y |
1.000 : 1 |
1:1 |
N/A |
|
2048x1440 |
Y |
Y |
1.000 : 1 |
1:1 |
N/A |
|
2560x1440 |
Y |
Y |
1.000 : 1 |
1:1 |
N/A |
H = horizontal scaling factor
Note: when connecting the display over HDMI with an AMD graphics card the driver may automatically underscan at 1920x1080 and 1280x720 (this occurred with both XFX Radeon HD7970 Black Edition Double Dissipation and AMD FirePro Mobility M5950). This is probably because HD-TV’s typically show overscan when connecting a computer and use these resolutions. This results in scaling factors of 92:75 and 46:25 respectively, rather than 4:3 and 2:1, which causes terrible interpolation. This can be solved by turning on the scaling option in the graphics card driver and setting the value to 0%.
The results in the table show that it is not as simple as just scaling the resolution up to 16:9 full screen or 4:3 full height. The resolutions 1152x648, 1280x768 and 1776x1000 have black borders all around, resulting in more favourable scaling factors of 2:1, 3:2 and 4:3 respectively. Furthermore, 1280x768 has a 5:3 aspect ratio, but it’s still reproduced correctly.
Surprisingly, 1600x900 is not reproduced correctly, but with non square pixels with a width to height ratio of 10:9, just as the 16:10 resolutions 1440x900 and 1680x1050. Also surprising, but in a positive way, is that 1800x1440 (5:4) and 2048x1440 (64:45) are reproduced in the correct aspect ratio. The same did not apply for other resolutions with common aspect ratios and a height of 1440 pixels when added with Custom Resolution Utility 1.1.2. In fact, none of the tested custom resolutions with aspect ratios other than 16:9 or 4:3 were reproduced in the correct aspect ratio.
![]()
Additional Gaming Features
Aspect Ratio Control - The q2770Pqu has two options for aspect ratio control through the OSD 'screen' menu. There are options for "wide" (16:9 most of the time, but not always - see display modes section) and 4:3. There is no automatic "aspect" control option or 1:1 pixel mapping provided so options are somewhat limited, especially for external devices.
Preset Modes -
There are no specific gaming preset modes
available in the OSD other than a defined ECO mode, which only locks the
brightness at a specific level (60%) and has no impact on any other aspect of
the picture. Maybe handy if you want to quickly jump from your calibrated user
mode to a 60% brightness for games which will probably boost brightness compared
with your calibrated state.
![]()
Lag
We have written an in depth article about input lag and the various measurement techniques which are used to evaluate this aspect of a display. It's important to first of all understand the different methods available and also what this lag means to you as an end-user.
Input Lag vs. Display Lag vs. Signal Processing
To avoid confusion with different terminology we will refer to this section of our reviews as just "lag" from now on, as there are a few different aspects to consider, and different interpretations of the term "input lag". We will consider the following points here as much as possible. The overall "display lag" is the first, that being the delay between the image being shown on the TFT display and that being shown on a CRT. This is what many people will know as input lag and originally was the measure made to explain why the image is a little behind when using a CRT. The older stopwatch based methods were the common way to measure this in the past, but through advanced studies have been shown to be quite inaccurate. As a result, more advanced tools like SMTT provide a method to measure that delay between a TFT and CRT while removing the inaccuracies of older stopwatch methods.
In reality that lag / delay is caused by a combination of two things - the signal processing delay caused by the TFT electronics / scaler, and the response time of the pixels themselves. Most "input lag" measurements over the years have always been based on the overall display lag (signal processing + response time) and indeed the SMTT tool is based on this visual difference between a CRT and TFT and so measures the overall display lag. In practice the signal processing is the element which gives the feel of lag to the user, and the response time of course can impact blurring, and overall image quality in moving scenes. As people become more aware of lag as a possible issue, we are of course keen to try and understand the split between the two as much as possible to give a complete picture.
The signal processing element within that is quite hard to identify without extremely high end equipment and very complicated methods. In fact the studies by Thomas Thiemann which really kicked this whole thing off were based on equipment worth >100,000 Euro, requiring extremely high bandwidths and very complicated methods to trigger the correct behaviour and accurately measure the signal processing on its own. Other techniques which are being used since are not conducted by Thomas (he is a freelance writer) or based on this equipment or technique, and may also be subject to other errors or inaccuracies based on our conversations with him since. It's very hard as a result to produce a technique which will measure just the signal processing on its own unfortunately. Many measurement techniques are also not explained and so it is important to try and get a picture from various sources if possible to make an informed judgement about a display overall.
For our tests we will continue to use the SMTT tool to measure the overall "display lag". From there we can use our oscilloscope system to measure the response time across a wide range of grey to grey (G2G) transitions as recorded in our response time tests. Since SMTT will not include the full response time within its measurements, after speaking with Thomas further about the situation we will subtract half of the average G2G response time from the total display lag. This should allow us to give a good estimation of how much of the overall lag is attributable to the signal processing element on its own.
Lag Classification
To help in this section we will also introduce a broader classification system
for these results to help categorise each screen as one of the following levels:
-
Class 1) Less than 16ms / 1 frame lag - should be fine for gamers, even at high levels
-
Class 2) A lag of 16 - 32ms / One to two frames - moderate lag but should be fine for many gamers. Caution advised for serious gaming and FPS
-
Class 3) A lag of more than 32ms / more than 2 frames - Some noticeable lag in daily usage, not suitable for high end gaming
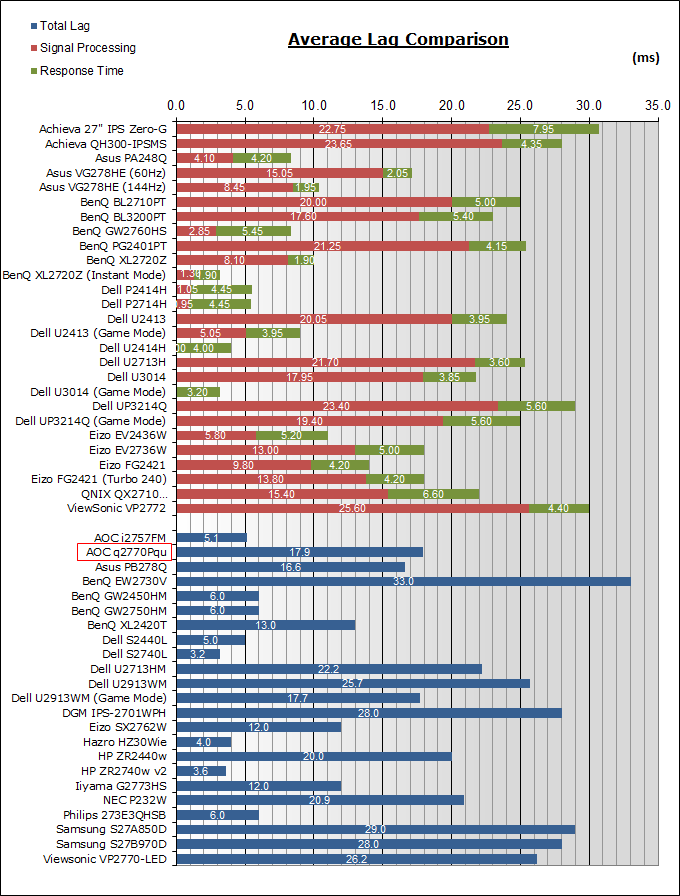
For the full reviews of the models compared here and the dates they were written (and when screens were approximately released to the market), please see our full reviews index.
|
Class 2 |
For the display lag test an iiyama Vision Master Pro 451 (A902MT) CRT monitor
was used as reference. It was connected to graphics card by VGA with the use of
a DVI-I to VGA adapter. It ran in clone mode with the q2770Pqu at
2560x1440@60Hz. To enable this resolution on the CRT monitor Custom Resolution
Utility 1.1.2 was used. Both displays were photographed in a single frame at a
shutter speed of 1/400 s with the Canon EOS 600D. At least 50 photos were taken
for each overdrive mode of the display. Because the total display lag also
depends on the display’s response times, it was tested for all overdrive modes.
|
Overdrive mode |
Display lag (ms) |
|
Off |
18.1 |
|
Weak |
17.9 |
|
Medium (default) |
17.9 |
|
Strong |
17.7 |
The total display lag as measured by SMTT 2.0 averages out at 17.9 ms, which means that at the 60 Hz refresh rate of the q2770Pqu the image on screen lags 1.074 frames behind. It could very well be that the whole frame is buffered before the panel starts building it up line by line. This should not be a problem for most users, but hardcore gamers may find this too slow. It was not possible to accurately measure the G2G response times to calculate the relevant response time element of that overall lag.
We have provided a comparison above against other models we have tested to give an indication between screens. Those shown with blue bars in the bottom half represent the total "display lag" as at the time of review we did not have access to an oscilloscope system to measure the response time element and provide an estimation of the signal processing. The screens tested more recently in the top half are split into two measurements which are based on our overall display lag tests (using SMTT) and half the average G2G response time, as measured by the oscilloscope. The response time is split from the overall display lag and shown on the graph as the green bar. From there, the signal processing (red bar) can be provided as a good estimation.
The AOC q2770Pqu is a very interesting display when you are looking for a 2560x1440 27” display on a budget for all-round/office use. Out of all the alternatives it is the cheapest at around £ 360. Its biggest strengths are the excellent viewing angles, the very high energy efficiency and AOC’s excellent warranty and service policy. We were somewhat disappointed though with the out of the box performance: the gamma curve and white balance can both use a calibration. However, once calibrated the q2770Pqu performs very well. Something to keep in mind though is that the very saturated red and blue primaries can make it hard to calibrate with consumer grade colorimeters. With spectrophotometers this shouldn’t be a problem. The upside of the slightly larger than average gamut is that it covers the sRGB colour space completely. Despite the very good calibrated performance, the q2770Pqu isn’t a very good option for people in the graphics industry, because of the rather mediocre uniformity. With the naked eye it’s very hard to see, but the difference in brightness is fairly large. However, both extremes are found at the edges of the screen, so if you don’t maximize your work area to full screen the screen actually performs quite well here. The contrast ratio is decent for a PLS panel, but compared to some recent AH-IPS panels with contrast ratios in excess of 1100:1 it’s already quite low. This is even more pronounced when comparing to Vertical Alignment panels, which sometimes have static contrast ratios approximating 5000:1, like the Eizo Foris FG2421. The brightness adjustment range is very good though, ranging from roughly 70 to 280 cd/m² for white.
The q2770Pqu is also a decent option for gamers, because of the good panel responsiveness without any noticeable overshoot and an acceptable display lag of about one frame. Hardcore gamers might want to look for faster screens though. But where the q2770Pqu comes most into its own is with office applications. For those neither a perfect gamma curve nor white balance is required, the same applies to responsiveness and lag. What you do want from an office screen is an adjustable stand to ensure ergonomic use, a stable backlight output (no PWM) so that it’s easier on the eyes with prolonged use, wide viewing angles to allow multi monitor setups, high energy efficiency and an excellent warranty. All of these things the q2770Pqu can deliver and at a very reasonable price.
This review is also available in Dutch at Tweakers.net
|
Pros |
Cons |
|
Very high energy efficiency |
Out of the box performance (gamma & white balance) |
|
Excellent viewing angles |
Gamma modes have unusual gamma values |
|
3 years warranty with on-site exchange |
Mediocre uniformity of white |
|
Brightness adjustment range |
Contrast ratio not that high |
|
100.0% sRGB coverage (CIE 1931) |
Difficult to calibrate with colorimeter |
|
PWM free |
Display lag more than one frame |
|
Negligible off angle glow with dark content |
Easily press wrong button when changing OSD settings |
|
Pixel fault class I (ISO9241-307) |
1:1 pixel mapping not supported |
|
Stand adjustments |
No scaling support for 16:10 and 5:4 aspect ratios |
|
All display input cables supplied with display |
|
![]()
Support TFTCentral,
buy the AOC q2770Pqu using our affiliate link
|
|
If you have enjoyed this review and found it useful, please consider making a small donation to the site. |
