Introduction
We have with us now the new Philips
328P6AUBREB display, a screen which is 31.5" in size and features a 2560 x 1440
resolution. The IPS based screen is aimed primarily at HDR uses, being promoted
heavily in the spec sheets. There is also a wide colour gamut backlight offered
on this model, supporting >100% sRGB and 99% Adobe RGB coverage and this is
along with a 10-bit colour depth. This isn't specifically aimed at
professional uses despite the wide gamut support, but there is also an added
uniformity correction feature on this screen. Simple connectivity is possible
through the addition of a USB 3.1 type-C interface , with DisplayPort 1.2 and
HDMI 2.0 also being offered.
If you appreciate the review and enjoy reading and like our work, we would welcome a
donation
to the site to help us continue to make quality and detailed reviews for you.
Specifications and Features
The following table gives detailed information
about the specs of the screen as advertised:
|
Monitor
Specifications |
|
Size |
31.5" |
Panel Coating |
Light AG coating |
|
Aspect Ratio |
16:9 |
Interfaces |
1x DisplayPort
1.2, 1x HDMI 2.0, 1x USB 3.1 type-C, 1x D-sub VGA
|
|
Resolution |
2560 x 1440 |
|
Pixel Pitch |
0.2727mm, 93 PPI |
Design
colour |
Matte black bezels and base
with silver trim stand |
|
Response Time |
4ms G2G |
Ergonomics |
Tilt, 180mm height, swivel, rotate |
|
Static Contrast Ratio |
1200:1 |
|
Dynamic Contrast Ratio |
50 million:1 |
VESA Compatible |
Yes 100mm |
|
Brightness |
450 cd/m2 |
Accessories |
DisplayPort,
HDMI, USB type-C to USB C, USB C to USB A, audio, power cables |
|
Viewing Angles |
178 / 178 |
|
Panel Technology |
TP Vision IPS-type |
Weight |
with stand: 9.70 Kg |
|
Backlight Technology |
W-LED |
Physical Dimensions |
(WxHxD) with stand
742 x 657 x 270 mm |
|
Colour Depth |
1.07b (8-bit + FRC) |
|
Refresh Rate |
60Hz |
Special
Features |
Smart Uniformity mode,
Factory calibration, audio input, headphone output, RJ45 Ethernet
connection, 2x USB 3.0 ports (with fast charging), 2x 3W speakers,
HDR support |
|
Colour Gamut |
Wide gamut including
100% sRGB
99% Adobe RGB |
The 328P6A (we'll use this shortened name
throughout the review for simplicity) offers a good range of
modern connectivity
options with 1x DisplayPort 1.2, 1x HDMI 2.0 and 1x USB 3.1 type-C
connections offered. There's even an old school D-sub VGA connection which we haven't
seen used for a long time really. The
digital interfaces are HDCP certified for encrypted content and the video cables
are provided in the box for all the connections which is great news.
The screen has an internal power supply and
comes packaged with the power cable you need. There are also 2x USB 3.0 ports located on the back of
the screen with the video connections (with fast charging support). An audio in
and a headphone out connection are also provided
if you need them along with integrated 2x 3W stereo speakers.
Below is a summary of the features and connections
of the screen:
|
Feature |
Yes / No |
Feature |
Yes / No |
|
Tilt adjust |
 |
DVI |
 |
|
Height adjust |
|
HDMI |
|
|
Swivel adjust |
|
D-sub |
|
|
Rotate adjust |
|
DisplayPort |
|
|
VESA compliant |
|
Component |
|
|
USB 2.0 Ports |
|
Audio connection |
|
|
USB 3.0 Ports |
|
HDCP Support |
|
|
Card Reader |
|
MHL Support |
|
|
Ambient Light Sensor |
|
Integrated Speakers |
|
|
Human Motion Sensor |
|
PiP / PbP |
|
|
Touch Screen |
|
Blur Reduction Mode |
|
|
Factory calibration |
|
G-Sync |
|
|
Hardware calibration |
|
FreeSync |
|
|
Uniformity correction |
|
Wireless charging |
|
|
Check Pricing and Buy - Direct Links
|
|
Amazon
|
|
TFTCentral is a participant
in the Amazon Services LLC Associates Programme, an affiliate
advertising programme designed to provide a means for sites to earn
advertising fees by advertising and linking to Amazon.com, Amazon.co.uk,
Amazon.de, Amazon.ca and other Amazon stores worldwide. We also
participate in a similar scheme for Overclockers.co.uk. |
Design and Ergonomics
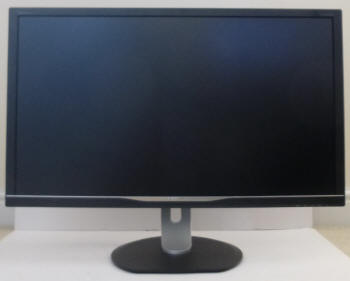
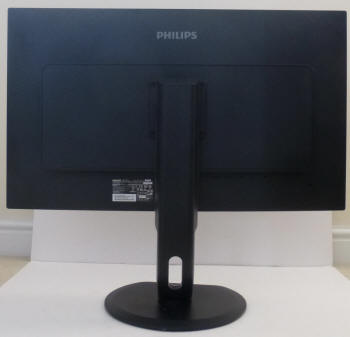
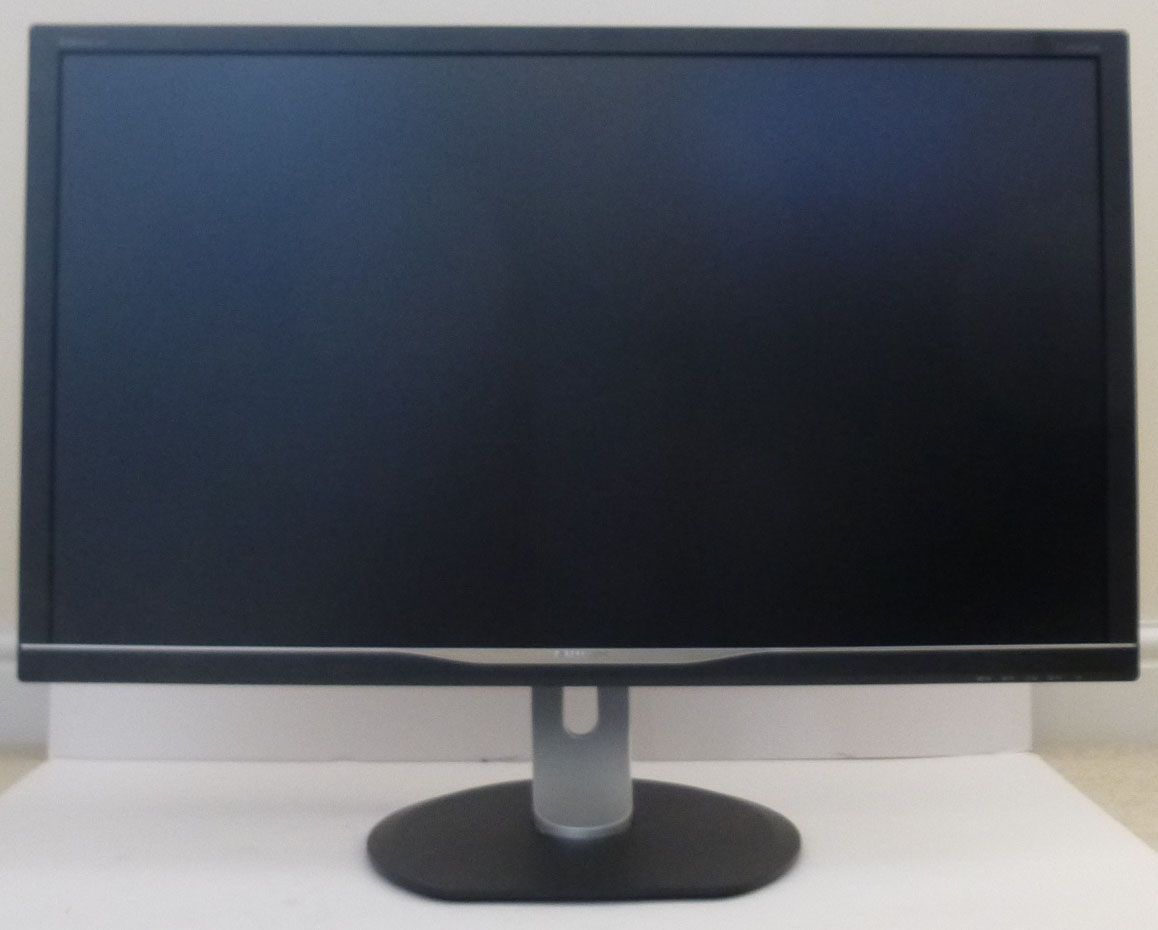
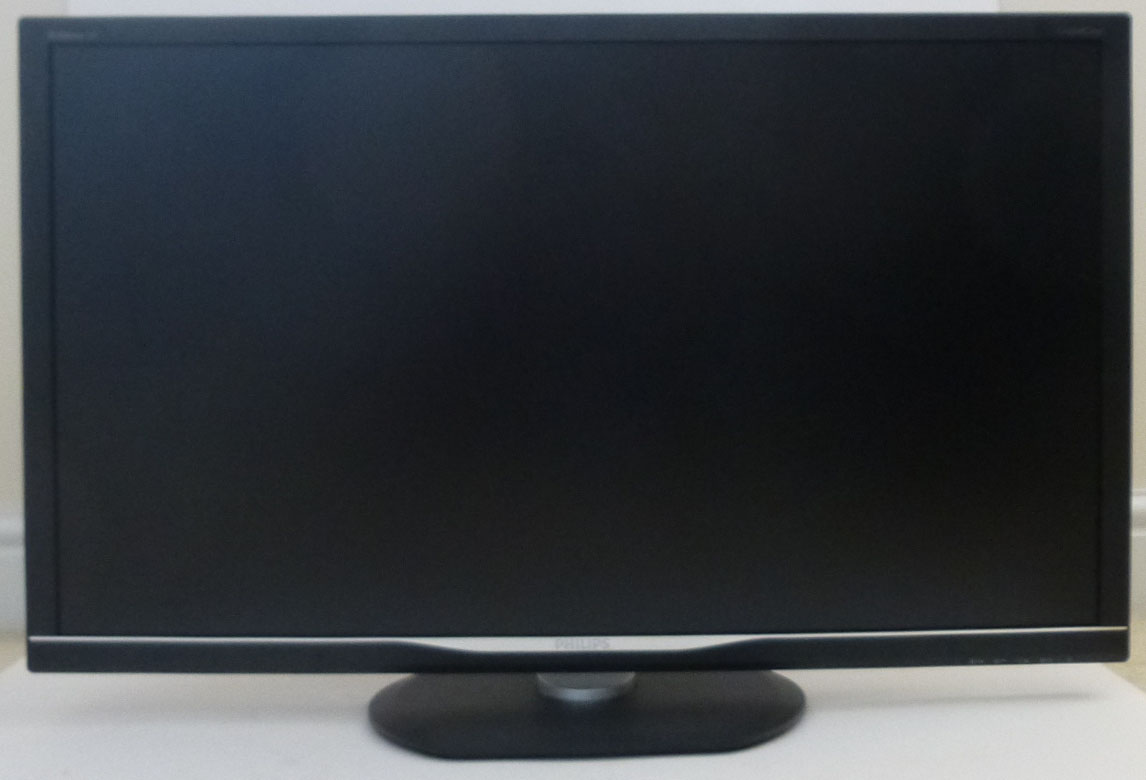
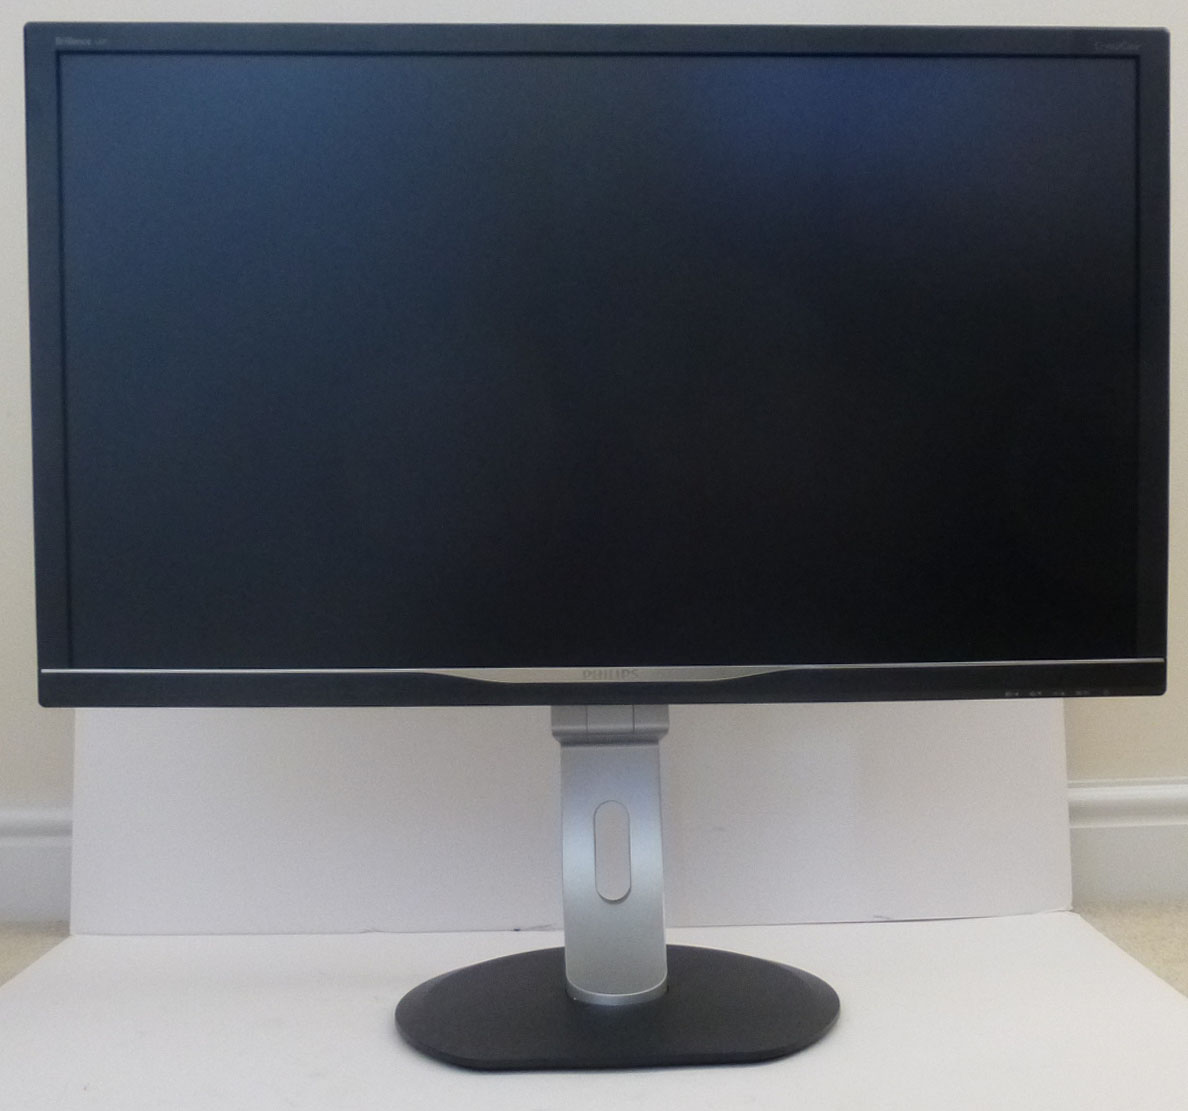
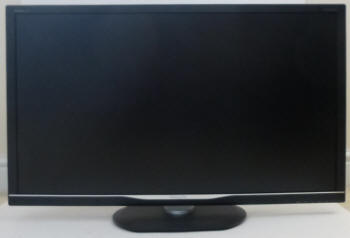
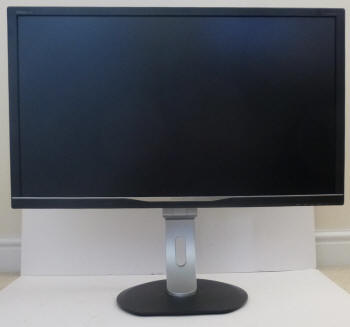
Above: front and back views of the screen, click for larger versions
The 328P6A comes in a mostly black design,
with matte plastics used for the edge/bezel of the display and for the base of
the stand. There is a thin shiny metallic trim along the bottom bezel with a
Philips logo in the centre, and the
arm of the stand if finished in a matte light silver colour. There is a fairly thick
(by modern standards) black bezel around all 4 sides of the screen. This
measures 18mm along the sides, 21mm along the top edge and 25mm along the bottom
edge.
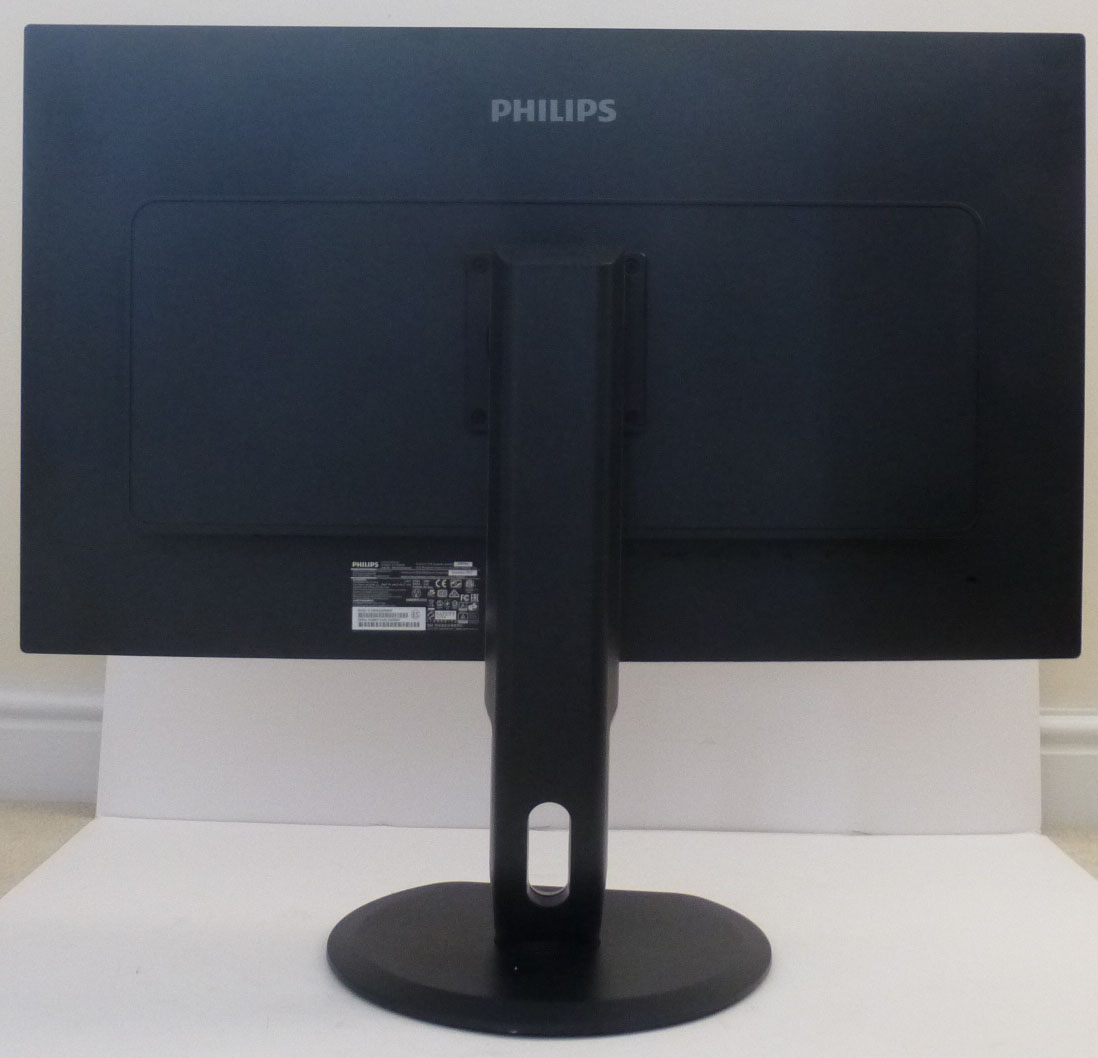
The back of the screen is enclosed in a matte
black plastic. The stand attaches as
shown above in the centre and has to be screwed in to place, but can be removed if you want to VESA 100 mount the display
instead. There is a useful cable tidy hole on the back of the stand as you can
see above.
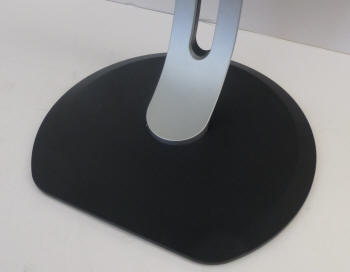
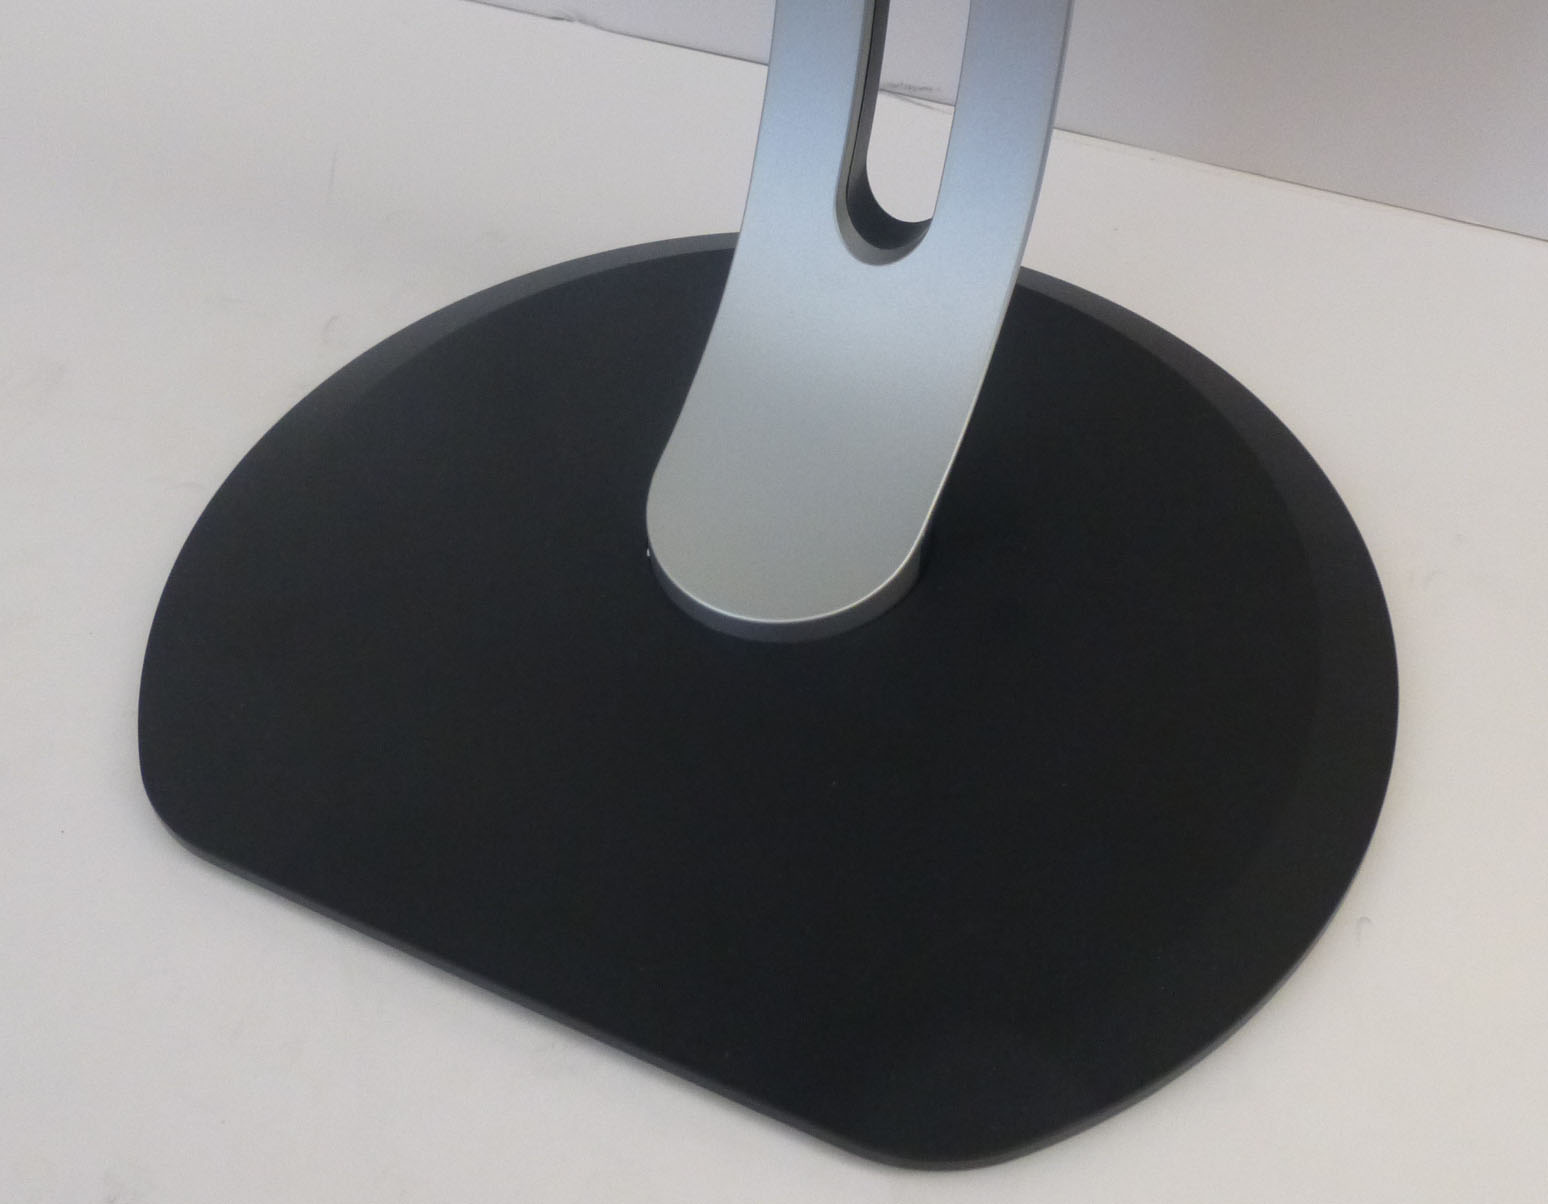
Above: view of the base of the stand. Click for larger version
The base of the stand is finished in a
black colour plastic and the arm is a silver coloured plastic . It
provides a reasonably sturdy base for the large screen size although it
does wobble a bit side to side when you reposition the screen.
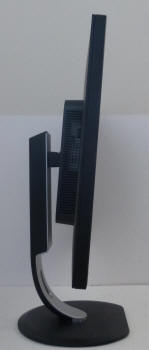
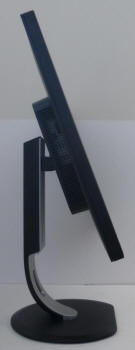
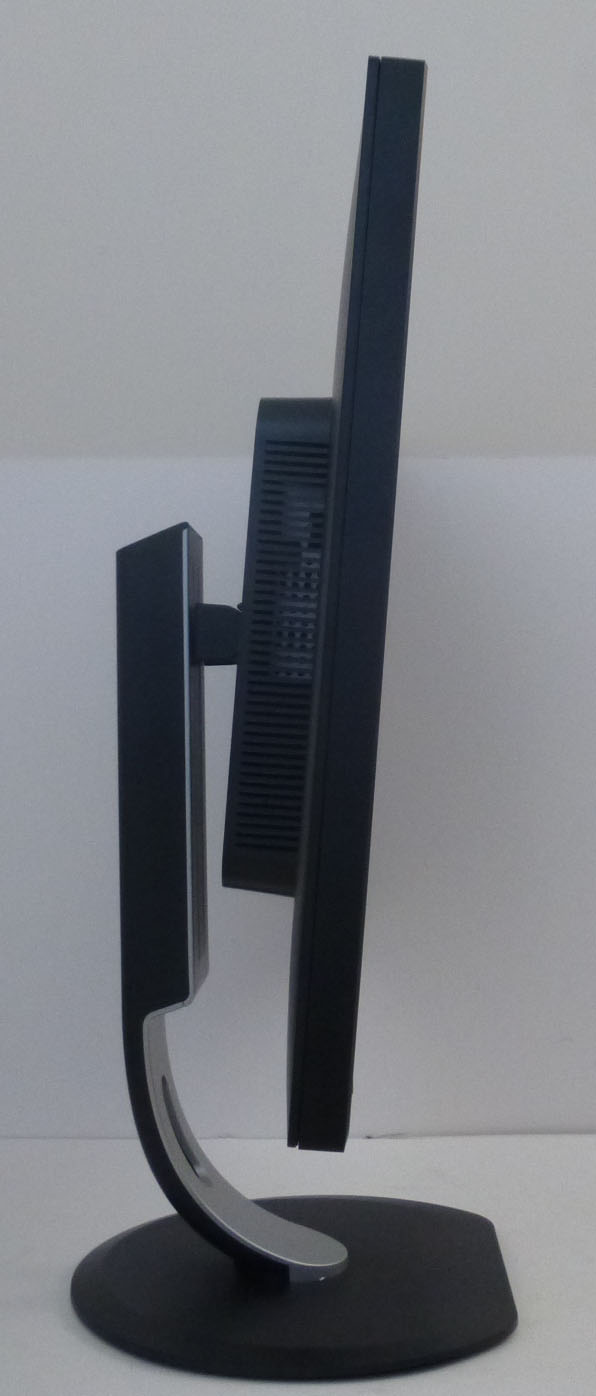
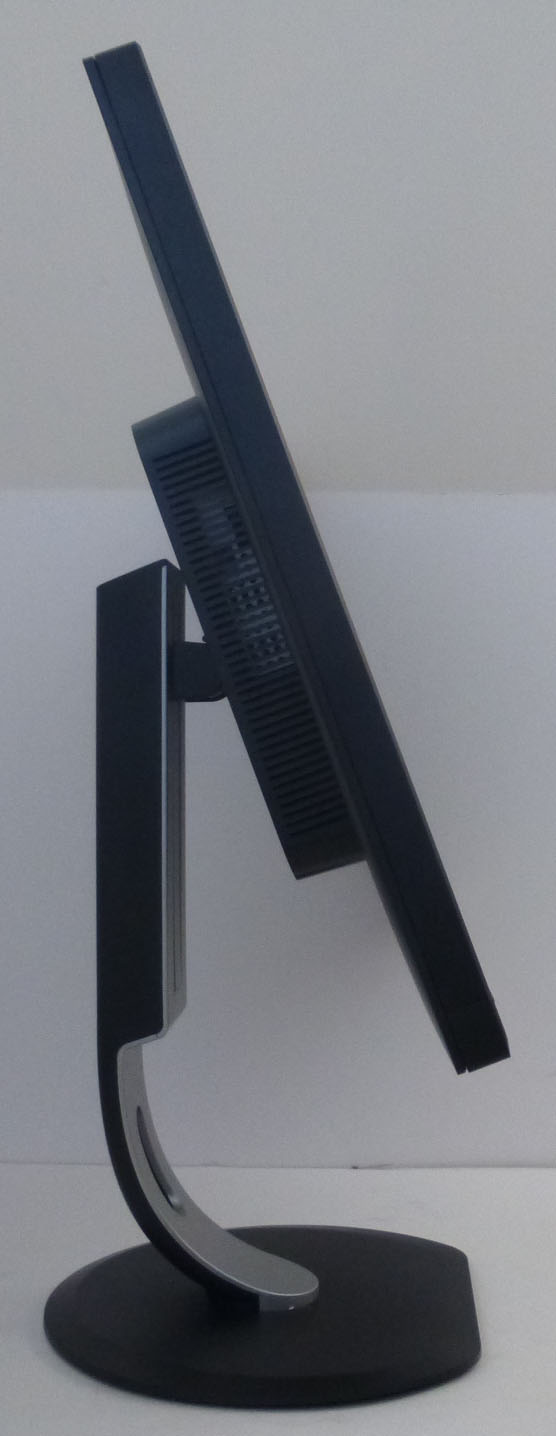
Above: full tilt range shown. Click for larger versions
There is a good set of ergonomic
adjustments offered from this screen. Tilt is smooth but quite stiff to operate,
but offers a pretty good range of adjustments as shown above.
Above: full height adjustment range shown.
Click for larger versions
Height
adjustment is also fairly stiff but offers smooth movements, with a
total adjustment range of 180mm measured, as advertised. At the lowest setting the bottom edge of the
screen is ~45mm from the edge of the desk, and at maximum extension it is
~225mm.
Side to side swivel is also provided and is
also quite stiff but
It provides smooth movement. Rotation adjustment to flip in to portrait mode is
also offer which is fairly smooth but again a little stiff to operate. Overall the stand remains
reasonably stable on
the desk with only a small amount of wobble when you re-position it.
A summary of the ergonomic adjustments
are shown below:
|
Function |
Range |
Smoothness |
Ease of Use |
|
Tilt |
Yes |
Smooth |
Quite stiff |
|
Height |
180mm |
Smooth |
Quite stiff |
|
Swivel |
Yes |
Smooth |
Quite stiff |
|
Rotate |
Yes |
Fairly smooth |
Quite stiff |
|
Overall |
Good set of adjustments.
A little stiff to move but not too bad. |
The materials were of a fairly good standard and the
build quality felt solid. There was no audible noise from the screen,
even when conducting specific tests which can often identify buzzing issues.
The whole screen remained cool even during prolonged use as well which
was pleasing.
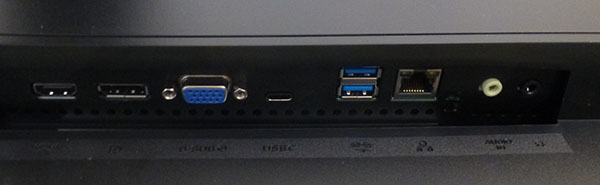
Above: connection options on the back of the screen
The back of the screen features the
connections. There are the HDMI 2.0, DisplayPort 1.2, D-sub VGA and USB type-C connections offered
on the left,
along with 2x USB 3.0, an RJ45 (if you are connecting from a Mac using USB
type-C and want to use the monitor as a hub), an audio
input and headphone output. Note that you will have to use the
USB type-C connection to power the built in USB hub, as there's no standard
USB 3.0 upstream connection on this model. It would have been nice to see some
USB ports on the side of the screen for easier access as well.
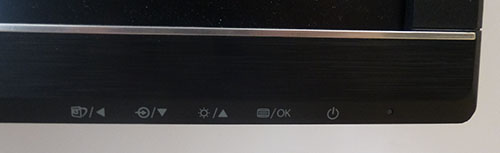
Above: OSD control buttons
on the front bezel
The
OSD is controlled through a series of 5 touch-sensitive buttons located on the
front right hand side of the screen. The buttons are pretty responsive and
navigation was fairly quick, although it was not the most intuitive to
navigate around we found.
Power Consumption
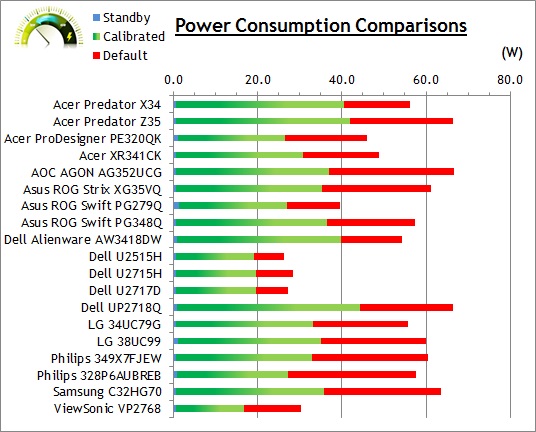
In terms of power consumption the
manufacturer lists typical usage of 32.4W in the ON mode, and <0.5W in standby. We carried out our normal tests to
establish its power consumption ourselves.
|
 |
|
State and Brightness
Setting |
Manufacturer Spec (W) |
Measured Power Usage
(W) |
|
Default (100%) |
32.4 |
57.7 |
|
Calibrated (5%) |
- |
27.1 |
|
Maximum Brightness (100%) |
- |
57.7 |
|
Minimum Brightness (0%) |
- |
25.6 |
|
Standby |
<0.5 |
0.8 |
|
Out of the
box the screen used 57.7W at the default 100% brightness setting. Once calibrated
the screen reached 27.1W consumption, and in standby it used only 0.8W. We have
plotted these results below compared with other screens
we have tested. The consumption (comparing the calibrated states) is a little
higher than most 27" models due to the slightly bigger screen size (and
therefore backlight), but less than the larger 34 - 38" models for the same
reason.
Panel and Backlighting
|
Panel Manufacturer |
TP Vision |
Colour Palette |
1.07 billion |
|
Panel Technology |
IPS-type |
Colour Depth |
8-bit + FRC |
|
Panel Module |
TPT31585-QHBN0.K |
Colour space |
Wide Gamut |
|
Backlighting Type |
Wide gamut LED |
Colour space coverage (%) |
Quoted 99% Adobe RGB |
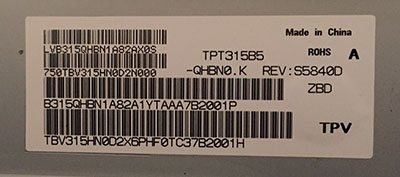
Panel Part and Colour Depth
The Philips 328P6A features a
TP Vision TFT31585-QHBN0.K IPS technology panel which is capable of
producing 1.07 billion colours. TP Vision are associated with Philips and we've
seen their panels used in previous Philips screens as well. A 1.07b colour depth is achieved through a native 8-bit colour depth
and additional FRC stage (8-bit+FRC). Keep in mind whether this 10-bit support
is practically useable for you and whether you're ever going to truly use
that colour depth. You need to have a full 10-bit end to end workflow to take
advantage of it which is still quite expensive to achieve and rare in the
market, certainly for your average user. This includes relevant applications and
graphics cards as well, so to some people this 10-bit support might be
irrelevant.
The panel part is confirmed when dismantling
the screen as shown below:
Screen
Coating
The
screen coating is a light anti-glare (AG) like other modern IPS panels. It
retains its anti-glare properties to avoid too many unwanted reflections of a
full glossy coating, but does not produce an too grainy or dirty an image that
some thicker AG coatings can, including much older IPS panels. There are no
visible cross-hatching patterns on the coating.
Backlight Type and Colour Gamut
The screen uses a
wide gamut LED backlight
unit which offers a colour gamut beyond the standard sRGB space of normal W-LED
units. This allows wide coverage of colour spaces such as Adobe RGB (99%
coverage quoted) and DCI-P3
for those who want to work with or view wider gamut content.
You need to be mindful that the backlight is
a wide gamut type as not everyone wants or needs a wide gamut screen, and you do
certainly pay a premium to have it. It can help produce more vivid and colourful
images which are often preferred for multimedia use, and certainly for HDR
content where boosted colours is part of the attraction. However, for colour critical work it can lead to oversaturation of
colours and unrealistic and "inaccurate" tones unless you are working with
specific wide gamut content in a colour managed workflow. There is also an sRGB
emulation mode offered by the screen which we will look at later on as well. If you want to read
more about colour spaces and gamut then please have a read of our
detailed article.
Backlight
Dimming and Flicker
We tested the screen to establish the methods used
to control backlight dimming. Our in depth article talks in more details about a
previously very common method used for this which is called
Pulse Width Modulation (PWM). This in itself gives cause for concern to some
users who have experienced eye strain, headaches and other symptoms as a result
of the flickering backlight caused by this technology. We use a photosensor +
oscilloscope system to measure backlight dimming control
with a high level of accuracy and ease. These tests allow us to establish
1) Whether PWM is being used to control the
backlight
2) The frequency and other characteristics at which this operates, if it is used
3) Whether a flicker may be introduced or potentially noticeable at certain
settings
If PWM is used for backlight dimming, the higher
the frequency, the less likely you are to see artefacts and flicker. The duty
cycle (the time for which the backlight is on) is also important and the shorter
the duty cycle, the more potential there is that you may see flicker. The other
factor which can influence flicker is the amplitude of the PWM, measuring the
difference in brightness output between the 'on' and 'off' states. Please
remember that not every user would notice a flicker from a backlight using PWM,
but it is something to be wary of. It is also a hard thing to quantify as it is
very subjective when talking about whether a user may or may not experience the
side effects.
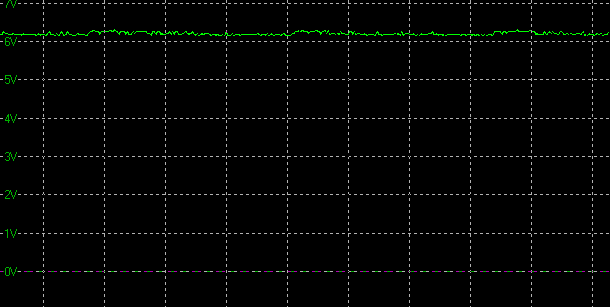
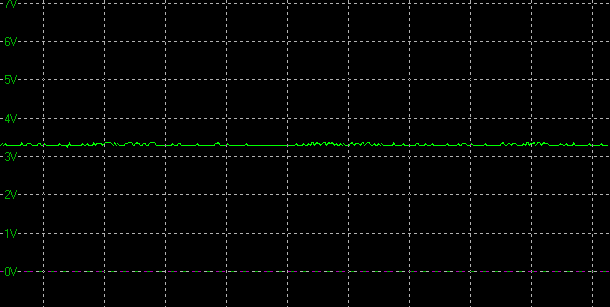
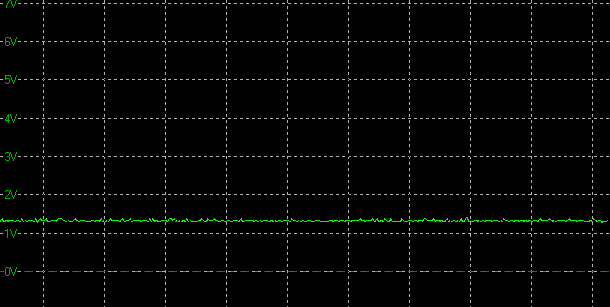
100%
50%
0%
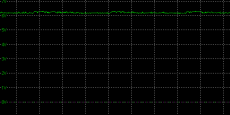
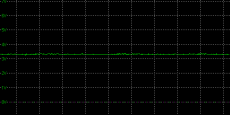
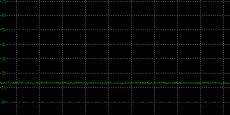
Above scale = 1
horizontal grid = 5ms
At all brightness settings a constant
Direct Current (DC) voltage is applied to the backlight, and the
screen is free from the obvious off/on switching of any PWM dimming method.
As a result, the screen is flicker free.
|
Pulse Width
Modulation Used |
No |
|
Cycling
Frequency |
n/a |
|
Possible
Flicker at |
|
|
100% Brightness |
No |
|
50% Brightness |
No |
|
0% Brightness |
No |
Contrast
Stability and Brightness
We wanted to see how much variance there was in
the screens contrast as we adjusted the monitor setting for brightness.
In theory, brightness and contrast are two independent parameters, and good
contrast is a requirement regardless of the brightness adjustment.
Unfortunately, such is not always the case in practice. We recorded the
screens luminance and black depth at various OSD brightness settings, and
calculated the contrast ratio from there. Graphics card settings were left at
default with no ICC profile or calibration active. Tests were made using an
X-rite i1 Display Pro colorimeter. It should be noted that we used the
BasICColor calibration software here to record these, and so luminance at
default settings may vary a little from the LaCie Blue Eye Pro report.
|
OSD
Brightness |
Luminance
(cd/m2) |
Black
Point (cd/m2) |
Contrast
Ratio
( x:1) |
|
100 |
461.11 |
0.39 |
1182 |
|
90 |
419.39 |
0.35 |
1198 |
|
80 |
378.15 |
0.31 |
1220 |
|
70 |
334.32 |
0.28 |
1194 |
|
60 |
291.35 |
0.24 |
1214 |
|
50 |
245.60 |
0.20 |
1228 |
|
40 |
216.95 |
0.18 |
1205 |
|
30 |
187.87 |
0.16 |
1174 |
|
20 |
158.27 |
0.13 |
1217 |
|
10 |
128.29 |
0.11 |
1166 |
|
0 |
97.76 |
0.08 |
1222 |
|
Total Luminance Adjustment Range
(cd/m2) |
363.35 |
Brightness OSD setting controls backlight? |
|
|
Total Black Point
Adjustment Range (cd/m2) |
0.31 |
|
Average Static Contrast Ratio |
1202:1 |
PWM Free? |
|
|
Recommended OSD setting
for 120 cd/m2 |
7 |
At the top end the maximum luminance reached
a very high 461
cd/m2
which was a little higher even than the specified maximum brightness of 450 cd/m2
from the manufacturer. There was a fairly good 363 cd/m2 adjustment range in total,
but at the minimum
setting you could reach down to a fairly moderate luminance of 98 cd/m2. This
might not be quite low enough for some people wanting to work in darkened room conditions with low
ambient light and it doesn't reach as low as some screens. A setting of 7 in the OSD menu should return you a
luminance of around 120 cd/m2 at default settings.
It should be noted
that the brightness regulation is controlled without the need for
Pulse Width Modulation for all
brightness settings so the screen is flicker free.
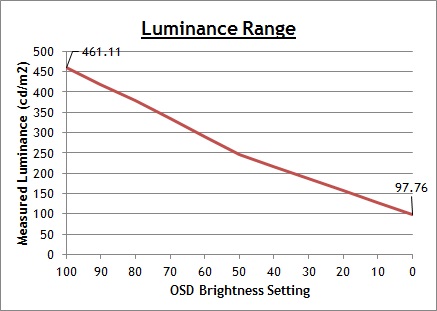
We have plotted the
luminance trend on the graph above. The screen behaves as it should in this
regard, with a reduction in the luminance output of the screen controlled by the
reduction in the OSD brightness setting. This is not quite a linear relationship as you
can see, with the settings between 100 and 50 controlling a slightly steeper
adjustment range than between 50 and 0.
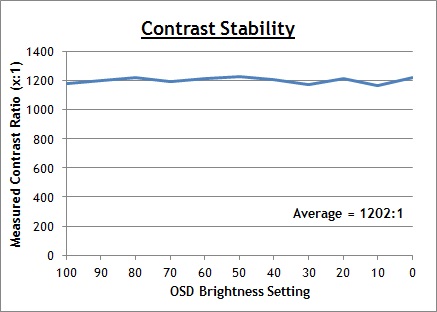
The average contrast ratio of the screen
was excellent for an IPS technology panel, measured at 1202:1. It remained stable across the brightness adjustment range
as shown above.
Testing
Methodology
An
important thing to consider for most users is how a screen will perform out of
the box and with some basic manual adjustments. Since most users won't have
access to hardware colorimeter tools, it is important to understand how the
screen is going to perform in terms of colour accuracy for the average user.
We restored our graphics card to default settings
and disabled any previously active ICC profiles and gamma corrections. The
screen was tested at default factory settings using our new
X-rite i1
Pro 2 Spectrophotometer combined with
LaCie's Blue Eye Pro software suite. An X-rite i1 Display Pro colorimeter was
also used to verify the black point and contrast ratio since the i1 Pro 2
spectrophotometer is less
reliable at the darker end.
Targets for these tests are as follows:
-
CIE Diagram - validates the colour space
covered by the monitors backlighting in a 2D view, with the black triangle representing the
displays gamut, and other reference colour spaces shown for comparison
-
Gamma - we aim for 2.2 which is the default
for computer monitors
-
Colour temperature / white point - we aim
for 6500k which is the temperature of daylight
-
Luminance - we aim for 120
cd/m2, which is
the recommended luminance for LCD monitors in normal lighting conditions
-
Black depth - we aim
for as low as possible to maximise shadow detail and to offer us the best
contrast ratio
-
Contrast ratio - we aim
for as high as possible. Any dynamic contrast ratio controls are turned off here
if present
-
dE average / maximum -
as low as possible.
If DeltaE >3, the color displayed is significantly different from the
theoretical one, meaning that the difference will be perceptible to the
viewer.
If DeltaE <2, LaCie considers the calibration a success; there remains a
slight difference, but it is barely undetectable.
If DeltaE < 1, the color fidelity is excellent.
Default Performance and
Setup
Default settings of the screen were as follows:
Philips
328P6AUBREB
Default Settings


|
 |
|
Monitor OSD
Default Settings |
|
|
Smart Image mode |
Off |
|
Brightness |
100 |
|
Contrast |
50 |
|
Color Mode |
Color Temperature |
|
Color Temperature |
6500k |
|
RGB |
n/a |
|
Gamma |
2.2 |
|
Luminance
Measurements |
|
|
luminance (cd/m2) |
466 |
|
Black Point (cd/m2) |
0.39 |
|
Contrast Ratio |
1188:1 |
|
Colour
Space Measurements |
|
|
sRGB coverage |
146.8% |
|
DCI-P3 coverage |
108.2% |
|
Rec.2020 coverage |
77.6% |
|
Initially out of the box the screen was set
in the 'color temperature' mode with a setting of 6500k. This operates the
screen a the full native gamut of the backlight. The display was also set with a
very high 100% brightness which was far too bright and uncomfortable to use.
You will
definitely need to turn that down. The colours felt bright and vivid and you
could tell the screen was offering a wide gamut beyond normal sRGB screens.
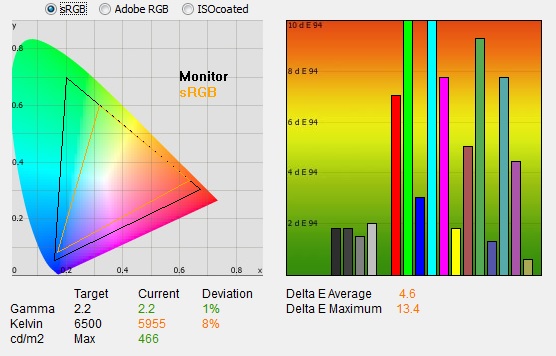
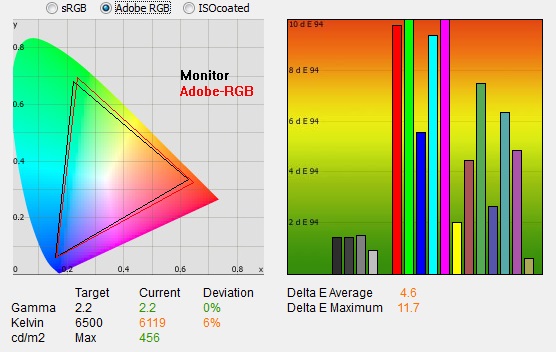
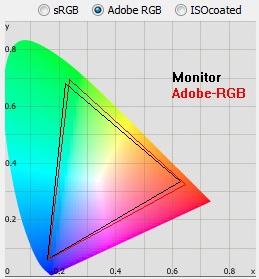
We went
ahead and measured the default state with the i1 Pro 2. The
CIE diagram
on the left of the image confirms that the monitors colour gamut (black
triangle) extends a considerable amount beyond the sRGB colour space reference (orange
triangle). We measured using ChromaPure software a
146.8% sRGB gamut coverage which corresponds to 108.2% of
the DCI-P3 reference and 77.6% of the Rec.2020 reference.
This coverage is fairly typical of a wide gamut LED backlight unit.
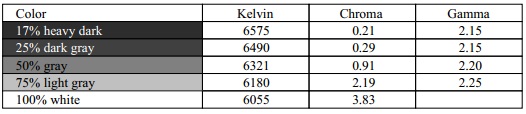
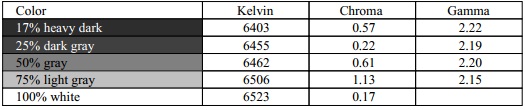
Default gamma was recorded at an accurate 2.2
average, with a very small 1% deviance from the target. White point was measured
at a slightly too warm 5955k which left it a moderate 8%
out from the 6500k we'd ideally want for desktop use. There are a range of other
colour temp presets available in the menu along with a configurable 'user define' mode
where you have access to the individual RGB channels for the
calibration
process.
Luminance was recorded at a very bright 466
cd/m2
which is far too high for prolonged general use, you will need to turn
that down. The screen was set at a default
100% brightness in the OSD menu but that is easy to change of course to reach a
more comfortable setting without impacting any other aspect of the setup. The
black depth was 0.39 cd/m2 at this default
brightness setting, giving us a strong static contrast ratio for an
IPS-type panel of 1188:1.
Colour accuracy was difficult to measure in
this mode since it is comparing the wide gamut colours produced by the screen
with a normal sRGB reference. We will ignore those for now. Testing the screen with colour
gradients showed smooth gradients with only minor gradation evident in
the darker
tones. There was no sign of any colour banding which was good news.
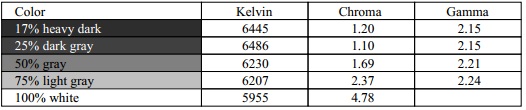
Factory
Calibration
The screen carries a factory calibration in
the sRGB and Adobe RGB preset modes, designed to deliver low dE of <2, and a pre-tuned 2.2 gamma curve. An individual report is provided in the box as
shown with our example below:
We first of all tested the sRGB mode.
Unfortunately the main flaw with this (and the Adobe RGB) mode was that you
cannot adjust the brightness control from the default 100% setting, without the
screen reverting to the normal 'color temperature' mode, and therefore the full
native gamut of the backlight. That makes these two
calibrated modes pointless really, as the brightness is far too high and
uncomfortable to use. You could turn things down at the graphics card level, but
at the cost of lowering the contrast ratio significantly.
Philips
328P6AUBREB
sRGB factory calibrated
|
 |
|
Monitor OSD
Default Settings |
|
|
Smart Image mode |
Off |
|
Brightness |
100 |
|
Contrast |
50 |
|
Color Mode |
sRGB |
|
Color Temperature |
n/a |
|
RGB |
n/a |
|
Gamma |
2.2 |
|
Luminance
Measurements |
|
|
luminance (cd/m2) |
463 |
|
Black Point (cd/m2) |
0.39 |
|
Contrast Ratio |
1190:1 |
|
Colour
Space Measurements |
|
|
sRGB coverage |
91.7% |
|
DCI-P3 coverage |
67.6% |
|
Rec.2020 coverage |
48.5% |
|
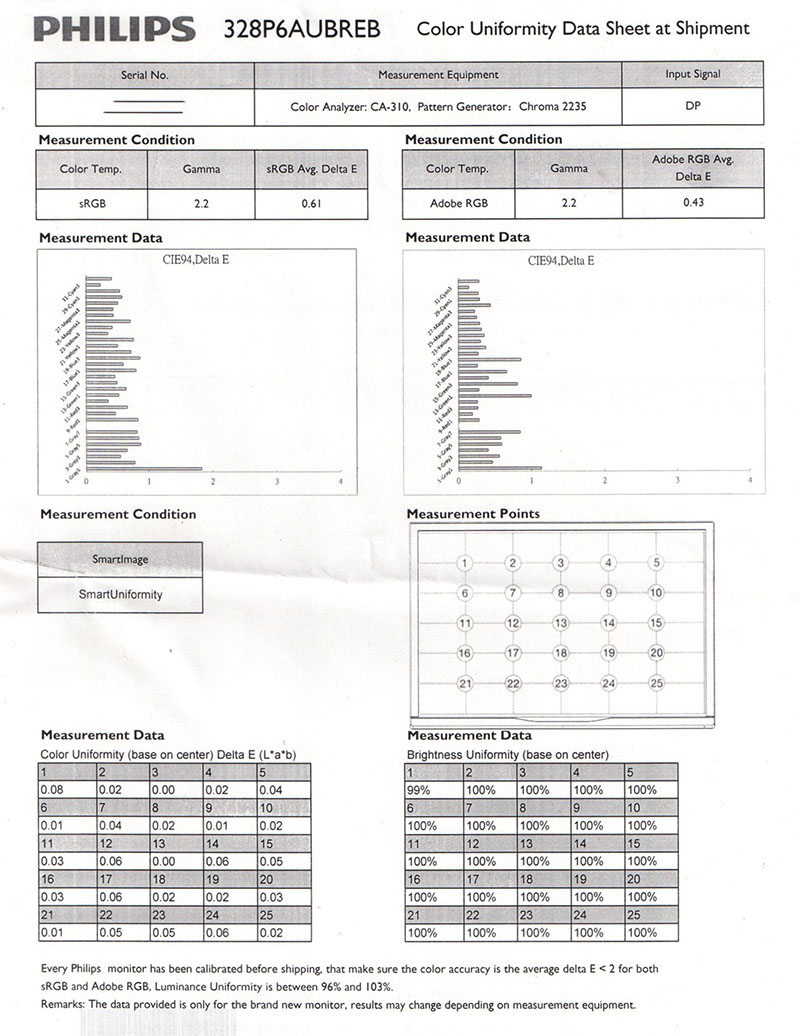
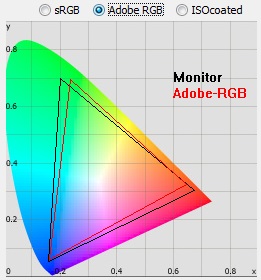
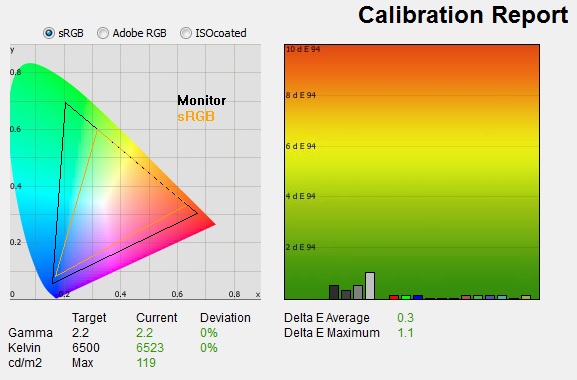
In the sRGB preset mode you can see first of
all that the gamut is being quite nicely emulated to match the sRGB colour space. The
CIE diagram on the left shows that the two triangles match pretty closely now,
and certainly cut down on the large over-coverage we had seen with the native
gamut in the 'color temperature' mode. Using ChromaPure software we measured a 91.7% sRGB
coverage in this mode which was a little lower than we had hoped, but for those who want to work with standard sRGB content
more accurately, this preset provides a more suitable option.
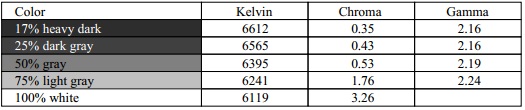
Gamma was measured at an accurate 2.2
average, with a 0% deviance recorded. The factory calibration
does not have a target for white point and we measured it in this mode
at 6055k, still leaving it a little too warm and with a 7% error. dE was 1.2 average
which was excellent, with a 2.3 maximum so it looks like the factory calibration
worked very nicely in that regard. Contrast ratio remained strong for an IPS panel at
1190:1. Colour gradients were mostly smooth but showed a bit of banding in
darker tones.
The main problem with this factory
calibration mode is that you cannot adjust the brightness control, without the
screen reverting you back to the 'color temperature' mode. As a result, although
this sRGB mode has a fairly decent sRGB colour space emulation and good factory
calibration, you can only use
it if you can live with the crazy high 463
cd/m2
brightness which is very uncomfortable. Changing the brightness moves you back
to the full native gamut of the screen, so you then lose the sRGB emulation. We
are not sure why Philips would limit the availability of the brightness control
in these modes, but it makes them unusable in our opinion.
We also then tested the Adobe RGB calibrated
mode for completeness:
Philips
328P6AUBREB
Adobe RGB factory calibrated
|
 |
|
Monitor OSD
Default Settings |
|
|
Smart Image mode |
Off |
|
Brightness |
100 |
|
Contrast |
50 |
|
Color Mode |
Adobe RGB |
|
Color Temperature |
n/a |
|
RGB |
n/a |
|
Gamma |
2.2 |
|
Luminance
Measurements |
|
|
luminance (cd/m2) |
456 |
|
Black Point (cd/m2) |
0.38 |
|
Contrast Ratio |
1189:1 |
|
Colour
Space Measurements |
|
|
sRGB coverage |
125.6% |
|
DCI-P3 coverage |
92.6% |
|
Rec.2020 coverage |
66.4% |
|
In this mode the Adobe RGB colour space is
being more closely matched than the full native gamut of the backlight in the
out-of-the-box mode. We have provided a visual comparison below of both modes.
In this Adobe RGB mode the gamut was reduced a bit from the default 146.8% sRGB
coverage to 125.6% now. Again gamma was reliably set up at 2.2 but white point
was a little too warm. We cannot accurately measure the dE as the software is
comparing the wide gamut colours produced by the screen with an sRGB reference.
Colour space
coverage of Adobe RGB reference
Comparison between native mode (left) and Adobe RGB emulation mode (right)
Again the main problem was that you cannot
adjust the brightness control without moving out of this mode, making it again a
bit pointless. Shame as the emulation of the Adobe RGB space was good.
Calibration
We used the
X-rite i1 Pro 2
Spectrophotometer combined with the LaCie Blue Eye Pro software package to
achieve these results and reports. An X-rite i1 Display Pro colorimeter was used
to validate the black depth and contrast ratios due to lower end limitations of
the i1 Pro device.
Philips
328P6AUBREB
Calibrated Settings
|
 |
|
Monitor OSD
Default Settings |
|
|
Smart Image mode |
Off |
|
Brightness |
5 |
|
Contrast |
50 |
|
Color Mode |
User Define |
|
Color Temperature |
n/a |
|
RGB |
99, 99, 100 |
|
Gamma |
2.2 |
|
Luminance
Measurements |
|
|
luminance (cd/m2) |
119 |
|
Black Point (cd/m2) |
0.09 |
|
Contrast Ratio |
1287:1 |
|
Colour
Space Measurements |
|
|
sRGB coverage |
147.4% |
|
DCI-P3 coverage |
108.6% |
|
Rec.2020 coverage |
77.9% |
|
We first of all switched to the 'User Define'
color mode which gives you access to adjust the RGB channels
individually but will leave the screen in the full native gamut. It's sadly not
possible to work with the sRGB mode as although the screen offers a fairly
decent sRGB emulation mode, you cannot change the brightness away from the
maximum 100% so it's too uncomfortable to actually use. As a result, it's not
possible to calibrate the screen with a smaller sRGB gamut in mind.
We adjusted the RGB
channels and brightness setting as shown in the table above as part of the
guided calibration process. These OSD
changes allowed us to obtain an optimal hardware starting point and setup before software level changes would be
made at the graphics card level. We left the LaCie software to calibrate
to "max" brightness which would just retain the luminance of whatever brightness
we'd set the screen to, and would not in any way try and alter the luminance at
the graphics card level, which can reduce contrast ratio. These adjustments
before profiling the screen would help preserve tonal values and limit
banding issues. After this we let the software carry out the LUT adjustments and create an
ICC profile.
Average gamma was measured at 2.2 average
which fixed the minor 1% deviance we'd seen out of the box. The fairly large 8% white point deviance had now been corrected bringing the measured
white point to 6523k. Luminance had been improved thanks to the adjustment to
the brightness control and was now being measured at a far more comfortable 119
cd/m2.
This left us a black depth of 0.09 cd/m2 and a static
contrast ratio of 1287:1 which was excellent for an IPS panel and living up to
the spec of the screen. Colour accuracy of the resulting
profile was excellent too, with dE average of 0.3 and maximum of 1.1. LaCie would
consider colour fidelity to be excellent.
Testing the screen with various colour
gradients showed mostly smooth transitions with only some minor gradation in
darker tones, but no visible banding.
You can use our settings and
try our calibrated ICC profile if you wish, which are available in
our ICC profile database. Keep in mind that results will vary from one
screen to another and from one computer / graphics card to another.
Calibration Performance Comparisons
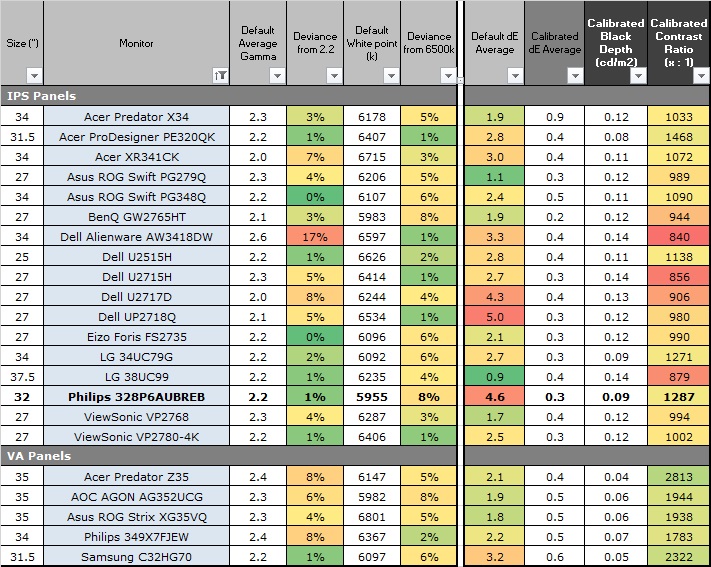
The comparisons made in this section try to give
you a better view of how each screen performs, particularly out of the box which
is what is going to matter to most consumers. We have divided the table up by
panel technology as well to make it easier to compare similar models. When comparing the default factory
settings for each monitor it is important to take into account several
measurement areas - gamma, white point and colour accuracy. There's no point
having a low dE colour accuracy figure if the gamma curve is way off for
instance. A good factory calibration requires all 3 to be well set up. We have
deliberately not included luminance in this comparison since this is normally
far too high by default on every screen. However, that is very easily controlled
through the brightness setting (on most screens) and should not impact the other
areas being measured anyway. It is easy enough to obtain a suitable luminance
for your working conditions and individual preferences, but a reliable factory
setup in gamma, white point and colour accuracy is important and some (gamma
especially) are not as easy to
change accurately without a calibration tool.
From these comparisons we can also compare the
calibrated colour accuracy, black depth and contrast ratio. After a calibration
the gamma, white point and luminance should all be at their desired targets.
Default setup of the screen out of the box
was moderate. Firstly in the default mode the full native gamut of the backlight
(around 147% sRGB coverage) was produced and it's not really possible to work
with other emulated colour spaces like sRGB or Adobe RGB because in those modes
the brightness control is locked at 100%. In the default mode though you could
change the brightness setting to whatever you want, and certainly you'd want to
change it from the default setting which is too bright. The gamma curve was well
set up out of the box, but white point was a bit off (8%) and a bit too warm.
The screen did show a high static contrast ratio for an IPS panel which was
pleasing.
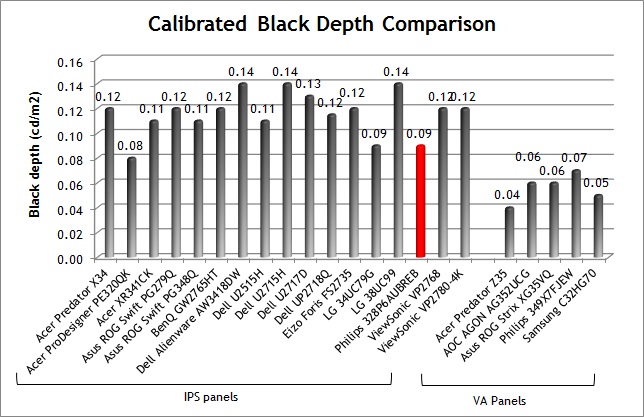
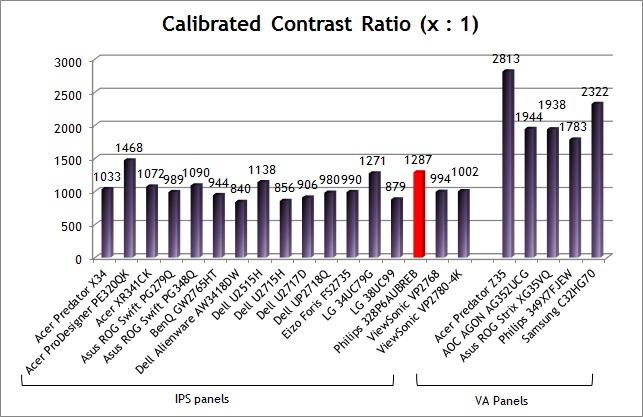
Where the 328P6A did very well is in black
depth and contrast ratio. Not compared with VA panels of course which as you can
see reach up to around 2000 - 3000:1 as you can see from the models on the
right hand side above. That's a strength of VA technology for sure. IPS panels
have been limited to around 1000:1 maximum for many years though, with the odd
screen exceeding slightly beyond that such as the Dell U2515H (1138:1). This
screen pushed that a bit further, with 1287:1 measured after calibration. That's
an excellent result for an IPS panel. Another new screen we tested recently was
the
Acer ProDesigner PE320QK which reached even higher at 1468:1
and set a new standard for IPS technology.
|
Check Pricing and Buy - Direct Links
|
|
Amazon
|
|
TFTCentral is a participant
in the Amazon Services LLC Associates Programme, an affiliate
advertising programme designed to provide a means for sites to earn
advertising fees by advertising and linking to Amazon.com, Amazon.co.uk,
Amazon.de, Amazon.ca and other Amazon stores worldwide. We also
participate in a similar scheme for Overclockers.co.uk. |
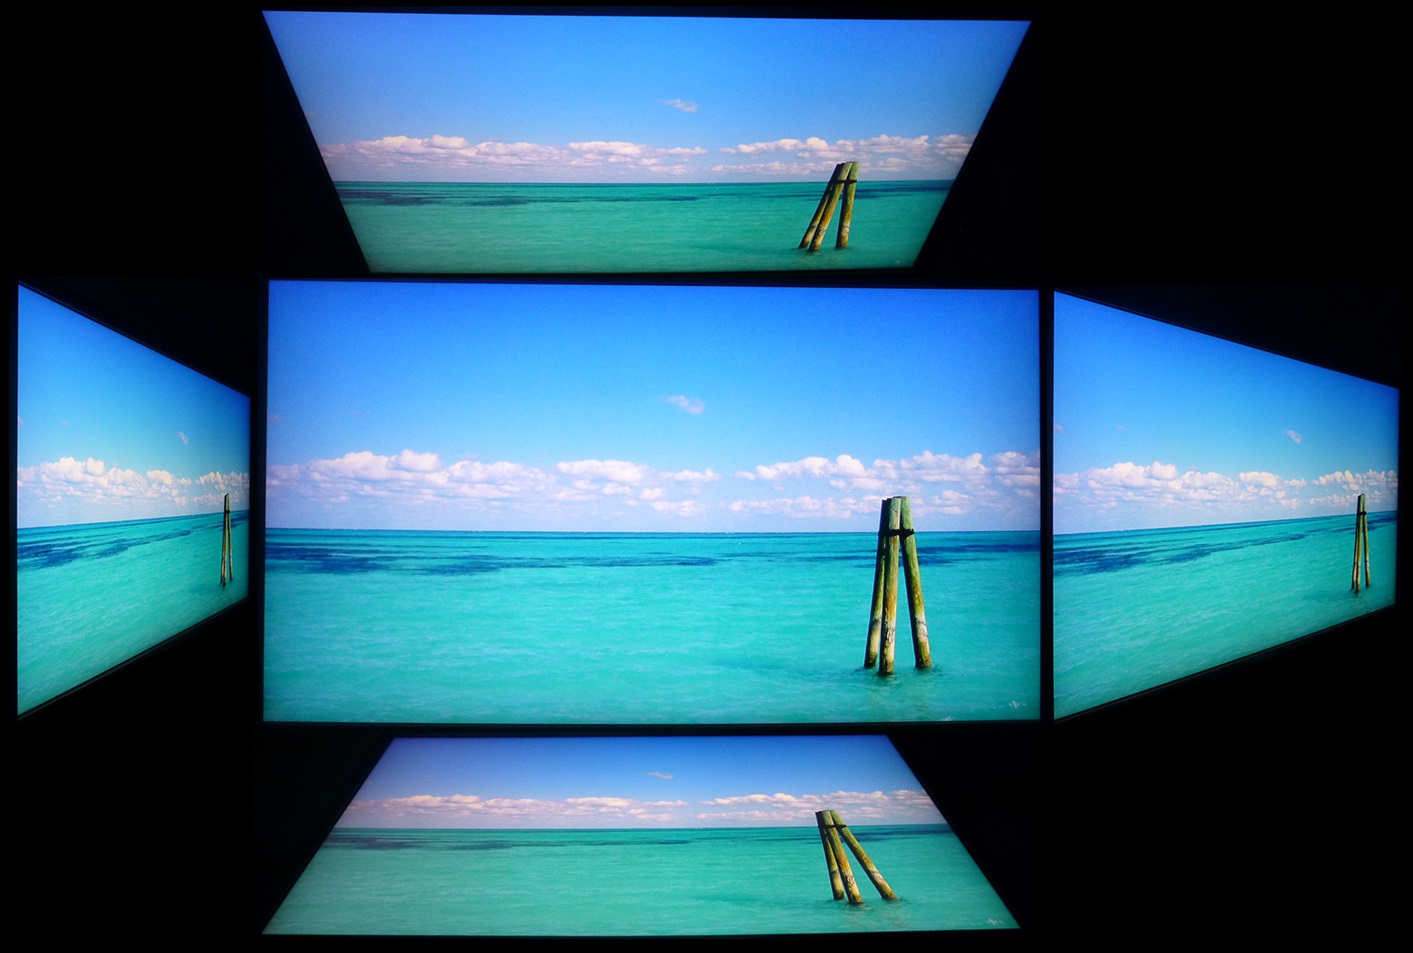
Viewing Angles
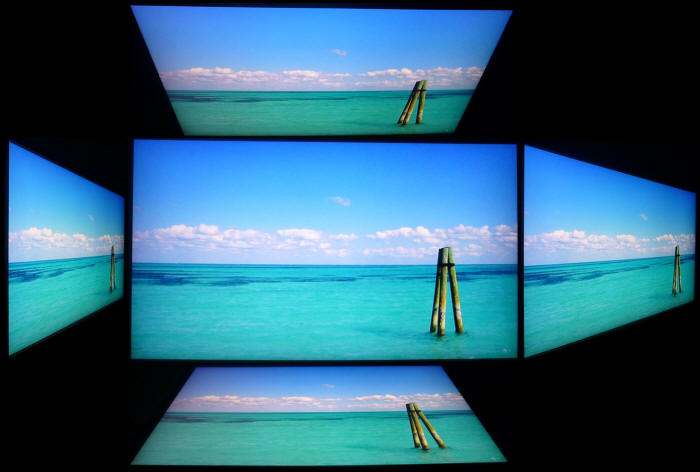
Above: Viewing
angles shown from front and side, and from above and below. Click for
larger image
Viewing angles of the screen were very good
as you would expect from an IPS-type panel. Horizontally there was very little colour
tone shift until wide angles past about 45. A slight darkening of the image
occurred horizontally from wider angles as you can see above as the contrast
shifted slighting. Contrast shifts were slightly more noticeable in the vertical
field but overall they were very good. The screen offered the wide viewing
angles of IPS technology and was free from the restrictive fields of view of TN
Film panels, especially in the vertical plane. It was also free of the
off-centre contrast shift you see from VA panels and a lot of the quite obvious
gamma and colour tone shift you see from some of the modern VA panel type
offerings. All as expected really from a modern IPS panel.
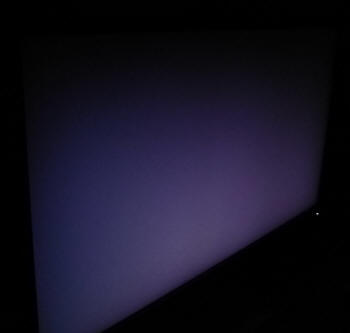
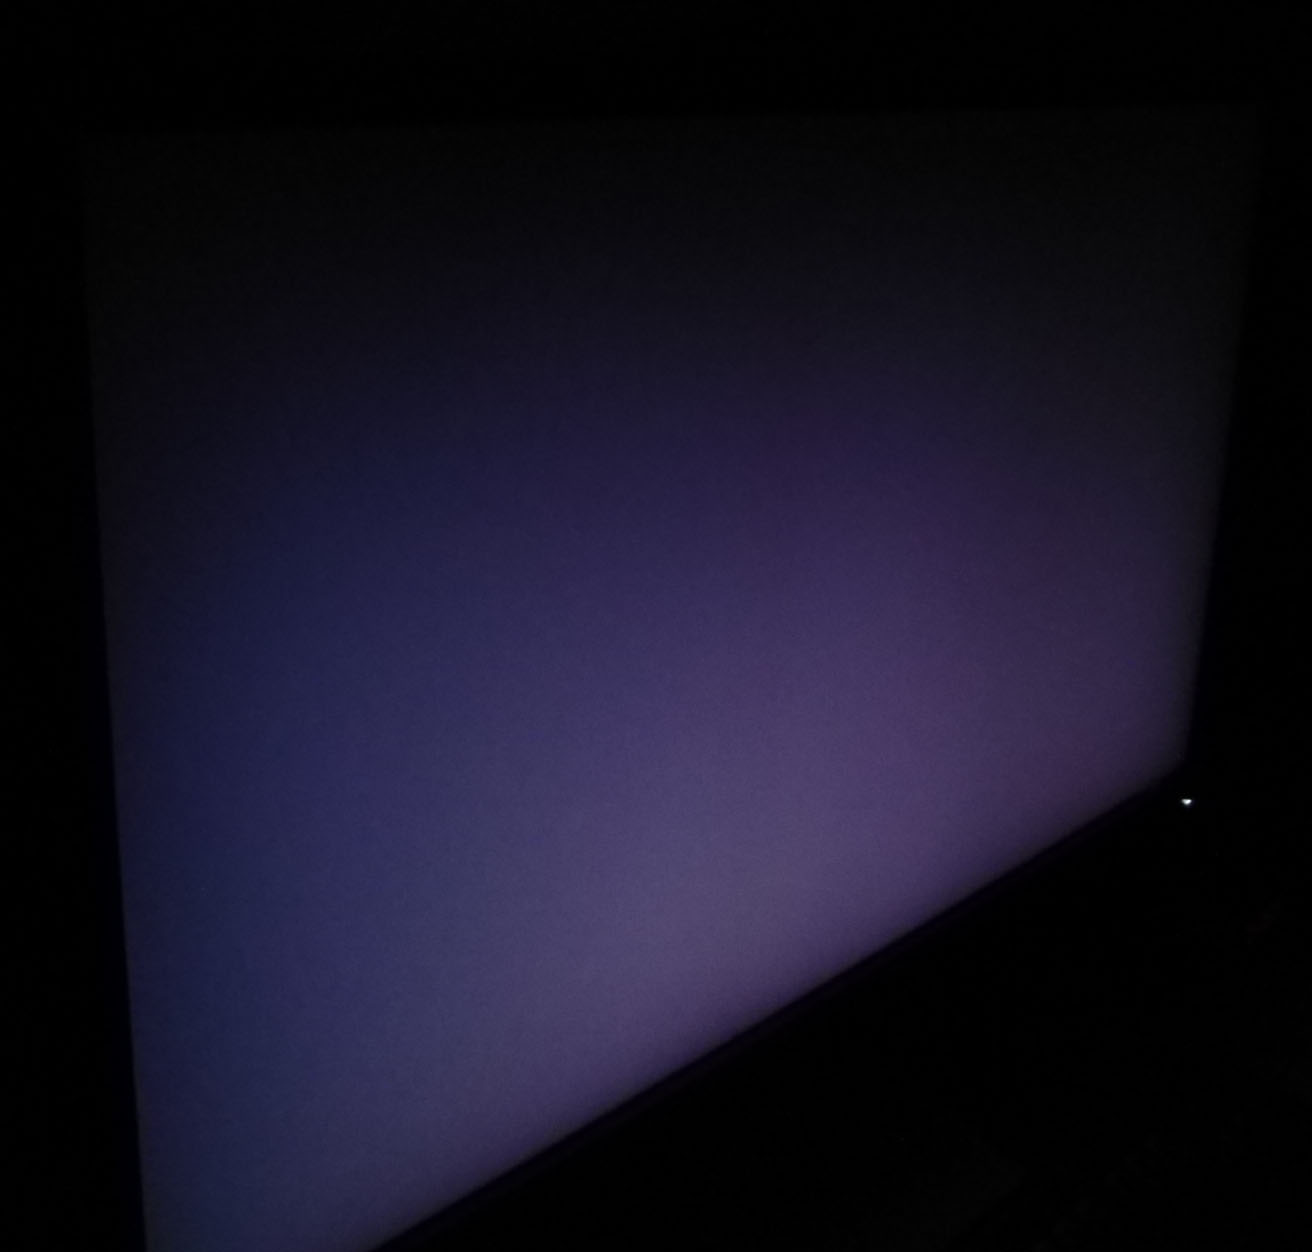
Above: View of an
all black screen from the side. Click for larger version
On a black image there is a characteristic
pale glow when viewed from an angle, commonly referred to as "IPS-glow".
Here is appears more purple than white like some IPS panels. Some level of glow
from an angle
is common on most modern IPS-type panels and can be distracting to some users.
If you view dark content from a normal head-on viewing position, you can
actually see this glow as your eyes look towards the edges of the screen.
Because of the large size of this 32" panel, the glow towards the edges is
more obvious than on small screens, where there isn't such a long distance from
your central position to the edges. Some people may find this problematic if
they are working with a lot of dark content or solid colour patterns. In normal
day to day uses, office work, movies and games you couldn't really notice this
unless you were viewing darker content. If you move your viewing position back,
which is probably likely for movies and games, the effect reduces as you do not
have such an extreme angle from your eye position to the screen edges.
Panel Uniformity
We wanted to test
here how uniform the brightness was across the screen, as well as identify any
leakage from the backlight in dark lighting conditions. Measurements of the
luminance were taken at 35 points across the panel on a pure white background.
The measurements for luminance were taken using BasICColor's calibration
software package, combined with an X-rite i1 Display Pro colorimeter with a
central point on the screen calibrated to 120 cd/m2. The below
uniformity diagram shows the difference, as a percentage, between the
measurement recorded at each point on the screen, as compared with the central
reference point.
It is worth
noting that panel uniformity can vary from one screen to another, and can depend
on manufacturing lines, screen transport and other local factors. This is only a
guide of the uniformity of the sample screen we have for review.
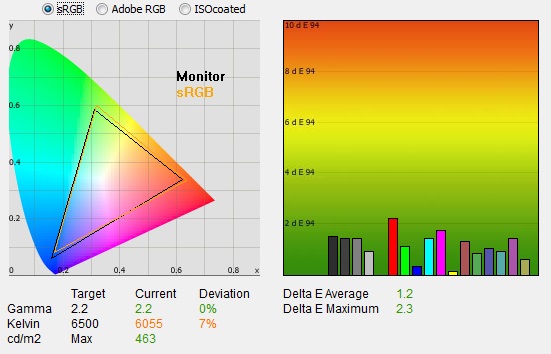
Uniformity of Luminance
SmartUniformity mode = Off
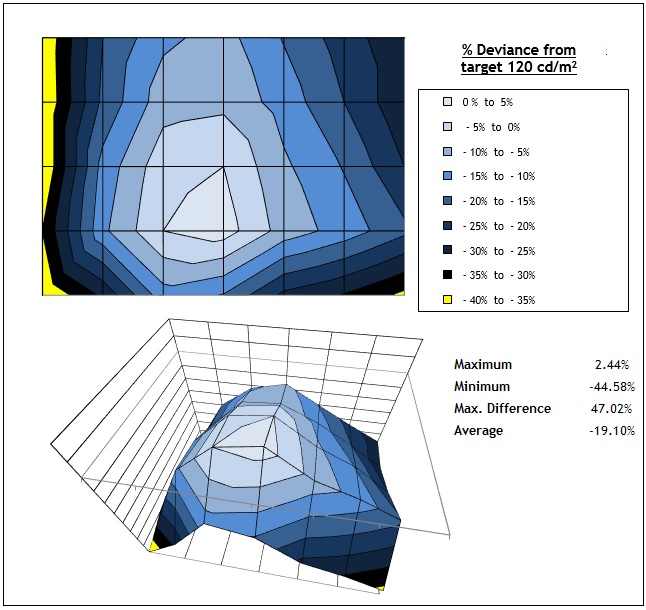
Uniformity of the screen was really poor on this sample, let's hope it
varies with different samples of the screen. There is a uniformity
correction mode which we will test in a moment, but with that turned off you
can see there's quite a large difference in uniformity of brightness across
the screen. The sides of the screen were much darker than the centrally
calibrated region, ranging down by -45% in the most extreme cases to 83 cd/m2.
The left hand edge dropped the lowest here. Only 26% of the screen was
within a 10% deviance of the centrally calibrated point which was poor. You
may notice some of this variation in practice, and it's certainly likely to
be problematic for any colour critical or photo work.
Uniformity of Luminance
SmartUniformity mode = ON
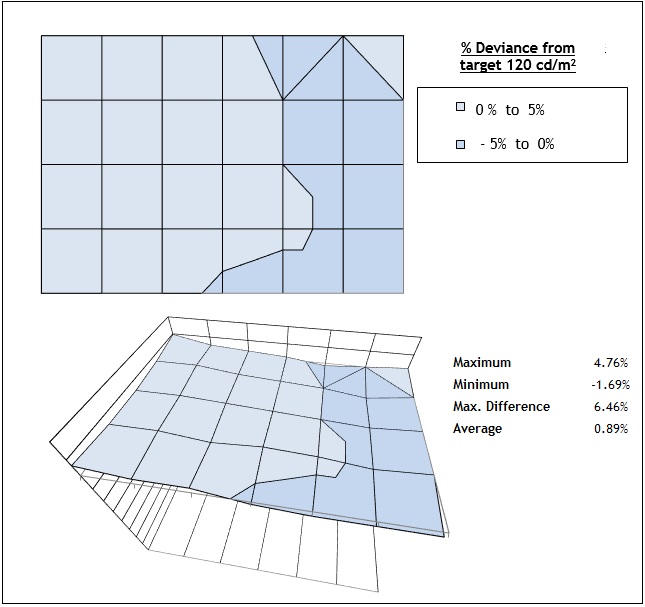
Thankfully there was a much better result if you enable the
SmartUniformity mode from the OSD menu. In this mode the screen goes a bit
darker as well, so this would also afford you a lower luminance range than
the rather limited 98 cd/m2 we had seen with this feature turned
off. You now need a brightness setting of around 46% to produce a 120 cd/m2
luminance, as opposed to a setting of 7% that you need when SmartUniformity
is off. It's nice that you are able to adjust the brightness control in this
mode to your liking, unlike the sRGB and Adobe RGB emulation modes we tested
earlier. The brightness uniformity across the screen is improved massively,
with a maximum deviance between any two points of only 6.46%. The whole
screen was within the 10% deviance threshold now. There is one draw back to
this SmartUniformity mode though in that it adjusts the digital white levels
to achieve the uniformity correction and so has an impact on the contrast
ratio of the screen. We measured a static contrast ratio of 576:1 with
SmartUniformity turned on.
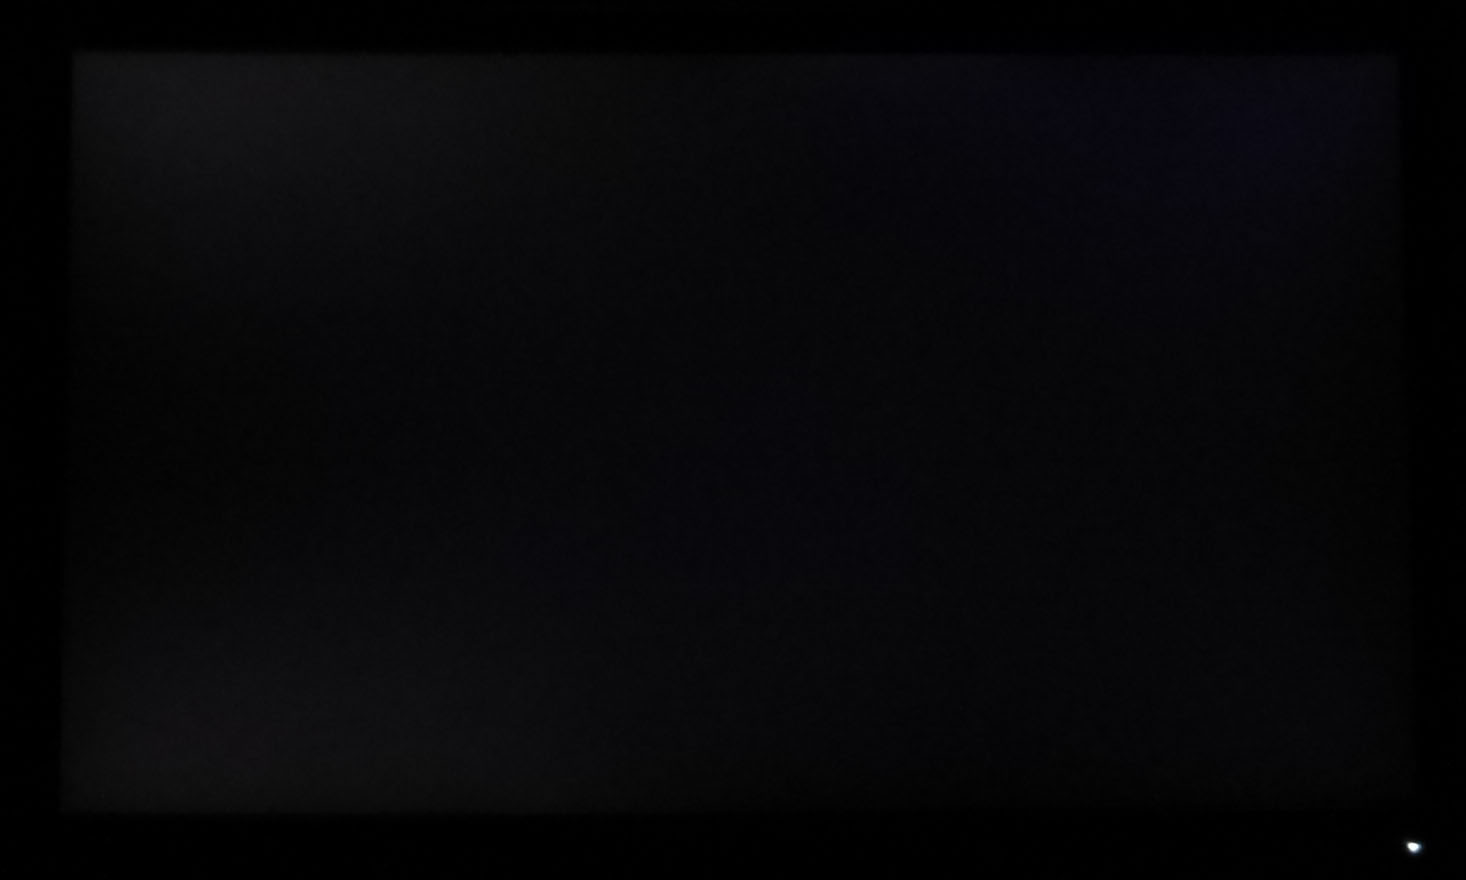
Backlight Leakage
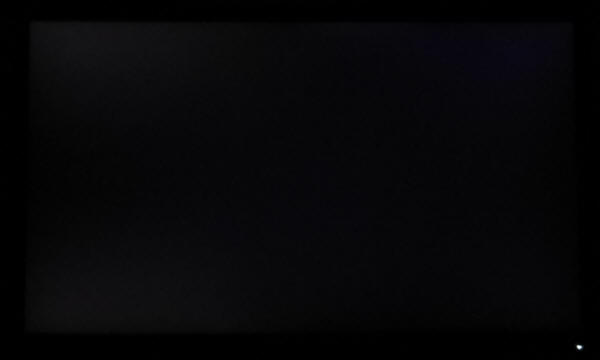
Above: All black screen in a darkened room. Click for larger version
We also tested the screen with an all black image
and in a darkened room. A camera was used to capture the result. The camera
showed there was no noticeable backlight bleed or clouding on this sample which
was great news.
Note: if you want to test your own screen for
backlight bleed and uniformity problems at any point you need to ensure you have
suitable testing conditions. Set the monitor to a sensible day to day brightness
level, preferably as close to 120
cd/m2 as you can get it (our tests are
once the screen is calibrated to this luminance). Don't just take a photo at the
default brightness which is almost always far too high and not a realistic usage
condition. You need to take the photo from about 1.5 - 2m back to avoid
capturing viewing angle characteristics, especially on IPS-type panels where
off-angle glow can come in to play easily. Photos should be taken in a darkened
room at a shutter speed which captures what you see reliably and doesn't
over-expose the image. A shutter speed of 1/8 second will probably be suitable
for this.
General and Office Applications
The screen features a 2560 x 1440 resolution
which is fairly common nowadays, but the difference here is that it is on a
slightly larger screen size than normal. The 328P6A is 31.5" in size, making it
4.5" larger diagonally than the typical 27" models featuring this resolution.
The larger screen size is designed to provide more immersion for multimedia and
games, giving a bigger screen to look at, especially useful if you want to view
it from a little further back than a typical PC viewing position. So how does
this 2560 x 1440 resolution look on this larger screen? Well, it looks fine. You
will see slightly larger font sizes of course with the 0.272mm pixel pitch here
and so for office work it doesn't look quite as sharp as on a 27" model. Some
people may even prefer this slightly larger font though for more comfortable
reading, and it's certainly not too big we didn't think for a screen this size.
It also avoids the need to worry about any Operating System or software scaling
which you would have to contend with on 3840 x 2160 resolution displays of this
size.
The light AG coating of the panel is welcome,
and much better than the grainy and 'dirty' appearance of older IPS AG coatings
from years gone by. The
wide viewing
angles provided by this panel technology on both horizontal and vertical planes,
helps minimize on-screen colour shift when viewed from different angles.
The
default setup of the screen offered an accurate gamma
curve and a strong contrast ratio for an IPS panel. The white point was a bit
warm though and you are pretty much "stuck" with using the screen with its full
wide gamut capability. That's fine if you want boosted, more vivid colours for
multimedia, gaming and HDR or if you are working specifically with wide gamut
content. It's native gamut is fairly close to the Adobe RGB reference space.
It's just a shame that you're limited to using only this colour space really,
since the provided sRGB (and Adobe RGB) emulation mode work well and provide a
nice factory calibration, but are not
practically useable since you can't alter the brightness from the crazily high
100%. That's a really annoying issue, as otherwise it would have been very
handy. Those modes also carry the factory calibration, so not being able to
tweak the brightness control seems crazy.
The
brightness adjustment range of the screen was very good, with the ability to
offer a luminance between 461 and 98 cd/m2. This did mean that at the
lower end it doesn't go as dark as some people may want. A setting of ~7 in the OSD brightness control should
return you a luminance close to 120 cd/m2 out of the box. On a
positive note, the brightness regulation is controlled without the need for the
use of
Pulse-Width Modulation (PWM), and so those who suffer from eye fatigue or
headaches associated with flickering backlights need not worry. There was no
audible noise or buzzing from the screen, even when specifically looking for it
using test images with a large amount of text at once. The screen also remains
cool even during prolonged use. The brightness uniformity of the screen in the
default mode is poor unfortunately, so if you want to do any colour
critical/photo work you are probably best to switch to the SmartUniformity mode
where it is miles better. This also will help you achieve a lower luminance
should you need to.
There is a
LowBlue mode available in the preset menu to help reduce the blue light output
of the screen. We found it made the image look a little more green compared with
the calibrated 'off' mode. There are 3 levels available (default is 2) and
switching up to the maximum 3 setting produced an overly green image, making
even black fonts look dark green. You can at least customise the brightness and
other settings in this LowBlue mode which makes it usable.
The screen offers 2x USB 3.0 ports (with
charging capabilities also) which is very handy, although they are on the back
of the screen with the input connections so not really easy access. There are also 2x
3W integrated stereo speakers
which are probably ok for the odd mp3, sound clip or YouTube video, along with
an audio input and headphone output. There aren't any other extras like card
readers or ambient light sensors offered though which can sometimes be useful in
office environments. The stand offers a wide range of adjustments which is great
news, allowing you to obtain comfortable viewing positions although they are
quite stiff to operate so you might not want to move it around too often.
Responsiveness and Gaming
|
Panel Manufacturer and
Technology |
TP Vision |
|
Panel Part |
TPT31585-QHBN0.K |
|
Quoted G2G Response Time |
4ms G2G |
|
Quoted ISO Response Time |
n/a |
|
Overdrive Used |
Yes |
|
Overdrive Control
Available Via OSD Setting |
Smart Response |
|
Overdrive OSD Settings |
Off, Fast, Faster,
Fastest |
|
Maximum
Refresh Rate |
60Hz |
|
Variable Refresh Rate
technology |
n/a |
|
Variable Refresh Rate Range
|
n/a |
The 328P6A is rated by Philips as having a
4ms G2G response time. The screen uses
overdrive / response time compensation (RTC) technology to boost pixel
transitions across grey to grey changes as with nearly all modern displays. There is a user control in the OSD menu
for the overdrive under the 'Smart Response' setting with 4 options available -
Off, Fast, Faster and Fastest. The part being used is the
TP Vision TPT31585-QHBN0.K IPS-type technology panel. Have a read about response
time in our
specs section if you need additional information about this measurement.
We use an
ETC M526
oscilloscope for these measurements along with a custom photosensor device.
Have a read of
our response time measurement article for a full explanation of the testing
methodology and reported data.
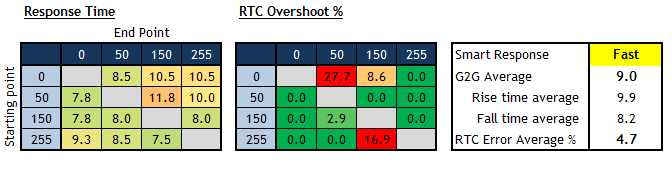
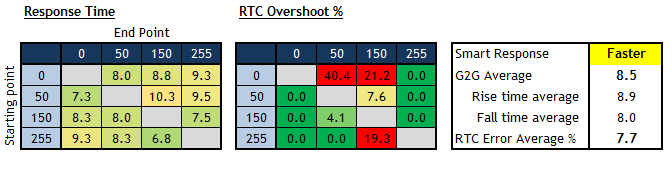
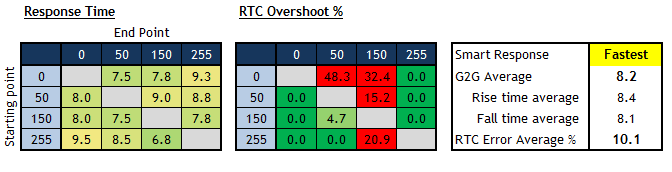
We carried out some initial response time
measurements in each of the overdrive settings, along with some visual tests.
You can see the trend clearly enough above. The response times improve a little
with each step in the overdrive level, but at the same time, the overshoot
creeps up as well. We felt that the 'Fast' mode provided the best balance to be
honest, before the higher levels of overshoot started to appear more regularly.
Some users may wish to experiment with the 'Faster' mode too perhaps. Keep in
mind this is a 60Hz-only screen and not specifically aimed at gaming. The 9.0ms
G2G response times in the Fast mode are adequate for 60Hz IPS gaming, and to be honest not far
behind the best 60Hz IPS panels we've tested. They can reach down to about 8.5ms
G2G in the best cases we've found without introducing any noticeable overshoot.
There is no variable refresh rate technology like G-sync or FreeSync on this
screen, and it's not specifically aimed at gamers.
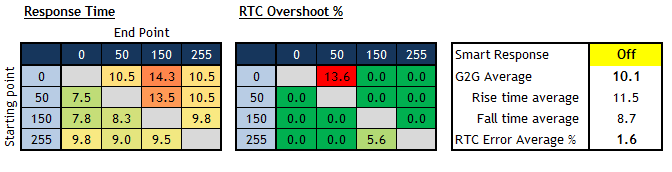
Detailed Response Time Measurements
SmartResponse mode = Fast
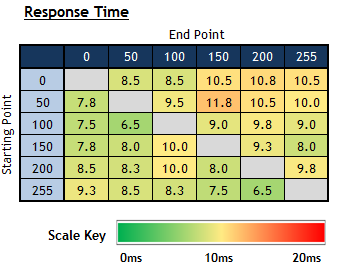
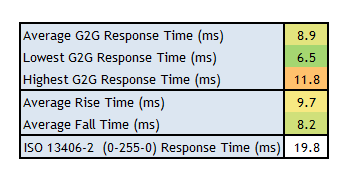
Having settled on the 'fast' SmartResponse
mode for delivering the optimal balance between response times and overshoot, we
carried out a more thorough range of measurements as shown above. The average
response time was now measured at 8.9ms G2G. Rise times (changes from darker to
lighter shades) were a bit slower than fall times (changes from light to dark),
with a 9.7ms G2G average compared with 8.2ms G2G. Some of the fall times reached
down to 6.5ms as a minimum but none reached down to the advertised spec of 4ms.
Perhaps this is possible in the 'faster' or 'fastest' modes, but we felt that
there was just too much overshoot introduced in those higher settings to make
them practical.
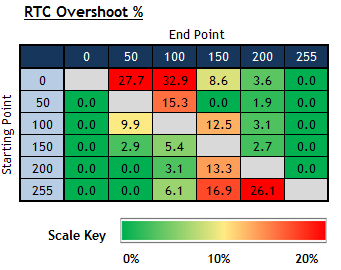
Speaking of overshoot, the 'fast' mode showed
moderate levels of overshoot overall, with some smaller transitions (where
shades are closer together) showing fairly high amounts. It was not too bad or
obvious in practice in this mode, but does get progressively worse if you push
the SmartResponse setting up higher.
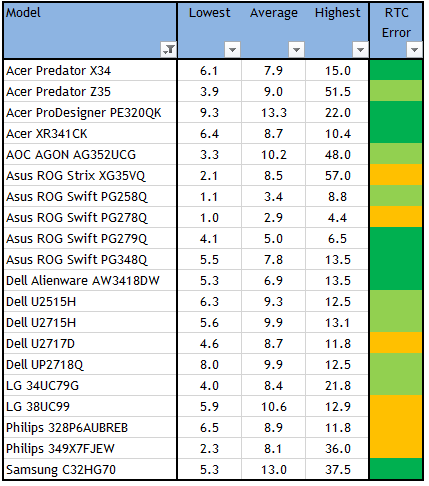
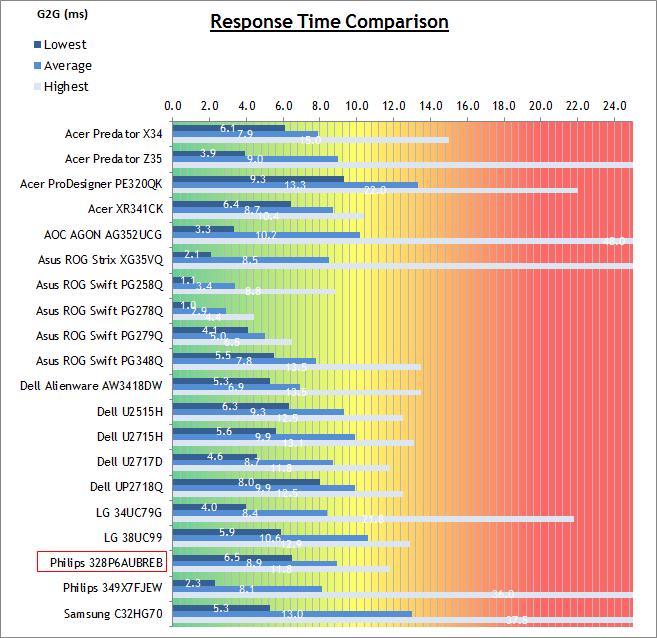
We have provided a comparison of the Philips
328P6A against many other screens that we have tested. For a 60Hz IPS-type panel
it performed pretty well really, with an average 8.9ms G2G response time and
moderate levels of overshoot. Other 60Hz IPS screens shown here are the Acer
ProDesigner PE320QK (13.3ms), Dell U2515H (9.3ms), Dell U2715H (9.9ms), Dell
U2717D (8.7ms) and Dell UP2718Q (9.9ms). They were all slightly slower than the
328P6A, although they did show less overshoot so it's a bit of a trade-off.
Higher refresh rate IPS models such as the Acer Predator X34 (100Hz refresh rate
7.9ms G2G response times) and Asus ROG Swift PG279Q (144Hz, 5.0ms) for instance
are faster from a pixel transition point of view, but also thanks to the added
frame rate of the higher refresh rate. Those high refresh rate models are
certainly more suited to gaming than 60Hz models.
Additional Gaming Features
-
Aspect Ratio Control -
the screen has 3 options for
hardware level
aspect ratio control
options, with settings 'widescreen', 4:3 aspect and 1:1 pixel mapping offered.
It would have been useful
to see an additional 'auto-aspect' ratio mode available to account for other formats than
the native 16:9. Although much content is in 16:9 nowadays, including external
consoles and Blu-ray players so you may not need to worry.
Lag
We have written an in depth article about
input lag and the various measurement techniques which are used to evaluate
this aspect of a display. It's important to first of all understand the
different methods available and also what this lag means to you as an end-user.
Input Lag vs. Display Lag vs. Signal
Processing
To avoid confusion with different terminology we
will refer to this section of our reviews as just "lag" from now on, as there
are a few different aspects to consider, and different interpretations of the
term "input lag". We will consider the following points here as much as
possible. The overall "display lag" is the first, that being the delay between
the image being shown on the TFT display and that being shown on a CRT. This is
what many people will know as input lag and originally was the measure made to
explain why the image is a little behind when using a CRT. The older stopwatch
based methods were the common way to measure this in the past, but through
advanced studies have been shown to be quite inaccurate. As a result, more
advanced tools like SMTT provide a method to measure that delay between a TFT
and CRT while removing the inaccuracies of older stopwatch methods.
In reality that lag / delay is caused by a
combination of two things - the signal processing delay caused by the TFT
electronics / scaler, and the response time of the pixels themselves. Most
"input lag" measurements over the years have always been based on the overall
display lag (signal processing + response time) and indeed the SMTT tool is
based on this visual difference between a CRT and TFT and so measures the
overall display lag. In practice the signal processing is the element which
gives the feel of lag to the user, and the response time of course can
impact blurring, and overall image quality in moving scenes. As people become
more aware of lag as a possible issue, we are of course keen to try and
understand the split between the two as much as possible to give a complete
picture.
The signal processing element within that is quite
hard to identify without extremely high end equipment and very complicated
methods. In fact the studies by Thomas Thiemann which really kicked this whole
thing off were based on equipment worth >100,1000 Euro, requiring extremely high
bandwidths and very complicated methods to trigger the correct behaviour and
accurately measure the signal processing on its own. Other techniques which are
being used since are not conducted by Thomas (he is a freelance writer) or based
on this equipment or technique, and may also be subject to other errors or
inaccuracies based on our conversations with him since. It's very hard as a
result to produce a technique which will measure just the signal processing on
its own unfortunately. Many measurement techniques are also not explained and so
it is important to try and get a picture from various sources if possible to
make an informed judgement about a display overall.
For our tests we will continue to use the SMTT
tool to measure the overall "display lag". From there we can use our
oscilloscope system to measure the response time across a wide range of grey to
grey (G2G) transitions as recorded in our
response time
tests. Since SMTT will not include the full response time within its
measurements, after speaking with Thomas further about the situation we will
subtract half of the average G2G response time from the total display lag. This should allow us to give a good estimation of
how much of the overall lag is attributable to the signal processing element on
its own.
Lag Classification
To help in this section we will also introduce a broader classification system
for these results to help categorise each screen as one of the following levels:
-
Class 1)
Less than 16ms / 1 frame lag at 60Hz - should be fine for gamers, even at high levels
-
Class
2)
A lag of 16 - 32ms / One to two frames at
60Hz - moderate lag but should be fine for many gamers.
Caution advised for serious gaming
-
Class
3)
A lag of more
than 32ms / more than 2 frames at 60Hz - Some noticeable lag in daily usage, not
suitable for high end gaming
For the full reviews of the models compared here and the dates they were written
(and when screens were approximately released to the market), please see our
full
reviews index.
|
(Measurements in ms) |
|
|
Total Display Lag (SMTT
2) |
20.24 |
|
Pixel Response Time
Element |
4.45 |
|
Estimated Signal
Processing Lag |
15.79 |
|
Lag Classification |
1 |
|

Class
1 |
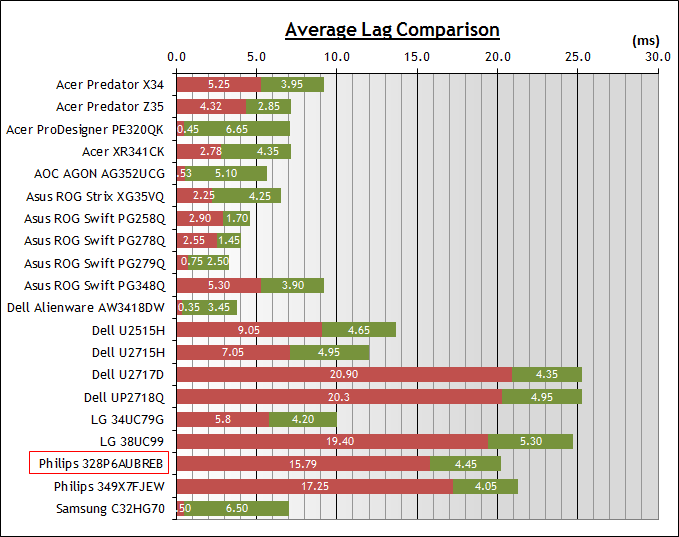
We have provided a comparison above against other
models we have tested to give an indication between screens. The screens
tested are split into two measurements which are
based on our overall display lag tests (using SMTT) and half the average G2G
response time, as measured by the oscilloscope. The response time is split from
the overall display lag and shown on the graph as the green bar. From there, the
signal processing (red bar) can be provided as a good estimation.
We measured a total display lag of 20.24ms. With approximately
4.95ms of that accounted for by pixel
response times we had an estimated signal processing of 15.79ms, which was just
under 1 frame of lag at 60Hz. Most non gaming screens with a built in scaler
will show a similar level of lag, around 16 - 20ms is common.
Movies and Video
The following summarises the screens performance
in video applications:
-
31.5"
screen size makes it a reasonable option for an all-in-one multimedia screen, but
being quite a bit smaller than most modern LCD TV's of course even at this
size.
-
16:9 aspect ratio is more well suited to videos than a 16:10 format screen,
leaving smaller borders on DVD's and wide screen content at the top and
bottom.
-
2560 x 1440 resolution can support full 1080 HD resolution content
but not Ultra HD content.
-
Digital interfaces support HDCP for any encrypted and protected content
-
Good range of connectivity options provided
with 1x DisplayPort, 1x HDMI 2.0 and 1x USB type-C offered
-
Cables provided in the box
for DisplayPort, HDMI and USB type-C.
-
Light
AG coating providing clean and clear images, without the
unwanted reflections of a glossy solution.
-
Wide brightness range adjustment possible from the display, including a
maximum luminance of ~461
cd/m2 and a fairly decent
minimum luminance of 98 cd/m2. This should afford you good control
for different lighting conditions. Brightness regulation is
controlled without the need for PWM and so is flicker free for all brightness
settings.
-
Black
depth and contrast ratio are excellent considering this is an IPS
panel, measured at 1287:1 after
calibration. Detail in darker scenes should not be lost as a result.
-
There is a specific preset modes for 'movie' on this model which which might be useful to set up
and save your settings for
specific movie viewing.
-
Decent
enough pixel responsiveness which should be able to handle fast moving
scenes in movies without too much issue. There is a moderate amount of overshoot
in the recommended 'fast' mode but nothing too obvious. You will see more of
an issue if you push the SmartResponse setting up higher.
-
Wide viewing angles thanks to IPS-type
panel technology meaning several people could view the screen at once
comfortable and from a whole host of different angles. When viewing darker
content you may find the characteristic IPS-glow a little annoying on this
panel technology.
-
No backlight leakage, and none from the edges which is good. This type of
leakage may prove an issue when watching movies where black borders are
present but it is not a problem here.
-
Good range of tilt, height and
swivel ergonomic adjustments available from the stand although some are a bit
stiff to operate. Still, it's pretty easy to
re-position the screen for movie viewing
from a distance, or with other people.
-
2x 3W integrated stereo speakers on this model and audio input/headphone
output
connections if needed. Speakers might be ok for the odd video clip from YouTube
but not for any real movie viewing.
-
Reasonable hardware aspect ratio options with widescreen, 4:3 and 1:1 modes offered.
Being a native 16:9 aspect ratio screen many external devices are the same and
so probably don't need scaling. Would have been useful to see an 'auto' aspect
ratio mode included too.
-
Picture in picture (PiP) and Picture By Picture (PbP) are not available on
this screen.
-
HDR offered with some benefits, including an 8-zone local dimming backlight.
See the HDR
section for more information.
HDR (High Dynamic Range)
HDR stands for
High Dynamic Range and is a
technology just starting to make its way in to the desktop monitor market. It's
been around in the TV market for a couple of years and is used
primarily to provide a better dynamic range and contrast to the image for
multimedia, movies and games - that
being the difference between light and dark parts of an image. This improvement
to the dynamic range is usually
paired with other specific features under the banner term of "HDR" including a wider colour gamut for richer,
more vivid colours and specs like a 10-bit colour depth support and a high Ultra HD
resolution. Overall, an HDR Capable screen is designed to offer a more life-like
images, with better contrast ratios between light and dark areas and more vivid,
bright colours. You only need to go in to a high street store to observe the
difference that HDR makes on TV sets, so we would encourage you to do that if
you want to see first hand the improvements it makes to the image quality.
HDR Standards Conformity
|
Ultra HD
Premium Spec Guidelines
|
Yes/no
|
Display Spec
|
|
At least Ultra HD
Resolution 3840 x 2160 |
|
2560 x 1440 native only |
|
10-bit colour depth
processing |
|
8-bit + FRC panel |
|
DCI-P3 colour space
coverage |
|
108.2% DCI-P3 measured in
default mode |
|
Suitable HDR connectivity |
|
HDMI 2.0 |
|
at least 1000 cd/m2 peak luminance |
|
526 peak cd/m2 measured |
|
at least 20,000:1 active contrast ratio |
|
1879:1 maximum measured |
|
|
|
Backlight dimming system
(not defined in Ultra HD Premium requirements) |
8-zone edge-lit local
dimming |
The
328P6A is heavily advertised as being an HDR capable display, although it cannot achieve some of the key requirements to
deliver a true, full HDR experience unfortunately. On the plus side, the screen has
the necessary extended DCI-P3 colour space and 10-bit
colour depth support, although the resolution maximum is 2560 x 1440 so it can't
truly support Ultra HD Premium content without scaling the resolution down. The
extended colour gamut will give a nice
boost in colour vividness though for HDR content.
Local dimming is achieved through an 8-zone edge-lit backlight, which is fairly
typical for mid-range HDR desktop displays. We saw the same 8 zones on the
Samsung C320HG70 recently for instance. This is capable of boosting the
brightness on parts of the screen while simultaneously lowering the brightness
of darker regions. It doesn't give the level of control that a Full-Array Local
Dimming (FALD) backlight would, but does provide some local dimming benefits to
make HDR possible. See our detailed
High Dynamic Range
article for more information on dimming methods.
Despite the local dimming capability, one area where the 328P6A misses out when it comes to HDR is in offering a
higher peak luminance. There is no peak brightness spec provided and the screen
is only capable of reaching a little way beyond its normal maximum brightness of 450 cd/m2
maximum according to our tests. It can't reach the levels of a 1000 cd/m2
peak brightness but it does support pretty high levels of brightness for a
desktop display. See the tests in a moment for more information.
HDR
Contrast and Peak Brightness
We measured the luminance and contrast performance of the
screen in HDR mode in a variety of scenarios. A white box is displayed on the
screen which covers 1% of the overall screen size initially. This is designed
to show at several target luminance levels, starting at 100 and then changing to
400 and 1000 cd/m2 (and beyond if needed). We measure the actual
luminance of that white box to see how close to the target luminance the screen
actually performs at each step. When the screen reaches the maximum peak
luminance possible, we also measure the black depth of the screen at a point
furthest away from the white area. This can then allow us to calculate the HDR
active contrast ratio, the difference between the bright white area on screen, and the
dark black areas elsewhere.
This 1% white screen coverage is designed to give a rough representation of how
a small highlight area in HDR content might appear and work in normal
multimedia. The box then increases to a larger size, covering 4, 9, 25, 49 and
finally 100% of the screen area. This represents different sized areas of bright
content in HDR multimedia. Again those progressively larger boxes are shown at
the different luminance targets, and we measure the actual screen luminance
achieved for each.
|
White window size |
100 cd/m2 target |
400 cd/m2 target |
1000 cd/m2 target |
|
Peak luminance
(cd/m2) |
Min black depth
(cd/m2) |
HDR contrast (x:1) |
|
1% |
176 |
484 |
526 |
|
526 |
0.28 |
1,879 |
|
4% |
176 |
482 |
525 |
|
525 |
0.32 |
1,641 |
|
9% |
175 |
480 |
522 |
|
522 |
0.32 |
1,631 |
|
25% |
175 |
480 |
522 |
|
522 |
0.31 |
1,684 |
|
49% |
174 |
478 |
520 |
|
520 |
0.28 |
1,857 |
|
100% |
174 |
479 |
520 |
|
520 |
n/a |
n/a |
When
you enable the HDR mode in the OSD menu you are also able to adjust the
brightness control yourself, and this has an impact on the peak brightness
levels achieved by the screen. We put the screen at 100% brightness for these
tests so as to push the brightness of the screen to the max for HDR content. With
all the different sized white boxes, you can see the results are pretty much the
same. Content intended to display at 100 cd/m2 is a bit too bright at
around 175 cd/m2. Content mastered at 400 cd/m2 is
displayed at around 480 cd/m2 which is not too bad. By the time you
reach content mastered at 1000 cd/m2 you reach the upper limit of the
screen's backlight capability, with a peak luminance achieved of around 525 cd/m2.
We would have liked to see the 100 and 400 cd/m2 content more closely
match the intended luminance. You can lower the OSD brightness so that 100 cd/m2
content is displayed at 100 cd/m2, but it has a significant knock on
effect and lowers the 400 cd/m2 content well under the target.
With
a peak luminance of around 526 cd/m2 we measured a black point on the
same screen of 0.28 cd/m2. This gives rise to an HDR contrast ratio of
1879:1 which was a decent way beyond the normal static contrast ratio of around
1287:1. There is an improved contrast but nowhere near the Ultra
HD Premium HDR standards where 20,000:1 is desired for an LCD display. It looks
like the local dimming is not capable of lowering the dark parts of the screen
sufficiently low enough, and is likely limited by the IPS panel where black
depth isn't really a strong point anyway.
Conclusion
The 328P6A provides a pretty good general
screen, but does feel like it's stuck a little bit between target markets. On
the one hand you've got some higher end professional features like 10-bit colour
depth, wide gamut support and a very good uniformity correction feature. On the
other hand, the factory calibration was a disappointment since the sRGB and
Adobe RGB emulation modes are unusable because of the locked brightness control.
It's a shame as they worked very well, and would have given you a lot more
flexibility to work with different colour spaces. Additionally there is no
support for hardware calibration on this model, so it doesn't offer that level
of accuracy and control that you'd get from most professional grade screens.
Then the screen is also aimed at HDR
multimedia uses. That's certainly heavily promoted on the spec pages for this
screen. It does a nice job of offering the boosted colours necessary for wide
gamut which is nice to see, and there's a modest 8-zone local dimming backlight
utilised as well. However, the peak brightness performance is a little low
compared with some HDR screens, and the local dimming backlight struggles to
achieve any significant HDR contrast ratio in practice - partly due to the
limitations of the IPS technology.
Overall though the 328O6A offers solid all
round performance you'd expect from an IPS panel, including a strong contrast
ratio for this technology. It comes with a nice set of connections and extras as
well.
If you appreciate the review and enjoy reading and like our work, we would welcome a
donation
to the site to help us continue to make quality and detailed reviews for you.
|
Pros |
Cons |
|
Strong contrast ratio for
an IPS panel |
Unusable factory
calibration modes including sRGB emulation due to locked brightness
control |
|
Very good uniformity
correction feature |
Poor uniformity on our
sample without SmartUniformity enabled |
|
Good all round
performance from IPS panel |
HDR experience a little
limited |
|
Check Pricing and Buy - Direct Links
|
|
Amazon
|
|
TFTCentral is a participant
in the Amazon Services LLC Associates Programme, an affiliate
advertising programme designed to provide a means for sites to earn
advertising fees by advertising and linking to Amazon.com, Amazon.co.uk,
Amazon.de, Amazon.ca and other Amazon stores worldwide. We also
participate in a similar scheme for Overclockers.co.uk. |