So all packages come with the
i1 Pro device itself, but have varying levels of support for projectors and
printers. For our purposes here we are only interested in the display
calibration which is supported in all three packages. A summary table of
supported features is shown on X-rite's website
here.
Pricing will of course vary, please refer to X-rite's website for more
information about them all.
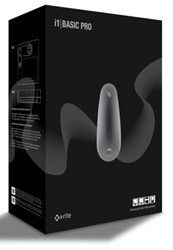
The i1 Basic Pro package is
adequate for our needs therefore and comes in a similar package to the i1
Extreme we had been sent before to use in our i1 Pro review.
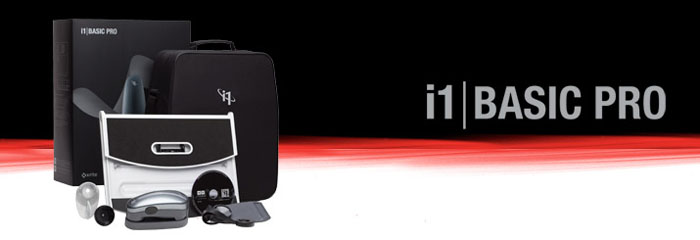
i1Basic Pro includes:
i1Pro spectrophotometer (measurement device); ambient light measurement head;
monitor holder; positioning target; scanning ruler; backup board; i1Publish
Software: i1Profiler v1.x software for monitors and Pantone Color Manager;
soft-sided storage case.
The i1 Pro device itself
remains unchanged so I will not repeat what we have already discussed in
our full review. The purposes of this review is to really test their new
software package provided for display profiling, which is called i1 Profiler.

i1Profiler Software
X-rite's website states: "With the new i1Profiler software, X-Rite has developed a next generation
toolset that combines the best features of its i1Match, ProfileMaker and
MonacoPROFILER solutions. i1Profiler software offers an unprecedented level of
flexibility to address the needs of digital imaging workflows. It features a
number of unique color management capabilities, adding to users’ power and
control in creating professional quality profiles. Users can chose between a
‘basic’, wizard-driven interface; or an ‘advanced’, user-driven interface to
create high quality, precise, custom color profiles for monitors, projectors,
printers, and presses (device support dependent upon product purchased)."
For those wanting to calibrate
printers there are further features of course which we will not be testing here:
"At the core of i1Profiler is X-Rite’s i1Prism engine, whose unique profiling
technology lets users build printer profiles for up to 8-color workflows (RGB,
CMYK and CMYK plus any 4). This reliable, intelligent iterative technology is
extremely robust, allowing for further profile optimization based on any
combination of images, spot colors or captured colors, resulting in the best
possible image quality and color accuracy. Users can select from any of the
included Pantone color libraries, including the new Pantone Plus Series. Users
can further adapt their profiles to specific ambient light conditions,
compensate for optical brighteners in their papers (with an i1iSis), and utilize
simple yet advanced controls for black separation. i1Profiler lets users save
and re-use assets or preferred settings with drag-and-drop functionality -
meaning profile generation workflows can be created or shared with others
quickly, easily, and efficiently. This exchange functionality also allows users
to communicate palette information and other color data across the office or
around the world using X-Rite’s Color Exchange Format (CxF) for the most
comprehensive digital color data exchange."

From a display point of view, the included
i1Profiler software features basic and advanced modes for calibrating and
profiling your monitors. The following is taken from X-rite's website:
-
Display true colors on each of your LCD, CRT and laptop monitors in basic or
advanced mode
-
Create profiles for any ambient light condition for optimal viewing for color
critical work
-
Unlimited gamma white point and luminance settings including native gamma and
measure luminance as target
-
Workgroup match utilizing reference profiles to match all monitors
-
Gray
balance optimization for more neutral and better defined grays, in any
lighting condition
-
Chromatic adaptation formula for a closer visual match of different monitors
(or of different settings on one monitor) with different white points
-
Preview before and after results with supplied image or your own
-
Monitor Quality Assurance – validate and trend monitor performance
-
Profile summary report ideal for post profile analysis
-
Automatic Display Calibration (ADC) support for leading industry monitors
(with support)
-
Profile reminder to ensure true and reliable color over time
When installing i1 Profiler you
are also offered the additional Pantone Color Manager and ColorChecker passport
software packages but those are really for printer profiling and testing.
Profile Creation and Calibration Process
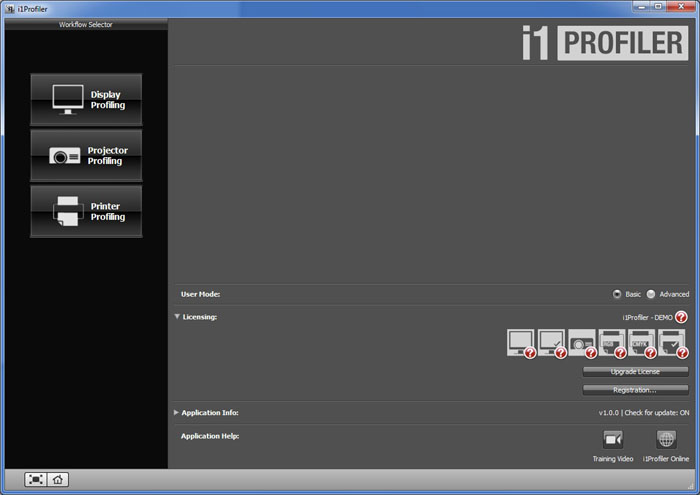
When the
i1 Profiler software is loaded you are presented with the above
summary screen. The left hand section of the screen allows you to choose the
type of device you are profiling, in our case we are only testing the software
with a display. The right hand side of the screen has some further settings. I
have zoomed in on this below.
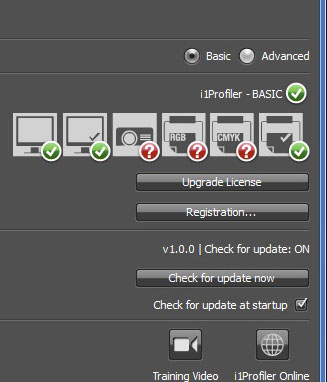
You can select between the 'basic' and 'advanced' calibration
modes here. The section below confirms which version of the software you have,
whether that is basic, photo or publish. It will then tell you which options and
settings you have access to. In the i1 Basic Pro package you can carry out the
monitor profiling and tests and those are shown with a green tick as you can see
above. You can also upgrade your license within the software and check for any
software updates. We are testing v1.0.0 of the software which was released at
launch.
I selected 'Display profiling' from the left hand side of the
screen to begin the process, first of all leaving it in the basic mode.
Basic Mode Profiling
I will begin by walking through the
'basic' profiling wizard.
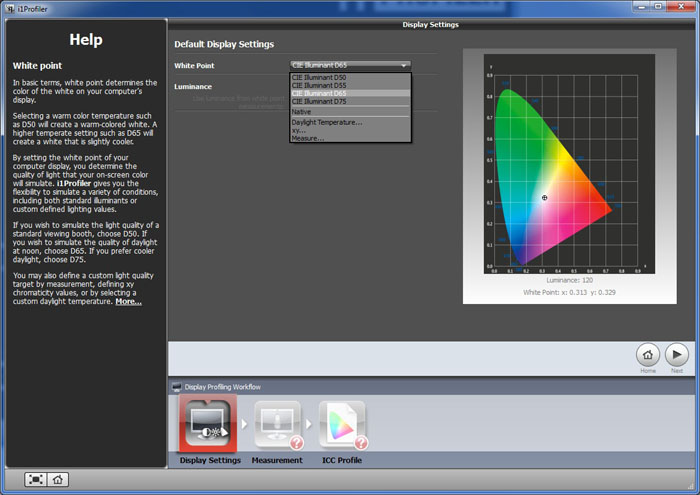
Once you have entered the display profiling section the left hand part of the
software acts as a help window, giving you some information about many of the
options as you select them. The bottom section of the screen shows your workflow
diagram, showing you the steps in the calibration which will be performed to
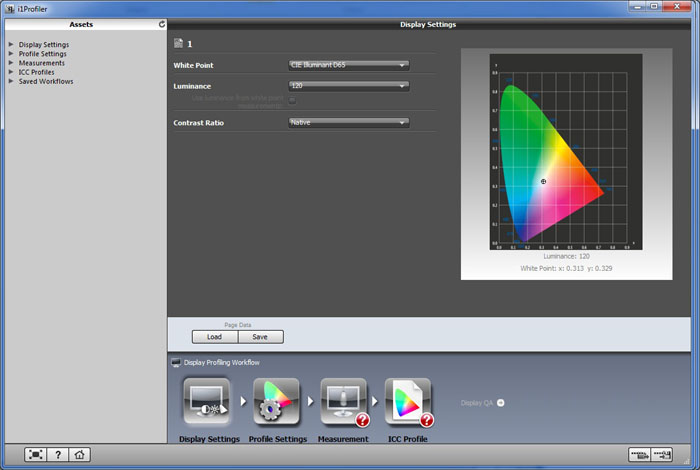
create a new profile. This is initially highlighted on 'display settings' as shown
above. In the basic wizard you are presented with the options to define your
target white point and luminance. By default the software is set at D65 (6500k)
and 120 cd/m2 which are the targets we use in our reviews. You can
also set white point to D50 which is commonly used in pre-press, or 'native'
which will retain your monitors native white point if you have set it by some
other method and do not want to change it. Again the luminance target can be changed
depending on your ambient lighting conditions and preferences.
On a side note, if you have more than one screen connected
then the software gives you an option to choose which display you want to
profile.
You can progress onto the next section by pressing either the
'next' button or just clicking on the next step in the process at the bottom.
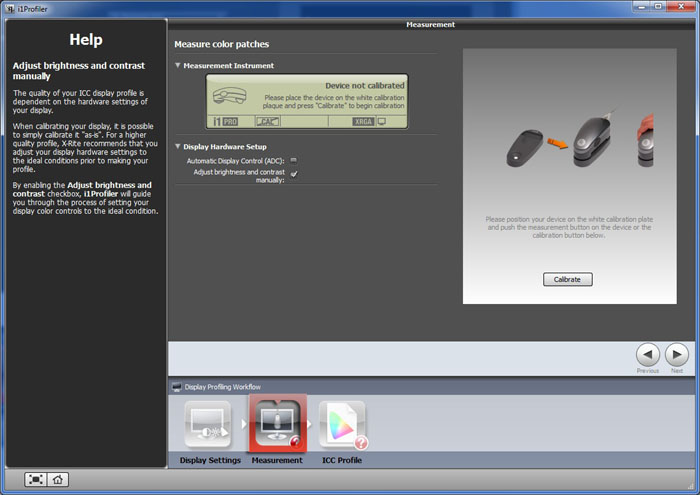
The next section is the 'measurement' section. You are asked
to connect and calibrate your i1 Pro spectrophotometer, something we were used
to from other software packages as well. This calibrates the device itself to a
white reference point on the tile provided. You are also presented with two further options. The
first you can tick if your display is capable of automatic display control
(ADC). This is a feature available on some higher end screens, for instance the
NEC PA series where hardware level calibration is possible. You are also
presented with an option to allow you to change the brightness and contrast
settings from your screens OSD during the process if you have them available.
This will help guide you to obtaining the optimum contrast and brightness
hardware settings before the profiling is carried out.
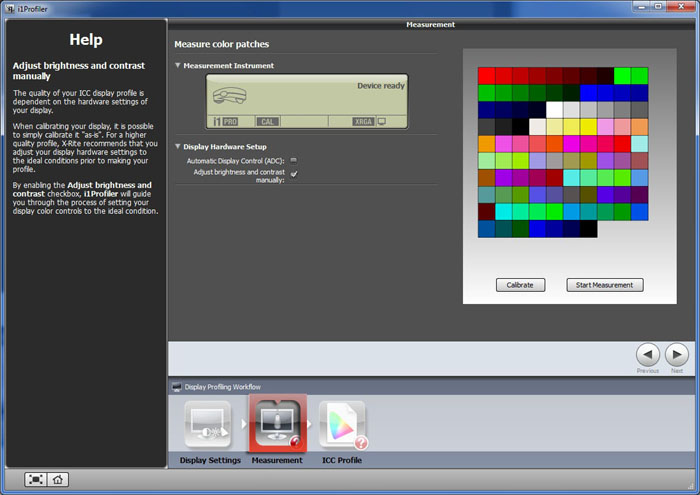
Once you have calibrated the i1 Pro device the software confirms the
device is ready. On the right hand side you are presented with a colour tile
range which shows you the colours which are going to be tested during the
process. You can begin the calibration / profiling process from here by pressing
'start measurement'.
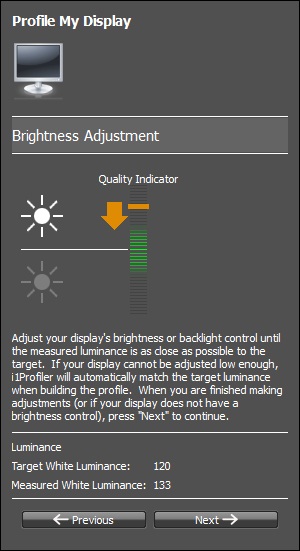
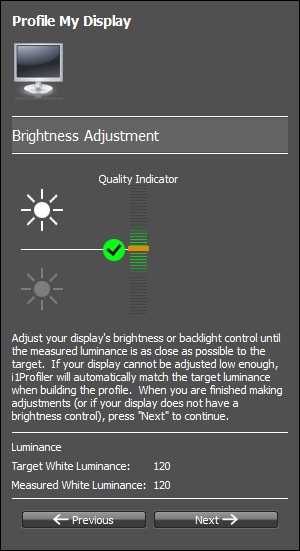
The software then reverts to full screen and asks you to
position your device in the middle. If you have selected manual contrast and
brightness adjustment you are first guided through this process. For instance
above is the adjustment of the brightness setting. The screen measures the
current luminance against the target you have previously defined. The quality
indicator bar guides you to obtaining the optimum setting as you adjust your
monitors brightness control up or down. This is very simple to follow and works
well. It is a shame that there is not another section which guides you to obtain
the optimum RGB levels if you have access to those via the OSD menu. That is
something missing from the i1 Profiler process.
You then press next which enters you into the automated stage of the process.
The software flashes many different colours and shades in front of the device
and the whole process takes about 1 min 42 seconds to complete.
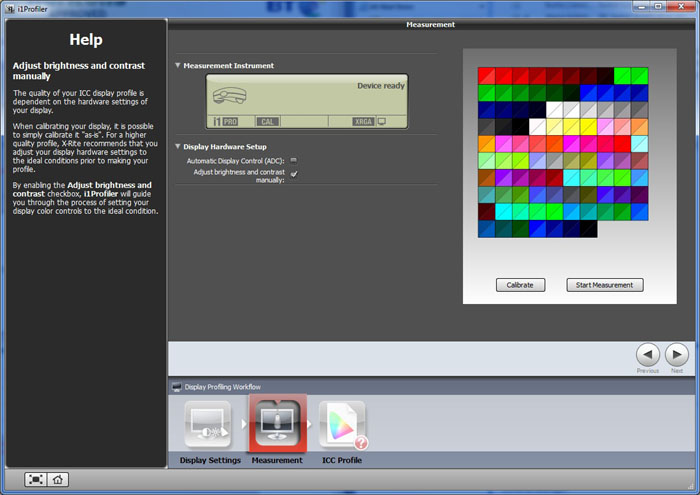
At the end of the process you are taken back to the
'measurement' screen. Here the colour tiles have changed slightly to show you a
before and after visual view. The upper left section of each tile is the expected
value, and the lower right hand section is the measured value. There's no
further information given though, just this fairly basic visual guide.
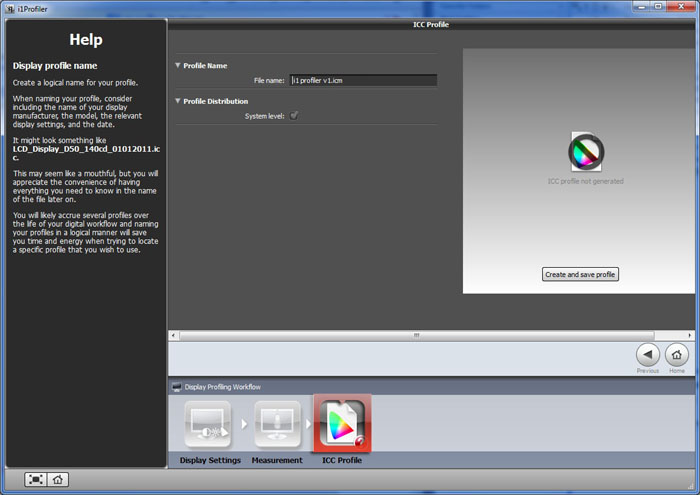
If you press 'next' or just click the 'ICC profile' step at the bottom you are
prompted to name and save the profile you have just created. You can also make
it active at a system level, not just for the current active user if you want.
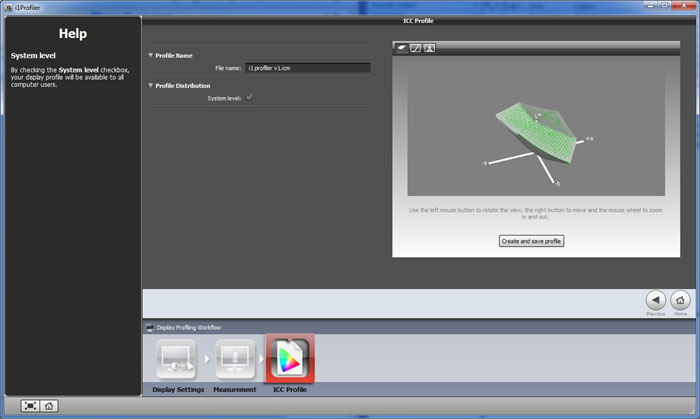
After this you are presented with some basic validation
options on the right hand side. The first one is shown above and this is a 3D
visualisation of the screens colour space. You can drag and drop to move this
around if you wish to view from different angles.
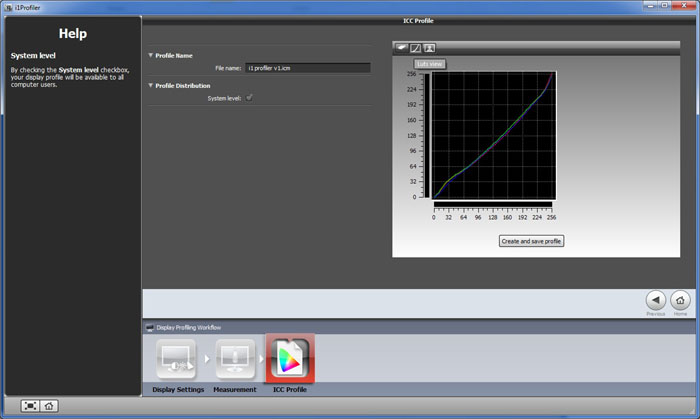
The second part of this basic validation shows you the gamma
curves of the calibrated screen. There isn't much offered in the way of
explanation to any of these features though. Referring to the
X-rite training videos confirms that this graph shows what adjustments have
been made to the graphics card LUT in order to help meet the defined calibration
targets.
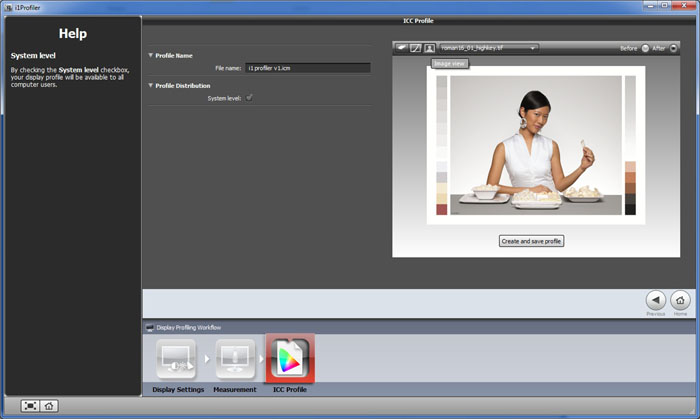
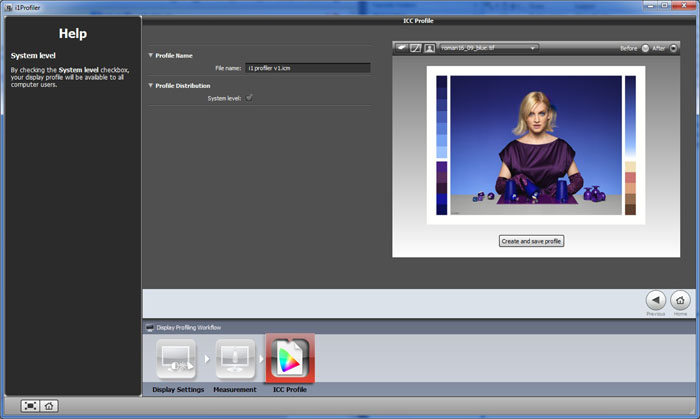
The last part presents you with
a drop down selection of images. You can then tick the before or after radio
buttons to view and compare visually. This is designed to help you evaluate your
monitors colours. There are lots of different images available designed to test
different colours and shades and show what difference the profile and
calibration has made. These are really the only evaluation stages offered after
the initial calibration. Nothing particularly scientific but a decent range of
visual tests I suppose. These are not really very good in terms of
verifying your calibration success though so we will need something a little
more detailed from the softwares other sections.
A video walk through of this basic calibration process for
displays is available in
X-rite's training videos
Advanced Mode profiling
I returned the main screen and this time selected the
advanced mode for profiling. Entering the display profiling option now gives you
a wider selection of configurable options. This process will also give you
access to the 'Display QA' tool for some more detailed validation of the
process. In this mode you must click on the relevant step at the bottom to
define your settings and carry out the profiling.
On the first screen you are again asked to define your target
white point and luminance. You are also able to now define your target contrast
ratio, although leaving it on 'native' will aim for the highest possible which
is what we want to do here.
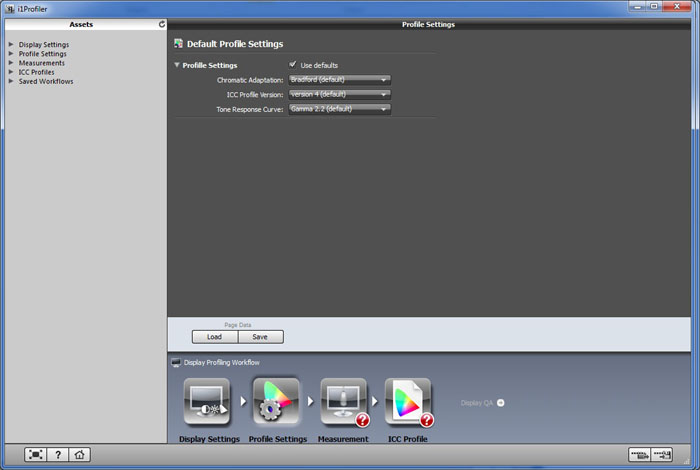
Clicking the 'profile settings' step at the bottom gives you
some further options to change if you like. There are various different
chromatic adapations available, with the default being 'Bradford'. You can
choose between ICC profile v2 or v4 and also define your target tonal response
curve (i.e. gamma). We have stuck with the default Bradford adaption, ICC
profile v4 and 2.2 gamma here.
From here the rest of the process is as before. You can
manually change your OSD brightness and contrast settings if you selected that
option, and then the automated calibration is carried out. Again this takes
around 1 min 42 seconds in this advanced mode. You can then save the profile and
carry out the basic validation steps we looked at before in the 'basic' mode.
Display Quality
Assurance (Display QA)
This advanced mode
also gives you access to the more in depth
'Display QA' feature. This is accessed by pressing the small arrow in the lower
section after the ICC profile step (as shown in the images above). It can also be accessed from the main home
screen of the software if you are in advanced mode. The 'Display QA' option is
available from the left hand menu. This is used to determine how well your
display is reproducing colours after the profiling has taken place.
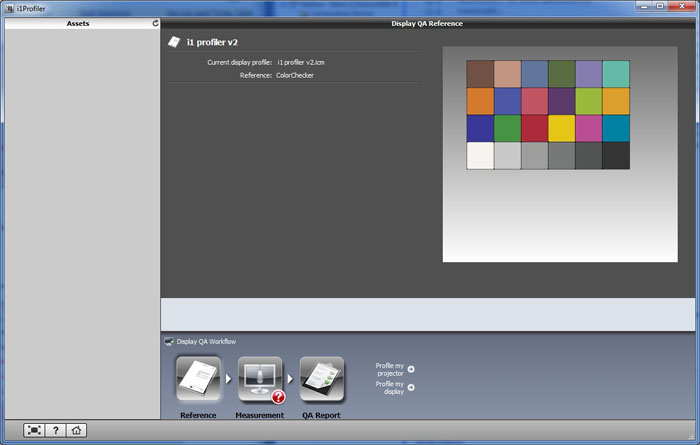
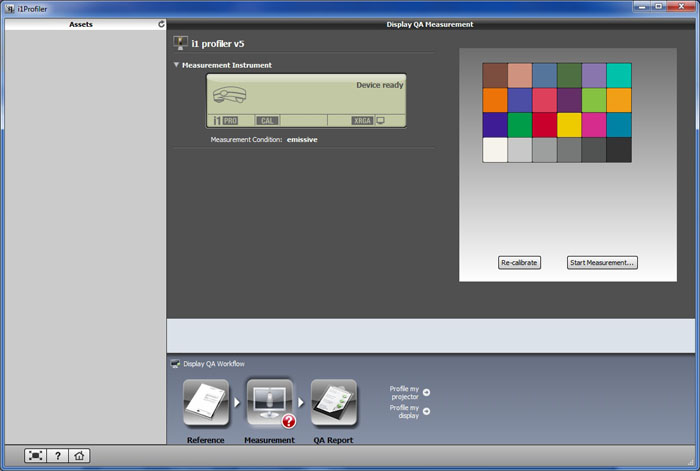
You are first presented with the above screen which doesnt
really do anything or offer you any information other than to confirm on
currently active profile. On the right hand side there is a set of colours shown
based on the Munsell ColorChecker target. These are the shades and colours which
will be checked during the validation. You have to click the 'measurement'
step at the bottom of the screen to progress to the next stage.
Here you are asked to calibrate the i1 Pro device as before
using the provided white tile. There is then a button on the right hand side to
'start measurement'. You are prompted to hang the device on the screen again.
The software flashes a series of colours and shades in front of the device and
the i1 Pro records the difference between the colour displayed, and the value
being requested from the reference Color Checker targets. This whole process
takes around 30 seconds to complete.
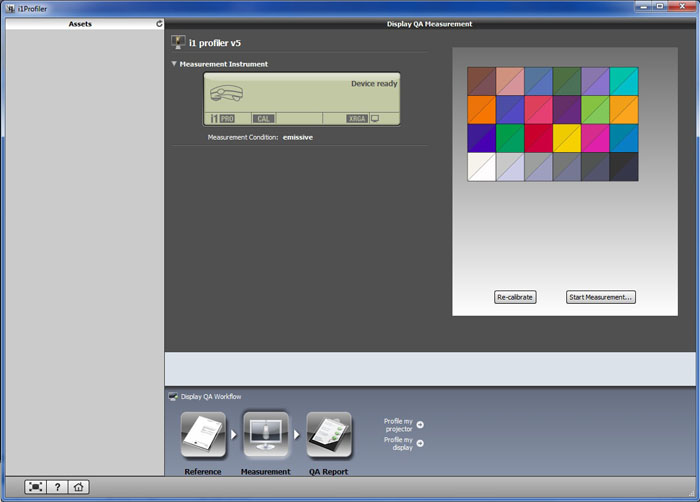
At the end you are presented with the same tile graphics as
shown above. The tiles are split, with the top left showing the colour requested
and the bottom right showing the colour displayed. Again at this stage only
really a quick visual comparison.
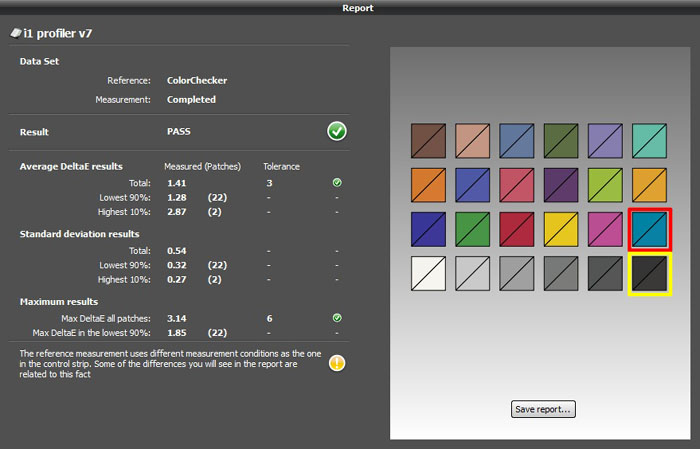
Above:
zoomed in view of Display QA report
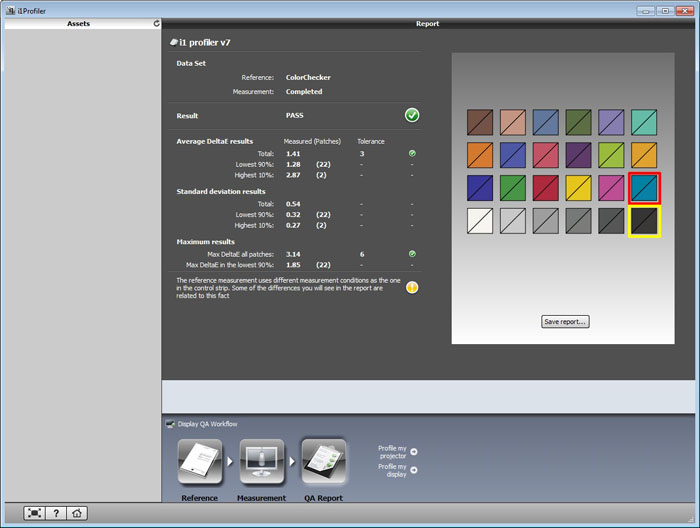
By clicking the 'QA report'
step at the bottom you are presented with a more detailed analysis of the
displays performance as shown above. The left hand side confirms with a nice big
green tick that the profile you have created has passed the ColorChecker tests.
There is then some deltaE analysis, similar to what you are hopefully used to
from our reviews. The dE figure is a classification telling you how big the
difference is between the colour requested, and the colour produced. The lower
the dE the better.
Under the 'average DeltaE
results' section the software confirms that the average overall dE is 1.41.
Since dE of 3 is the tolerance level (i.e. anything less than dE = 3 is
considered good), it has passed overall. During our reviews we use
LaCie's Blue Eye Pro software which also gives dE figures. LaCie classify dE
readings as follows:
If DeltaE >3,
the color displayed is significantly different from the theoretical one, meaning
that the difference will be perceptible to the viewer. If DeltaE <2, LaCie
considers the calibration a success; there remains a slight difference, but it
is barely undetectable. If DeltaE < 1, the color fidelity is excellent. So in
this analysis from the i1 Profiler software dE is 1.41 average, and LaCie would
classify this as being very good, close to excellent but with some slight
difference in some cases.
Beneath the total overall
average dE (1.41) there is an average dE for the lowest 90% of all the patches
measured. The 22 patches with the lowest dE reading are averaged here, and so
the overall average dE would be 1.28. The highest 10% equates to 2 patches which
averaged at 2.87 dE. These are the two patches which were furthest off from the
requested colour. These two patches are highlighted on the right hand tiles as
well in red and yellow. We will look at those in a moment.
The software also confirms the
total standard deviations average as well as the lowest and highest measurement
averages. This shows the deviations of the measurements from the expected values
according to X-rites help files and videos.
In the last section the
software confirms the maximum recorded dE which in this case was 3.14. It also
confirms the max dE in the lowest 90% readings which is 1.85 here.
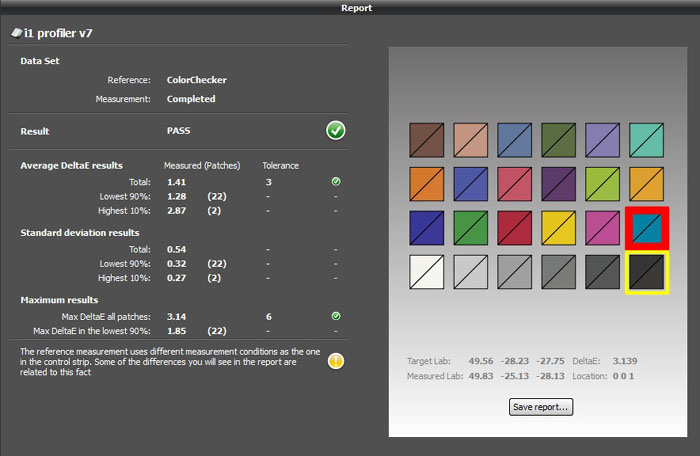
If you highlight any of the
tiles on the right hand site it brings up a little bit more information
underneath. You can highlight any of the tiles by simply hovering your mouse
pointer over them. Here I have hovered over the worst dE reading which was
already highlighted with a red square. This confirms the dE recorded for this
shade was 3.139 (3.14 rounded).
Click for larger version
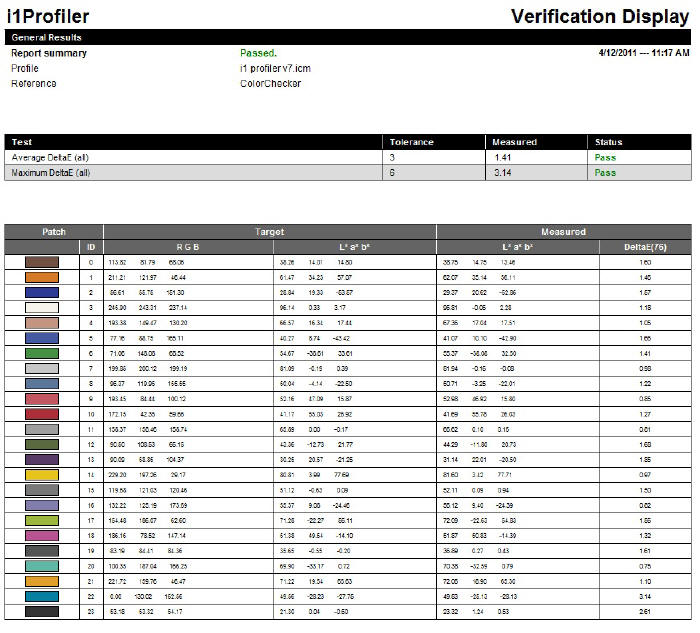
You can save the report as well
by pressing the integrated button. This saves it as a .htm file which you can
then open in your internet browser. It looks like the above, basically just
summarising all the details in the Display QA report and giving you some more
detail if you need it.
The Display QA reports are at
least more detailed than the standard post-calibration pictures you are given
after a 'basic' calibration. It's good to see verification of the measured
colour accuracy which seems to be the main focus of this software. There's
plenty of detail about the dE performance of each shade which is useful. It it
not quite as easy to follow / easy on the eye as the graphs produced from other
software packages such as LaCie's Blue Eye Pro or BasICColor's software. It
might have been nice to feature something a bit easier to refer to as a quick
reference.
It was also lacking additional
verification of other measurements you see from other software packages. There
was no real validation of the gamma reached, other than the curves in the basic
after-calibration report. There was no verification of your white point, despite
having defined your target before the calibration. There was also no
verification of your luminance, black depth or contrast ratio which was a shame.
It would have been nice to see these included to give you a fuller picture of
the displays capabilities and the success (or lack of perhaps!) from the
calibration process. The software can only really be used to validate the
profile you have created in terms of dE for different patches, and not much
else. It cannot really be used to measure a monitors default setup either as it
is only designed to validate a profile it has already produced.
A video walk through of this Display QA process is available in
X-rite's training videos
Validation
With LaCie Software
I
closed the i1 Profiler software and used
LaCie's Blue Eye Pro software with the i1 Pro device to check what it thought of
the calibration outcome. Not that it matters really for the purposes of ths
review, but we were using our office Dell 2405FPW monitor here for the tests.
The monitor was left at default settings in the colour and RGB menu and the only
hardware changes made were to the brightness during the i1 Profiler calibration
process.
Calibrated Settings Test

|
|
Calibrated Settings |
|
luminance (cd/m2) |
117.9 |
|
Black Point (cd/m2) |
0.19 |
|
Contrast Ratio |
621:1 |
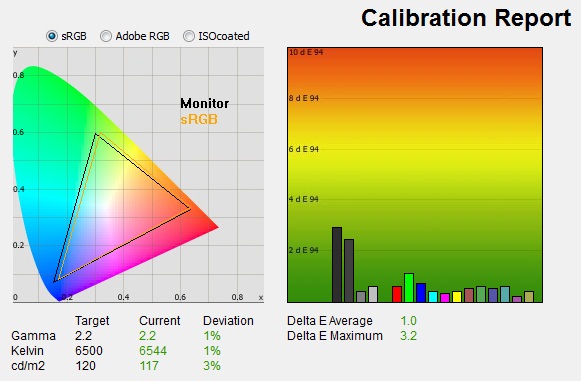
This LaCie report was run based
on the calibrated profile created during the i1 Profiler steps. The LaCie report
confirms gamma was 2.2 on average with a minor 1% deviation overall from the
target. The i1 Profiler software did not verify our calibrated gamma, but it's
good to see that the gamma we had originally defined as our target had been met.
White point was also measured at an accurate 6544k, being again only 1% out from
the target. As with gamma, this had not been verified by the i1 Profiler
reports sadly but it had nevertheless been met well.
Luminance was recorded here at 117 cd/m2 which was slightly lower than the target of 120 cd/m2. I
suspect this is because the i1 Profiler software guides you to find the optimum
brightness setting before the ICC profile is created, and so you are finding a
setting which returns ~120 cd/m2 at that point in the process. Further corrections to
colours, grey scale, gamma etc at an ICC profile and graphics card level could account
for the final luminance being a little lower. Black depth was recorded at 0.19 cd/m2
giving us a contrast ratio of 621:1. This was a similar result that we
have seen from tests with other software packages on this screen, including this
LaCie software and their Blue Eye Pro device. Again although the i1 Profiler software does not verify the
black depth at any point, it has managed to obtain a decent level for the screen
being tested, and produced a contrast ratio which is on par with other software packages. No
issues there thankfully with crushing blacks.
The LaCie software also
confirms the average dE is 1.0 which is actually ever so slightly less than the
i1 Profiler software reported (1.41). LaCie's software tests fewer shades however which
would account for the difference. Maximum dE here was 3.2 which is very close to
the 3.14 recorded by the i1 Profiler package. Overall the LaCie software concurs
with the output from the i1 Profiler software, while also verifying that the
gamma, white point, black depth and contrast ratio have been set up correctly
and as per the targets defined.
Conclusion
It's good to see a new range of packages released
incorporating the high end i1 Pro spectrophotometer device. As we have already
covered in
our full review, there's no doubt that it is a very reliable calibration
device and very well regarded. Of course most users would not have the need for
such an advanced and expensive device for calibrating just a monitor, but if you
are working in a professional environment and have the requirement to calibrate
multiple devices and want to include projectors and printers then it could well
meet your needs nicely. From a display point of view it is extremely reliable
and capable of calibrating and reading the widest range of display and backlight
technologies. At the time of writing the i1 Basic Pro package retails for ~£840
GBP in the UK. This is actually more expensive than the older 'i1 Basic' package
(~£685) and certainly a lot more than a high end colorimeter like the i1 Display
2 for instance (~£150). The more comprehensive i1 Photo Pro retails for ~£1,080
and the i1 Publish Pro is ~£1600.
The main thing we have tested here is the new i1
Profiler software from X-rite, a replacement for their rather old i1 Match
package. I did feel that the software was a little lacking in some areas
unfortunately. It is easy enough to use although is perhaps not as intuitive as
their older software to navigate. It's not always clear which step you are in
and what comes next. The online training videos are short and to the point but
do help clarify which is one thing at least. Thankfully the process is
reasonably quick which is a positive. It was good to see the inclusion of a
luminance / contrast adjustment guide which works very well, although for some
reason RGB adjustment guides are lacking. The basic mode also doesn't really
offer you much in terms of control and the validation reports are very basic.
There is nothing really there other than some basic visual tests using different
coloured photos and a before and after tick box. That might be ok to give you a
nice warm feeling that it has made a change to your setup but it's hard to just
trust it on face value without any kind of proper measurements we can study and
compare.
Thankfully the advanced mode is a bit better, and
also gives you control over a further target for gamma. The Display QA feature
is a welcome enhancement over the basic validation tests. There is a lot of
information here about colour accuracy which is good, and that is very thorough.
However it was a shame not to see measurements of the before and after gamma,
white point, luminance, black depth and contrast ratio. All of these are
reasonably basic measurements you would probably want to see, but are lacking in
the i1 Profiler software. The older i1 Match software included these in fact
along with a gamma curve graph and CIE colour space representation of the
displays gamut. Although the dE information is useful it would have been good to
see it presented in some form of graph for quick visual reference.
Thankfully the profiling process itself has proved
to be very reliable. We validated the results of the calibration using the LaCie
Blue Eye Pro reporting (a good example of the type of reports which are very
useful!). Although the i1 Profiler software hadn't confirmed the targets for
gamma, white point, luminance and contrast ratio had been met after it had
finished the calibration, the LaCie software confirms they had been. This was a
pleasing result and at least you can have some faith that the process you are
carrying out is doing a good job, even if it doesn't tell you so at the end.
Overall the results were good but the software was lacking in some reporting
capabilities unfortunately from a display calibration point of view. If you are
going to spend the money on an i1 Pro spectrophotometer package then you may
well want to invest in a more advanced software packages from a third party.
|
Pros |
Cons |
|
High end spectrophotometer
device included in new i1 Pro solutions |
Lack of reporting features for
gamma, white point, luminance, black point and contrast ratio |
|
i1 Profiler produces reliable
results |
Sometimes not very intuitive
to navigate i1 Profiler |
|
Decent dE colour accuracy
reporting from Display QA feature |
No guidance on setting
hardware RGB levels |
Discuss this
review in our forum. For further information please visit
www.xritephoto.com or tel X-rite: +44
(0)1625 871100