|
|
|
|||
|
||||

|
|
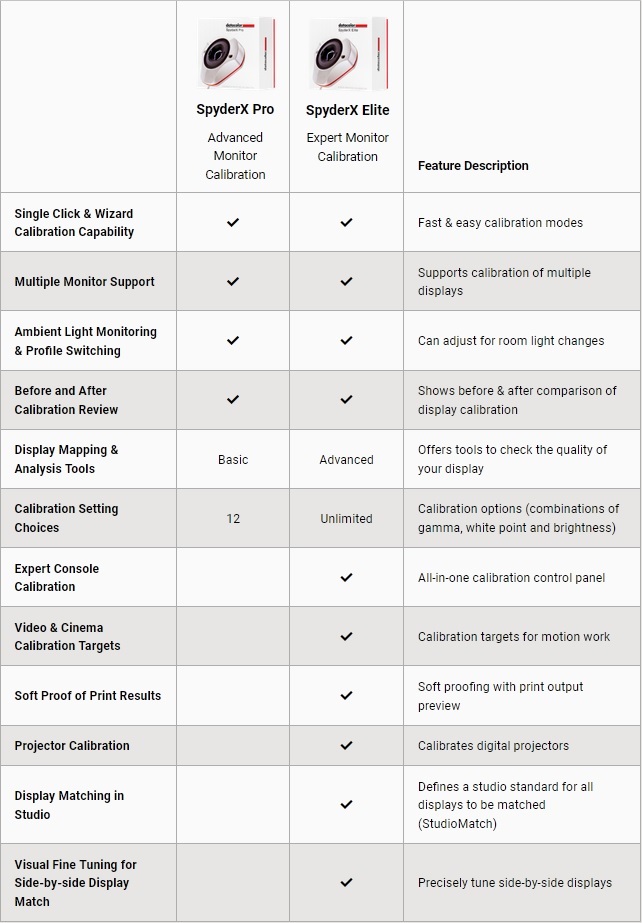
The SpyderX series has a range of benefits and features, rather than re-write these in our own words we have included what is listed on the Datacolor website which explains each feature nicely:
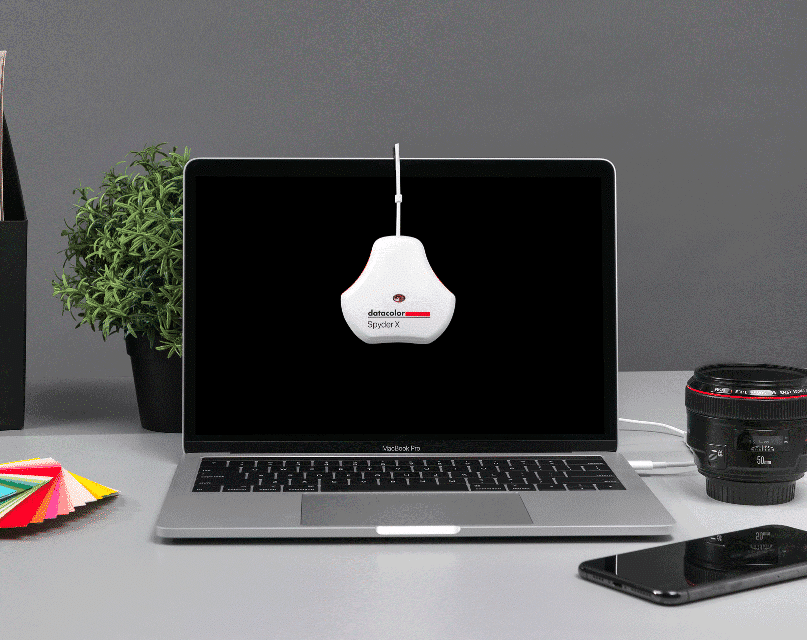
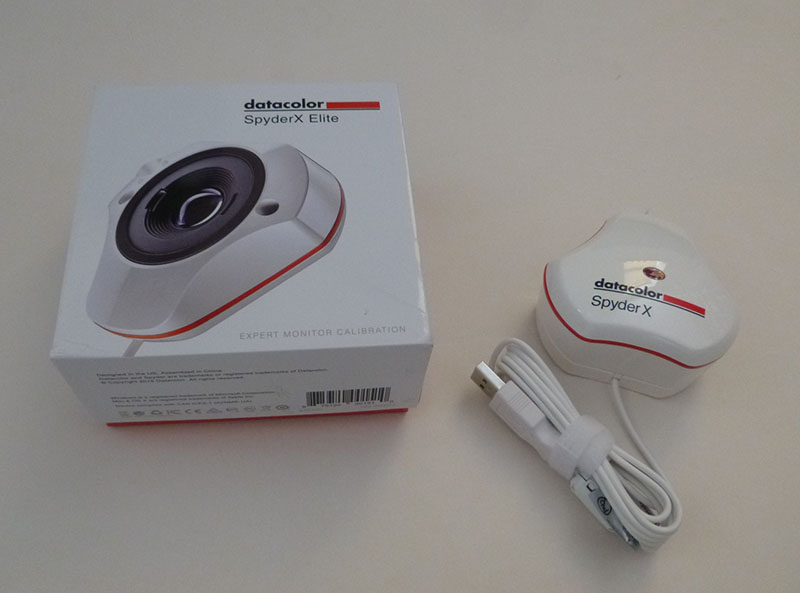
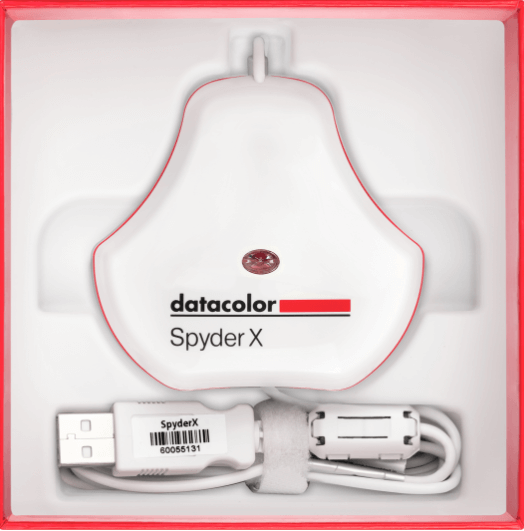
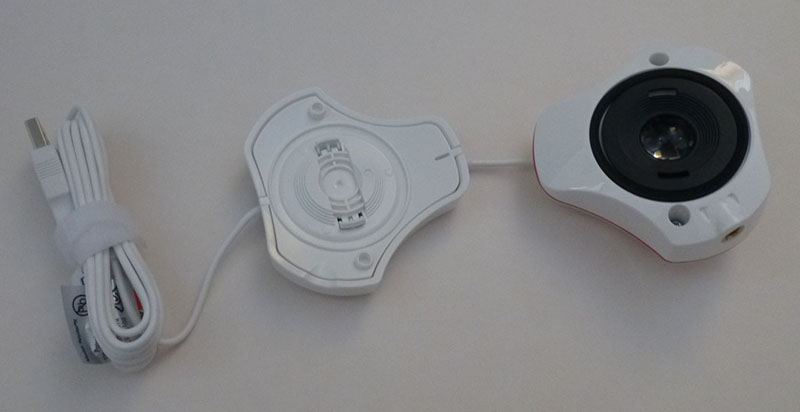
In the small and neat 12 x 12cm box you get the SpyderX sensor, a welcome card with a link to software download and your warranty information, a unique serial number to activate the software (which dictates which features you will have access to based on the package you bought) and a link to online demos, users guides and videos.
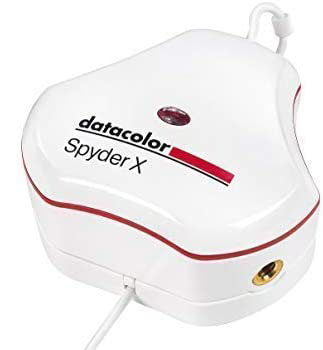
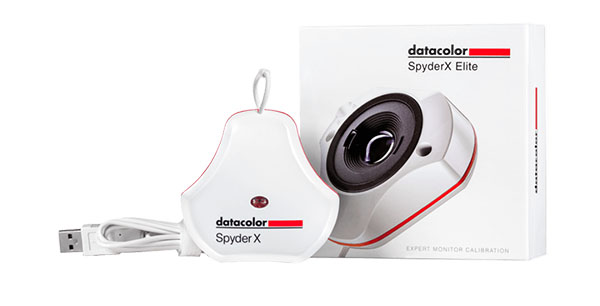
There are two main packages for the SpyderX device and software, those being the SpyderX Pro and SpyderX Elite (we have with us the Elite version). The actual device is the same in both, but the Elite package allows for more functions and options from the software. The additional features of the Elite package are shown in the comparison table below.
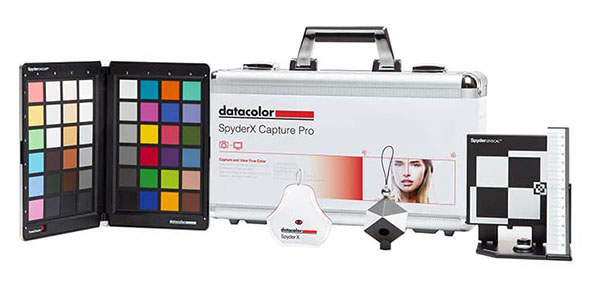
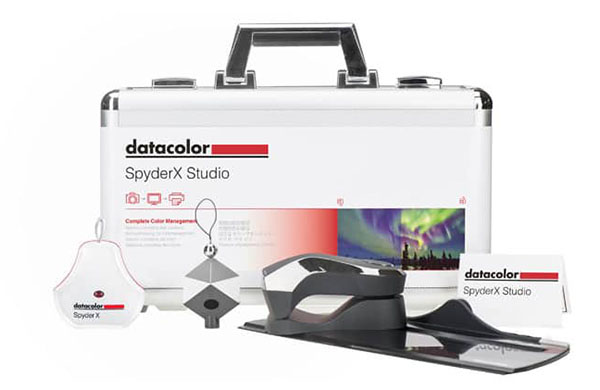
There are also a couple of additional more advanced packages available which build on the SpyderX Elite package but include a range of additional options aimed at cameras, printers etc. The Capture Pro package is about 100 Euro more than the Elite solution, while the Studio package is another 50 Euro on top of that. SpyderX Capture Pro
"The ultimate color management tool kit, providing all the essentials needed to precisely manage color in your workflow from capture through editing." Includes:
SpyderX Studio
The essential all-in-one photographic workflow solution for precision control from capture, to editing to print. Includes:
We installed the latest v5.4 SpyderX Elite software from the Datacolor website and went through all the options, calibration steps and validation sections. We will try and give you a good overview of these below.
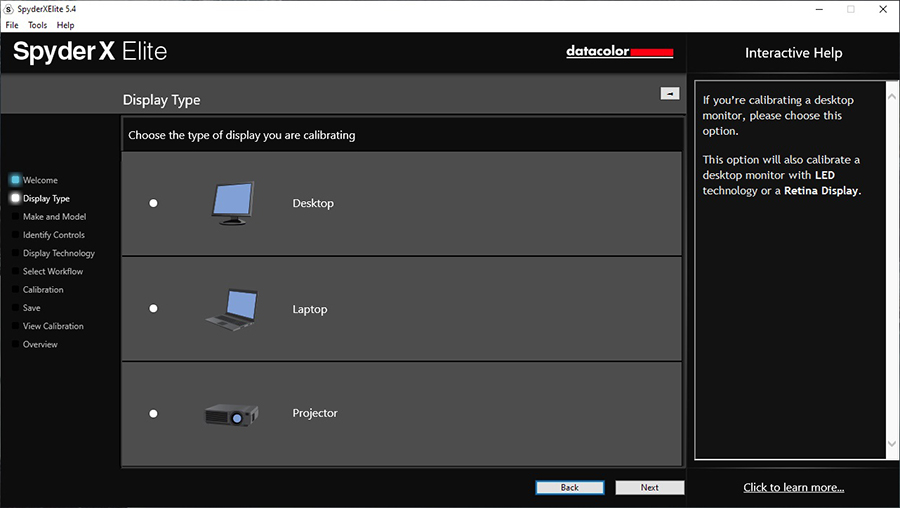
When you load up the software you are asked a series of questions as part of the initial setup, about the display you want to calibrate and measure.
You can select the display manufacturer and enter the model number which will be used to identify your display later on and name the profile and reports.
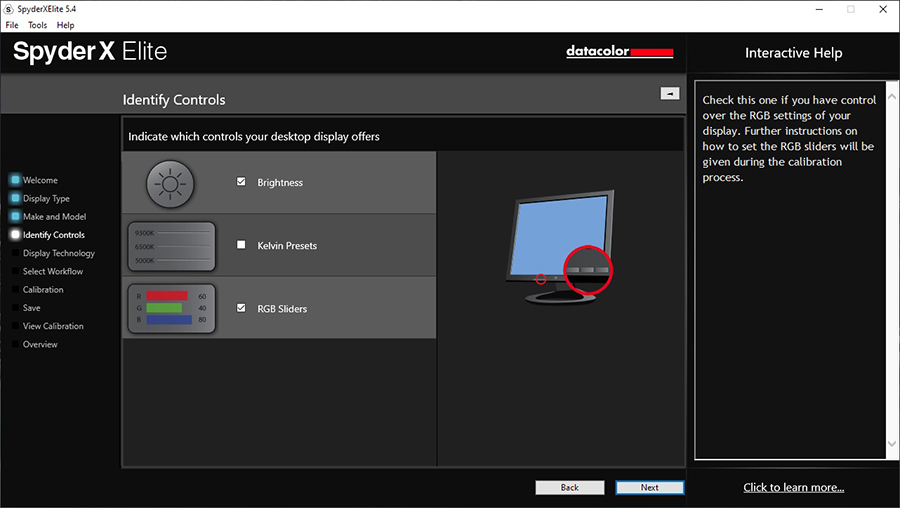
You can also identify which settings are available within your monitor OSD, and these will then be accounted for during the calibration process and guide you through obtaining the optimal OSD settings first of all, before any corrections are made to the graphics card Look Up Table (LUT). Making adjustments first to the monitor hardware via the OSD is important as it helps retain tonal values and avoid unnecessary graphics card LUT adjustments that might lead to colour loss or other issues like banding.
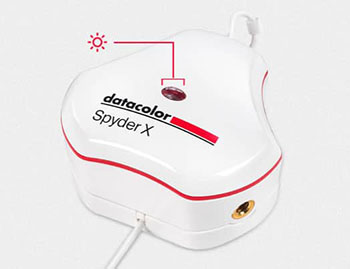
You are then guided through selecting your backlight type, as the new SpyderX has been specifically created to support all the modern display backlight types, including common wide gamut LED options.
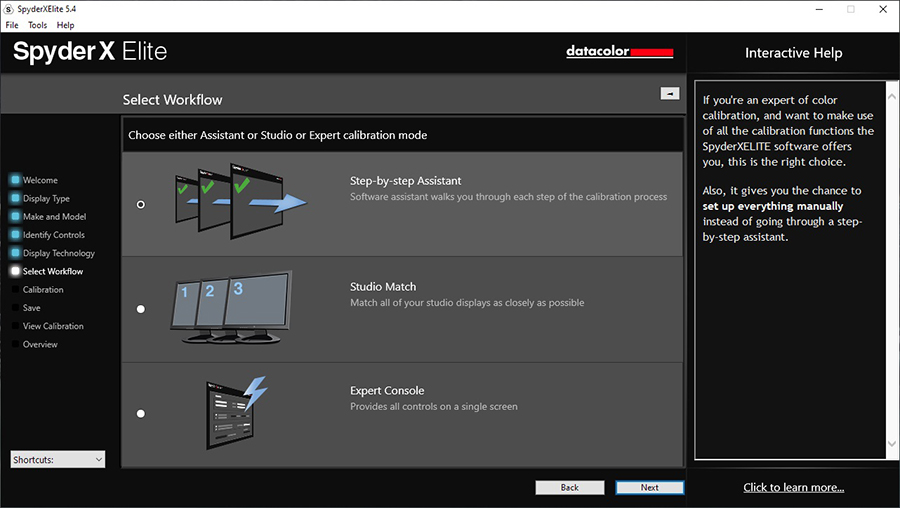
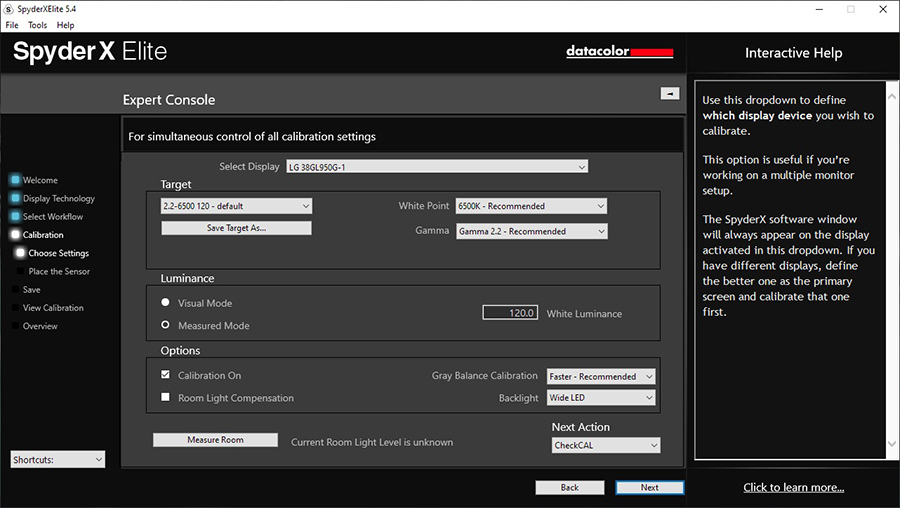
You can choose which calibration method you want to follow, depending on whether you want a more simple step by step guide or to use the "expert console" when you're perhaps more used to the software or want to make tweaks.
The 'expert console' looks like the above, which may be preferred by some to the step by step walk through.
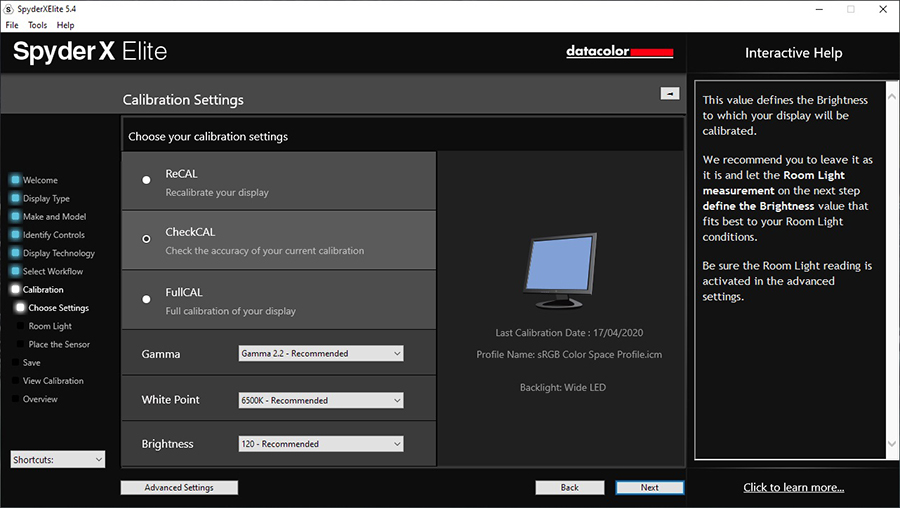
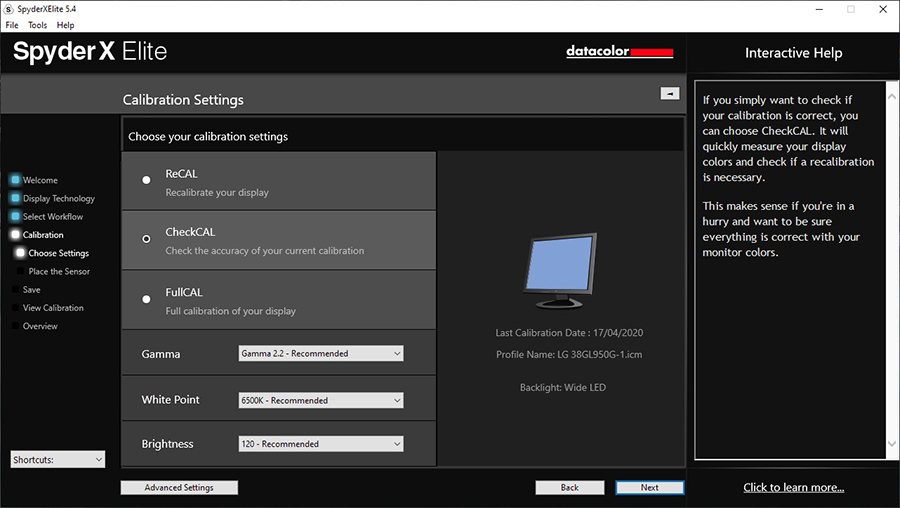
We selected the step by step assistant for now to follow through a typical calibration. You can also choose to recalibrate the screen here if it's been previously profiled, or just complete some basic validation checks (which we will show you later on) through the CheckCAL option. Those validation steps are also included at the end of a calibration process. You can also define your targets for gamma, white point and brightness here - it was nice to see that the targets we aim for in our reviews as standard were the default options here!
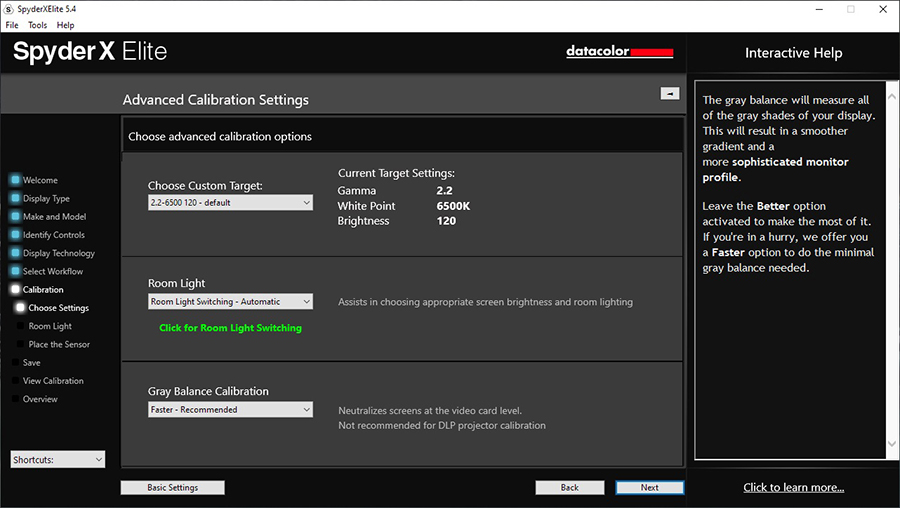
The advanced calibration settings menu gives you a few more options to change if you want, including whether you want the device to measure your room ambient light and calibrate the screen brightness accordingly. That might be useful if you want to create something specific to your room and light conditions.
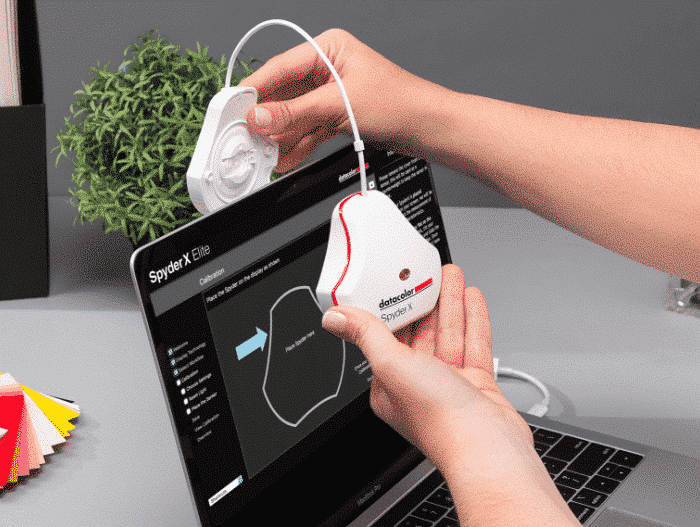
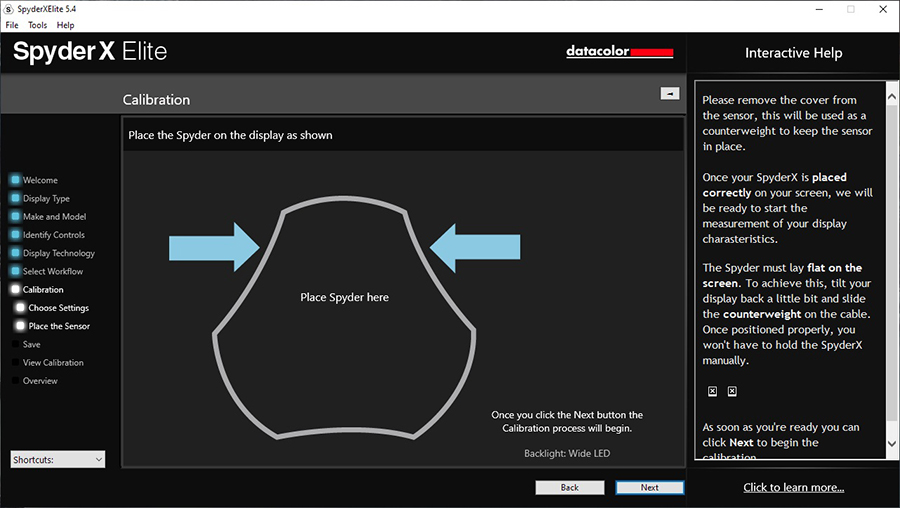
Proceeding to the calibration process guides you to place the device on the centre of the screen where shown. You are guided through some simple OSD adjustments for things like the brightness control, and then the rest of the process is automated for you. It took about 3 min 15 seconds from start to finish including the OSD adjustment process which was good and nice and fast.
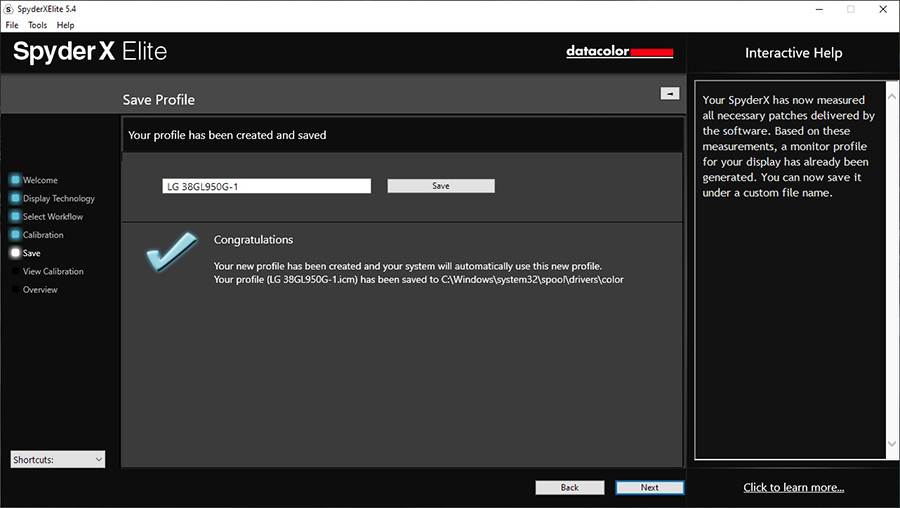
We saved the calibrated profile at the end as guided.
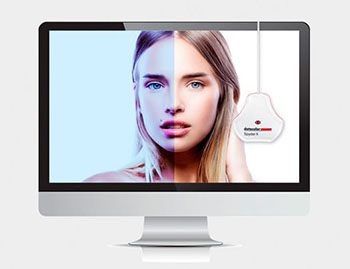
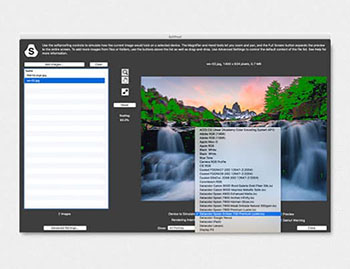
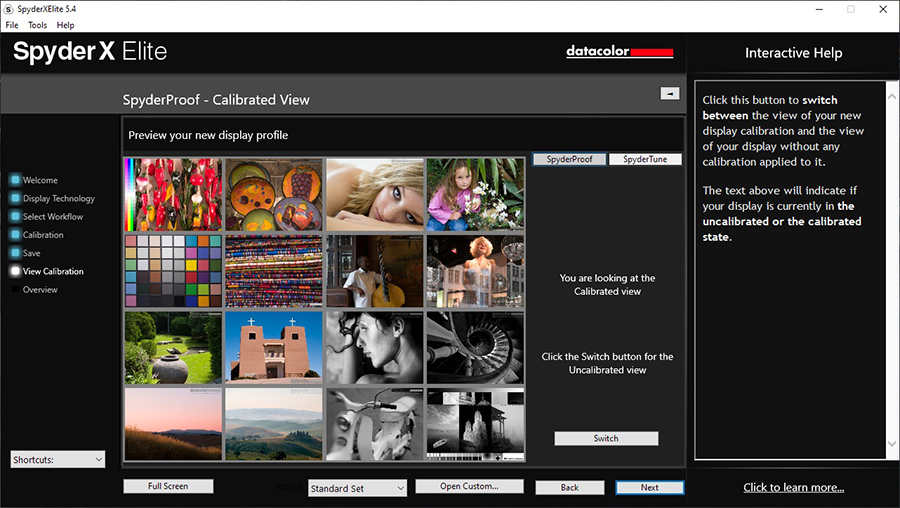
You are then taken to the 'SpyderProof' validation section where there are range of images you can examine, with a simple before and after button to see what impact the calibration has had on your setup.
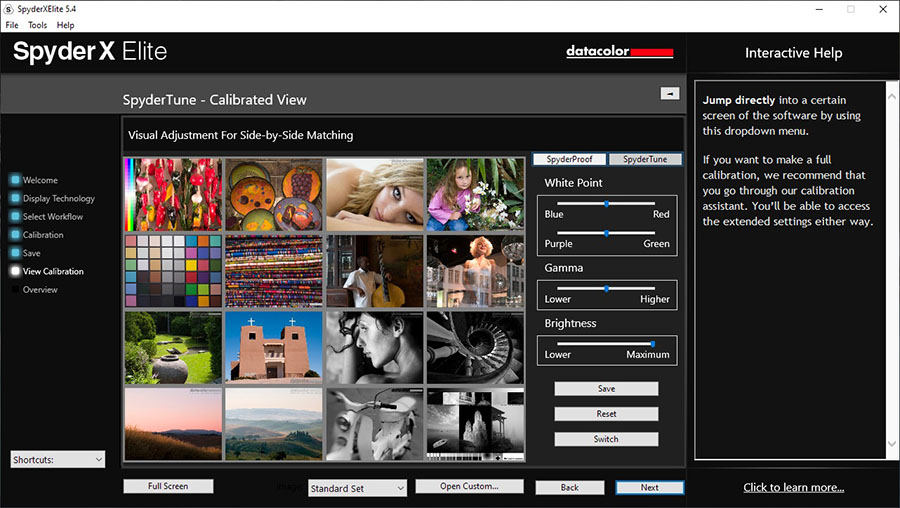
The 'SpyderTune' section also allows you to make some finite adjustments to things like colour temperature and brightness if you want, while examining these images. These kind of post-calibration validation images are fairly common from software packages like these, and might be useful for some visual inspection, but they do lack any "hard data" and measurements. Thankfully that is available elsewhere in the software as we will show you in a moment.
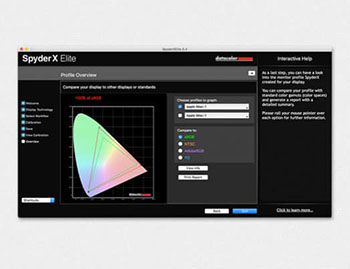
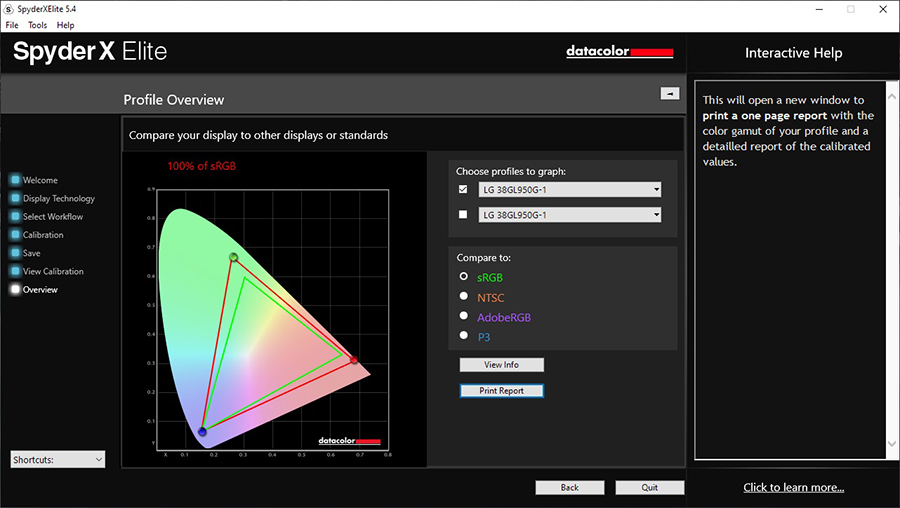
The final step within the calibration process is the 'profile overview' page where the colour gamut of your monitor is plotted within the CIE diagram on the left, and the coverage of difference colour spaces is shown. Here you can see that the colour gamut of the LG 38GL950G we were testing at the time has 100% sRGB coverage, and extends a long way beyond that as to be expected since this is a native wide gamut screen. You can select the other colour spaces from the list to show your results and the relative coverage of your display against those. We will look at the other colour gamut measurements and check their accuracy in the following sections.
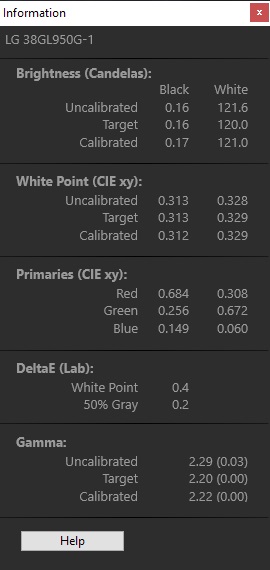
If you press the 'view info' button you can also see some of the measurements for the colour primaries as well as the resulting luminance, black point, dE colour accuracy and gamma. You can see that the 2.2 target gamma and luminance targets had been met nicely through this calibration. Unfortunately this section didn't confirm the white point as a familiar colour temperature (e.g. 6500k) which would have been handy, or confirm the contrast ratio specifically. Although that can be calculated by dividing luminance by black point - in this case resulting in 712:1 which is a little lower than we would expect for this screen. We will test the accuracy of this measurement against our normal i1 Display Pro Plus device in a moment.
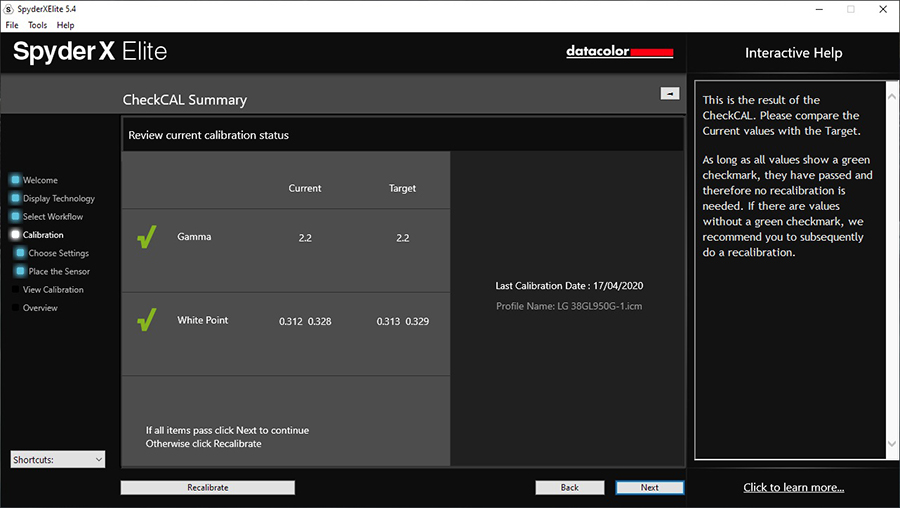
We will also take a look at the various validation and reporting functions of the software. This is something often missed from provided software in the past we have found, so it was great to see various tests and reports included here. The first is available via the 'CheckCAL' function shown above.
This does a quick test of the screen which takes about 17 seconds total and then presents results as shown above. Again it would have been useful to show the white point in a normal colour temperature format like 6500k, especially since that's what you have selected as your target earlier on for calibration. Gamma is confirmed here though too. These two results are the only thing included in the CheckCAL function though. The really good stuff is available in the 'Display Analysis' section of the software that you access via the 'shortcuts' menu in the bottom left. This doesn't seem to be linked to from any other part of the software or process oddly.
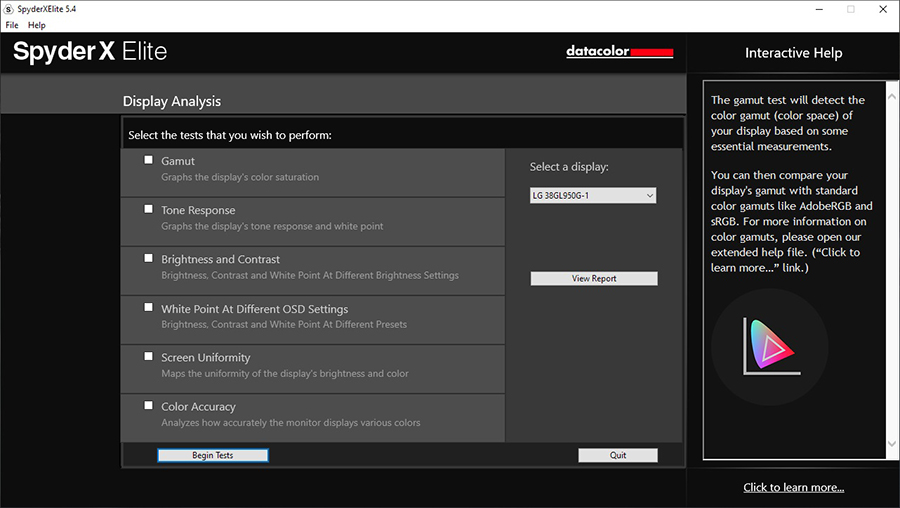
Within the 'Display Analysis' section you can select from a range of tests you want to run and report on as shown above. You can run each individually, or run through all (or some) of them in turn before the report is created and viewed.
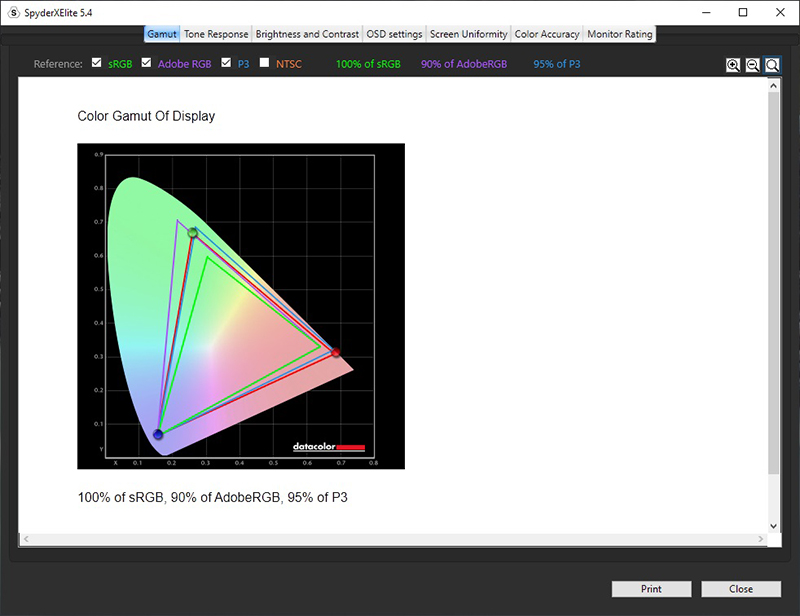
The 'Gamut' test measures the colour space of your monitor, and can be repeated in different preset modes if you want. Including if you have a wide gamut screen but also an sRGB emulation preset mode. It takes some quick measurements which takes only about 6 seconds before presenting you with the option to save the report. Then you can use the 'view report' button to look at these results. The gamut results confirm the colour space covered by the backlight relative to common colour spaces of sRGB, Adobe RGB, NTSC and DCI-P3. The coverage % is shown and you can choose which are plotted on the CIE diagram too.
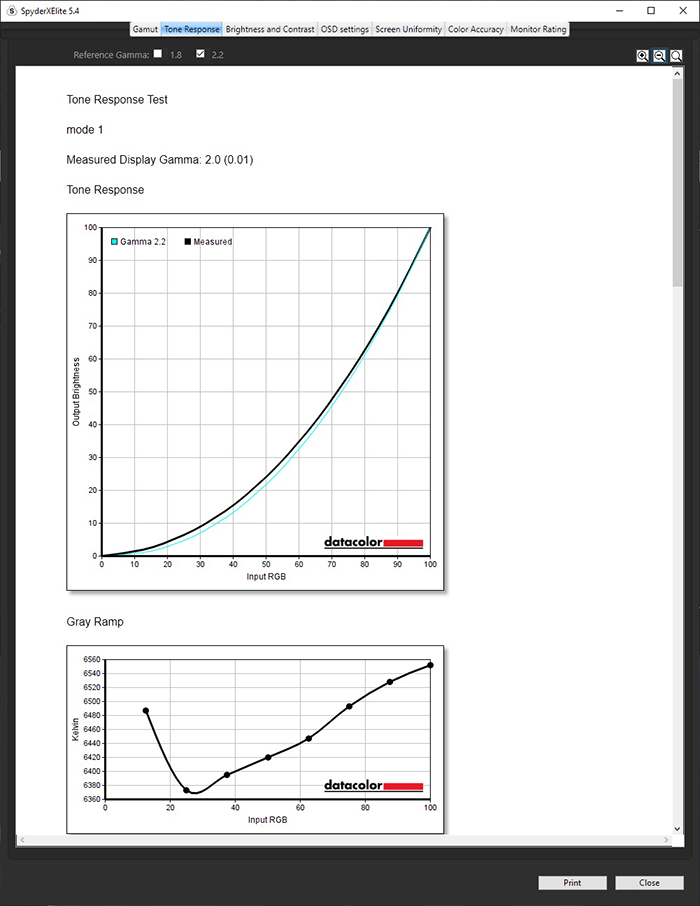
The gamma sections allows you to measure the gamma curve of your screen including any specific gamma modes the OSD menu might have. Measurement takes about 10 seconds per mode and you are asked to name each one so you can easily match the result to each option in the menu. For instance here on the LG 38GL950G we were testing on there are three modes in the OSD menu labelled mode 1, mode 2 and mode 3. We measured each and the results are then captured within the report. A gamma 'tone response' curve is shown along with a 'gray ramp' for each mode, and you can scroll down to see the other measured modes. Above are the results shown for the first mode 1.
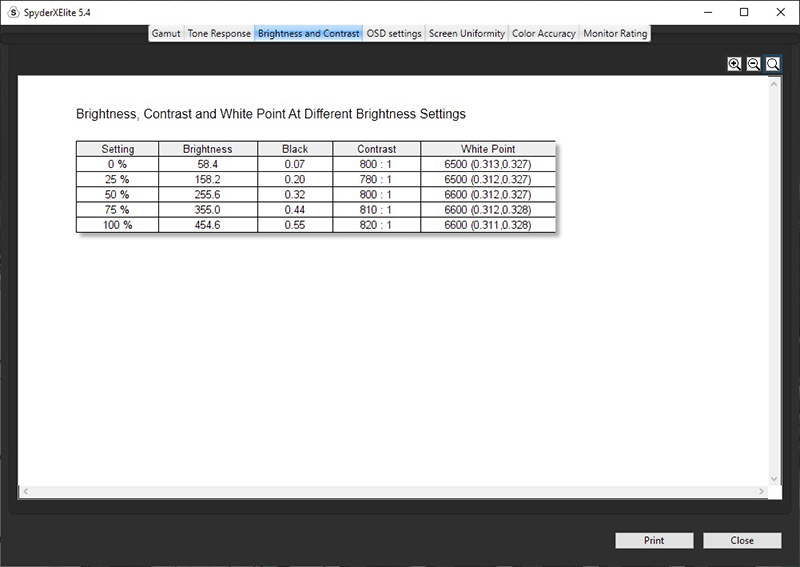
The 'Brightness and contrast' test asks you to set your screen at a range of brightness levels (0, 25, 50, 75 and 100%) and then takes very quick measurements at each. A 3 x 3 white and black ANSI grid is shown and measured. The report then confirms the measured brightness, black depth, contrast ratio (now calculated for you unlike in the calibration process 'info' section), and the white point (now showing as a temperature 6500k unlike before). This is a useful section to quickly and easily measure the brightness range and contrast stability of the screen as well as ensuring that the white point doesn't fluctuate as the brightness changes.
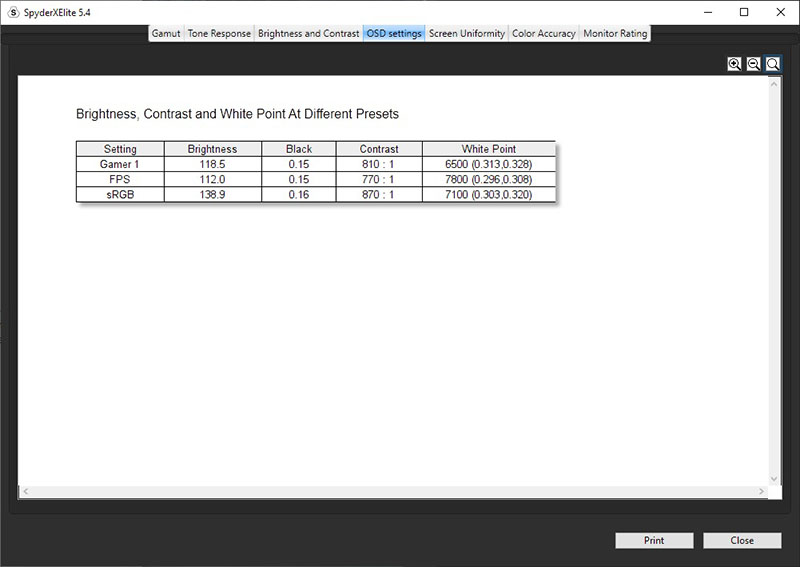
The 'White point at different OSD settings' test allows you to measure different preset modes of the display. You can add and name as many preset modes as you want here, we just included 3 of the options from the LG 38GL950G for now. The device then takes very quick measurements for about 3 seconds on each mode, while telling you when to switch to each within the OSD menu. The results show again the brightness (relative to whatever you've set the brightness control to), black depth, contrast ratio and white point. This is a handy section to quickly and easily measure the setup in each mode. It would have perhaps been nice to see a gamma and colour gamut measurement included in these tests to give you a fuller picture of each preset mode all in one place. Maybe Datacolor can add that in a future software update.
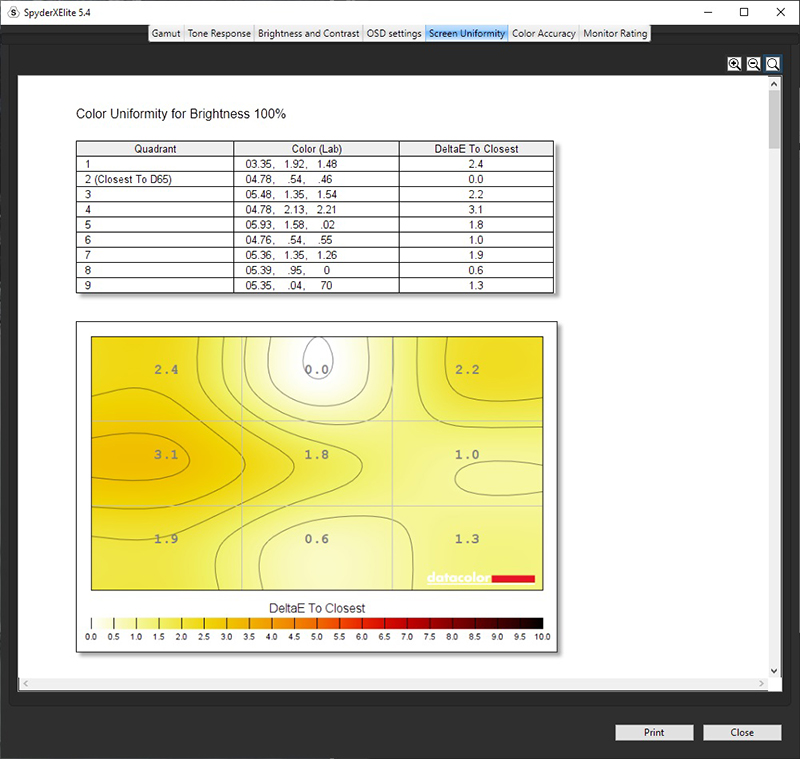
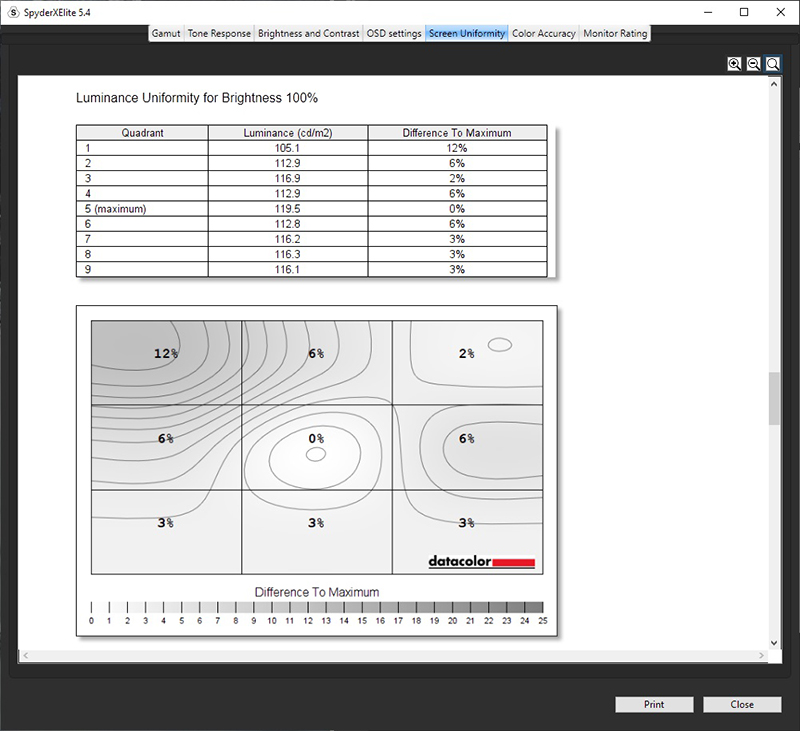
The 'Screen uniformity' section allows you to measure your display in a 3 X 3 grid (9 regions) and is fairly easy and quick to complete. Each section takes around 8 seconds to measure, and you have to move your device to each section as guided. At the end you are presented with some on screen results showing the luminance variance relative to the central segment, and at different levels of grey from dark > light > white. These are labelled as "screen brightness" with 100% bright being a white measurement. In the resulting report shown above you are presented with results showing the colour uniformity at each "brightness level" (i.e. each grey shade and white), and then as you scroll down also the luminance uniformity. This is pretty useful although doesn't allow for any more measurements or a more precise grid if you wanted so it's a little restrictive.
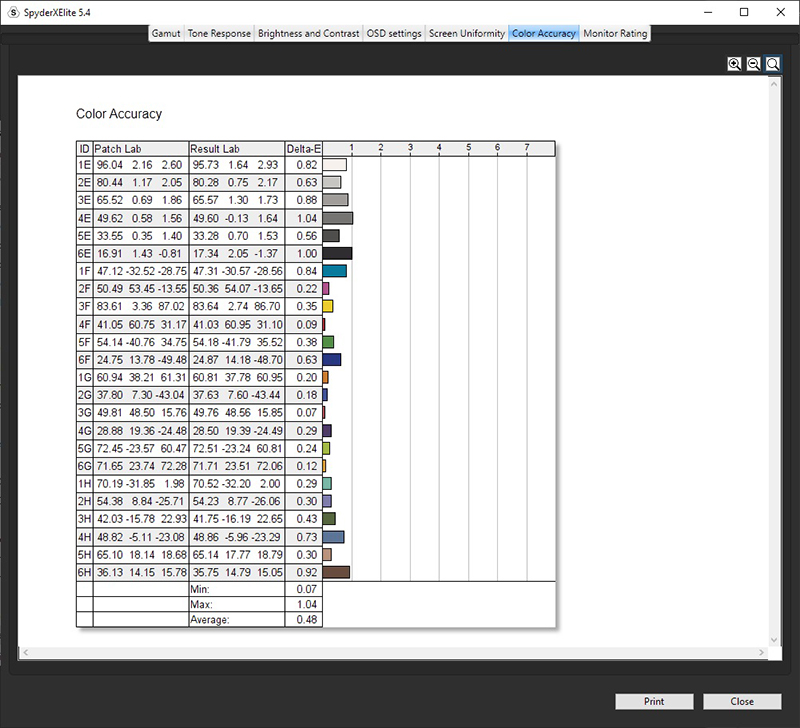
The final 'colour accuracy' test allows you to test the dE of your profile. You can choose how detailed you want this report to be, from a sample of 12, 24 or 48 shades. The results from 12 shades are shown above.
And from 24 measurements too for reference. Results are presented by each shade, along with a min/max and average figure.
We wanted to see how accurate the results were from the SpyderX device. This is somewhat tricky to do, as you have to settle on something as the "reference device". Here we will compare the measurements and results from the SpyderX against the well established and high end devices we use in our reviews from X-rite. Their i1 Pro 2 spectrophotometer, and their new i1 Display Pro Plus colorimeter. We use both devices in our reviews for a range of tests. The i1 Pro 2 is very reliable and versatile when it comes to measuring different backlight types, and we use that to measure colour gamut, white point, gamma curve and colour accuracy (dE). The i1 Pro 2 is not as versatile for lower black points and so we use an i1 Display Pro Plus to measure the luminance, black point and contrast ratio for increased accuracy.
These tests were conducted on the
LG 38GL950G, calibrated first of all with the SpyderX Elite and then using
the 'Display analysis' section to check various results and provide the reports
we wanted. We then took measurements with our X-rite devices to compare using
various other bits of software.
|
|||||||||||||||||||||||||||||||||||||||||||||||||||||||||||||||||||||||||||||||||||||||||||||||||||||||||||||||||||||||||||||||||||||||||||||||||


|
Check Pricing and Buy - Direct Links |
|
TFTCentral is a participant in the Amazon Services LLC Associates Programme, an affiliate advertising programme designed to provide a means for sites to earn advertising fees by advertising and linking to Amazon.com, Amazon.co.uk, Amazon.de, Amazon.ca and other Amazon stores worldwide. We also participate in a similar scheme for Overclockers.co.uk. |