Summary of Updates and Improvements to Our Testing and Results

We have made various updates and improvements to our testing methodology over the last couple of months which we think will help provide new and interesting data points, give you more useful quantitative data and provide an even better reflection of how a screen performs in real-life. We wanted to provide a summary and reminder of these changes here in one place in case you missed any of it.
Response Time Testing and Gaming Updates

As discussed in this detailed article, we are improving our response time testing to account better for what you see visually. We will be correcting a long overlooked limitation with traditional measurement methods and introducing “gamma corrected response times”. We would encourage you to read the full article for a lot more interesting discussion and testing.
These gamma corrected response times will provide a better and fairer reflection of panel response times relative to what you would see in real use. They will also do the same for overshoot analysis. This includes moving away from using a flawed percentage calculation for response time tolerance levels and also for overshoot, and making the measurements more relative to what you would see in real use.
We will continue to include for now a “legacy” measurement so you can quickly and easily compare future reviews with old ones, so there’s a consistent testing method.
We will also add in some new data points and stats to our results including:
‘Total response time G2G average’ – this will capture an even stricter measure of the total response time, removing some of the visual tolerances we allow for these things. It will look like a higher figure than the main measurement as a result. We are providing this to help give some comparative data that can be used when also considering reviews from sites like Hardware Unboxed, as they have adopted this more strict measurement for their reviews now. Our article considers this method and the reasons why we did not want to adopt it ourselves, but to help provide the best of both we will include this figure too.

New overshoot analysis – we will now also capture how many transitions measured had an overshoot of 15+ RGB values or more. 15+ is where overshoot becomes really distracting and obvious and so we can give a further screen rating based on how many transitions show this bad overshoot. We split this down by rise times (changes from dark to light shades where pale halos would appear for overshoot) and by fall times (changes from light to dark shades where dark halos would appear) to provide a view of how this could impact performance visually
The overall gaming and response time results in our reviews will now look like this example (taken from the Aver Nitro VG280K review). Now based on gamma corrected response times and overshoot:

Improved Measurements and Analysis for Display Setup and Colour Accuracy

We have incorporated the excellent Portrait Displays Calman Ultimate software in to our testing methodology, allowing us to capture some useful new data points and results when analyzing a display. This can be used when testing the out of the box default setup, optimal settings and post-calibration. We explored the software in depth and carefully selected only the graphs and data that we felt were useful to our readers, discarding anything which we felt was information overload or not really useful.
These updates include:

Greyscale dE – this graph tracks the accuracy of each greyscale shade measured from 0 (black) to 100 (white). The accuracy of each grey shade will be impacted by the colour temperature and gamma of the display. The lower the dE the better with differences of <1 being imperceptible (marked by the green line on the graph), and differences between 1 and 3 being small (below the yellow line). Anything over dE 3 needs correcting and causes more obvious differences in appearance relative to what should be shown. In the table beneath the graph we provide the average dE across all grey shades, as well as the white point dE (important when considering using the screen for lots of white background and office content), and the max greyscale dE as well.
RGB Balance and colour temperature – the RGB balance graph shows the relative balance between red, green and blue primaries at each grey shade, from 0 (black) to 100 (white). Ideally all 3 lines should be flat at the 100% level which would represent a balanced 6500k average colour temperature. This is the target colour temperature for desktop monitors and the temperature of daylight. Where the lines deviate from this 100% flat level the image may become too warm or cool. Beneath this RGB balance graph we provide the average correlated colour temperature for all grey shades measured, along with its deviance from the 6500k target. We also provide the white point colour temperature and its deviance from 6500k, as this is particularly important when viewing lots of white background and office content.
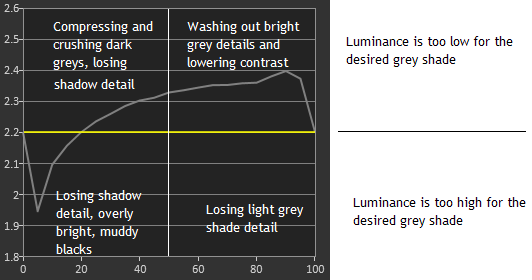
Gamma – we aim for 2.2 gamma which is the default for computer monitors. A graph is provided tracking the 2.2 gamma across different grey shades and ideally the grey line representing the monitor measurements should be horizontal and flat at the 2.2 level. Depending on where the gamma is too low or too high, it can have an impact on the image in certain ways. You can see our gamma explanation graph above to help understand that more. Beneath the gamma graph we include the average overall gamma achieved along with the average for dark shades (0 – 50) and for lighter shades (50 – 100).

dE colour accuracy – a new wider range of 47 colours are tested and the colour accuracy dE measured (previously 18). We compare these produced colours to the sRGB reference space, and if applicable when measuring a wide gamut screen we also provide the accuracy relative to a specific wide gamut reference such as DCI-P3. Previously our testing only allowed for comparison of the colours against sRGB which left a bit of a gap when reviewing wide gamut screens (where colours will always be more saturated than sRGB). We can now measure colour accuracy relative to different colour spaces as well as for far more colour samples. We have also updated the testing to use the more accurate dE 2000 standard instead of the older dE 1994.
Improved Colour Gamut Measurements

We have introduced a very high end measurement device to our testing, the UPRtek MK550T spectroradiometer that we discussed in this article. Amongst other things this will allow us to capture more accurate results for measuring a display’s colour gamut.
Taking the highly accurate measurements from this device, we are also using a new calculation tool to work out colour gamut coverage in a more accurate way, and now updating our results to provide these specs relative to the more accurate CIE-1976 standard, as opposed to the long standing market usage of CIE-1931. Read our colour gamut article for a lot more about these two standards if you want to know more.
In doing so we will now be able to provide accurate “absolute” coverage % of the sRGB, DCI-P3, Adobe RGB and Rec.2020 colour spaces – or any other colour space we might choose to measure against. We can also provide “relative” coverage to account for situations where the gamut extends beyond a defined space, useful for comparative purposes.
You will see in our reviews an updated testing results section like the below example:

This allows us also to plot better CIE-1976 chromaticity diagrams like the below, showing visually the coverage relative to reference colour spaces, in this example DCI-P3:

For high end HDR displays we can also use this UPRtek device combined with the Calman Ultimate software to measure colour volume if necessary.

Improved Colour Spectrum Analysis
The same UPRtek MK550T device can be used to also produce a more accurate measurement of a monitors colour spectrum. We can include more accurate graphs such as this:

It will also allow us to more accurate identify where things like the blue peak wavelength appears (helping to consider blue light filter modes and eye care features), as well as more accurately measure different monitor settings and blue light reduction modes.
Improved Black Depth and Contrast Measurements
We have improved the accuracy level of black depth measurements thanks to Calman Ultimate, now measured to 3 decimal places instead of 2. For panels with particularly deep black depth that is below the 0.02 cd/m2 limit of our X-rite i1 Display Pro Plus device, we will be able to use the new UPRtek MK550T device which can measure down to 0.001 cd/m2 if needed. Useful for HDR displays and VA panels especially.
Updated Uniformity Measurements

We’ve made a couple of minor updates to the data captured in these reports including now figures for max, min and average luminance (in nits) and an overall uniformity rating which should help with quick comparisons and provide a better representation of the overall performance in this area. The style has also been updated a bit too.
A summary of recommended settings in the Conclusion section

A nice suggestion from one of our Patreon supporters, we will include a small table in the conclusion capturing all our recommended settings from the review in one place. This will hopefully help buyers get the most out of their new screen.
New updated tables and style
Not a change to our testing as such, but we have smartened up the presentation of our tables and data in the reviews too, such as in the spec and features table (taken here from our Dell Alienware AW2721D review):

These style and layout changes have been made throughout the reviews for other sections (examples below):


Further Reading
- Explaining Monitor Colour Gamut. Improving Measurement Accuracy
- Display Measurement and Testing with the UPRtek MK550T Spectroradiometer
- Response Time Testing – Pitfalls, Improvements and Updating Our Methodology
- Review and Testing Improvements with Calman Ultimate Software
News alerts and more – follow us on Twitter
Subscribe to our News RSS feed