Input Lag Testing
With thanks for input to Thomas Thiemann
Introduction – What is Input Lag?
Input lag is described as the lag between the output from a graphics card and the image which is displayed on the screen you are using. For LCD screens this should not be confused with pixel response time which describes the speed at which a pixel can change from one orientation to another. Pixel response times impact aspects such as motion blur and ghosting in moving images. On the other hand input lag is a delay between what is sent to the monitor, and what you actually see. This can have impacts particularly in gaming where if the screen is lagging at all, it can have adverse affects on first person shooter games and the likes where every millisecond counts.
The level of lag really depends on the TFT display, and is controlled by many signal processing factors including, but not limited to the internal electronics and scaling chips. Some manufacturers even take measures to help reduce this, providing modes which bypass scaler chips and options which reduce the input lag. These are often reserved for gamer-orientated screens but the results can be quite noticeable in some cases.
We are making some improvements to the way in which we record input lag here due to reader feedback and improvements that have been made in recent years to testing methods. We’re always keen to improve our reviews and testing methodology and so I hope this comes as positive news to our readers. We have also spoken at length to Thomas Thiemann who has carried out extensive studies around input lag and has written studies including a well-known and regularly referenced article over at Prad.de. He is also the man behind the SMTT tool which some readers may be familiar with. We will discuss all of this throughout this article.
Input Lag Measurement Techniques
 vs.
vs. 
We firstly wanted to give an overview of some of the different techniques used to test input lag commonly by end users and review sites. These methods have changed somewhat in recent years so here is a summary of them all.
The Stopwatch Program

Above: an example stopwatch program, produced by Flatpanelshd.com
Traditionally input lag was widely measured by hooking up a CRT screen to the same graphics card and PC as the TFT display. By cloning the graphics card output, the user could provide a comparative test of the output of the CRT vs. the output of a TFT. It is assumed in this test that a CRT would show no lag on top of the output from the graphics card which is vital for those wanting to play fast games, where reaction times are key. This is what many users are used to, having come from older CRT displays. Many high end gamers still use CRT’s as well for high refresh rates and frame rates and so the move to a TFT can be worrying, especially when you start throwing in a conversation about lag of the output image.
By running the screens side by side in this way in clone mode, you can often see that the TFT lags behind the CRT. This is sometimes noticeable in practice even if you clone a game or move windows around your screen, but stopwatch programs have been used for many years to give a way to display and synchronise the output so that the difference could be recorded in some way and quantified to a figure in milliseconds. High shutter speed photographs can then be taken to show just how much the TFT lags compared with the CRT.

Above: another example stopwatch program, Xnote stopwatch
This stopwatch method has been used for many years by many review websites and end users. It’s easy to set up, doesn’t cost anything and allows a reasonable comparative view of a CRT output vs. a TFT output. It can also be useful for providing a comparison between different models over time.
The method is not 100% accurate however. There are areas of inaccuracy inherent to this method. Some stopwatch programs are based on flash which can introduce issues with frame rate and update rate support, especially when viewed from an internet source and browser. All basic stopwatch programs can introduce a degree of error if vsync is active and due to 2D native refresh rate settings of 60Hz. There’s never been a defined standard for measuring input lag and so this has been used for a long time and widely accepted as a decent enough representation of what a user may experience.
I will say that this method has been used for many years by many sources and although there is likely a varying degree of error introduced in this method, it can still allow you to give a reasonable comparison between displays. Classification of the lag into low, medium and high for instance is possible and the method can help give you an idea of the relative output of a TFT compared with a CRT. It’s an indication though as opposed to a precise measurement. More advanced and reliable methods are of course preferred where possible. We will talk about the limitations of these kind of programs a little later on in this article as well in the interview with Thomas Thiemann.
SMTT – An Improved Stopwatch Process
SMTT stands for ‘Small Monitor Test Tool’ and is a program which has been produced by Thomas Thiemann. SMTT has been around for some time, but Thomas has just completed a full refresh of the tool with many improvements in the new SMTT v2.0 which we will talk about in a moment.
Thomas has carried out a lot of research into input lag testing methodology and readers may well have read his excellent in depth article over at Prad.de in which various methods were tested and compared including stopwatch programs, SMTT 1 and more advanced oscilloscope + photosensor methods.

Above: a screen shot of the timer test from SMTT v1.0
The SMTT tool re-defines and improves the stopwatch method and helps to overcome some of the potential issues explained before. It runs without vsync active and is capable of very high refresh rates of more than 1000 fps. This program provides multiple stopwatches on the screen at once and so refresh rates can also be recognised and accounted for when used which helps reduce a large part of the error associated with a single stopwatch.
There were some drawbacks of this SMTT tool however including difficulty in reading some numbers, hard to read output in some cases which can lead to interpretation errors, and compatibility issues with DirectX and Windows platforms. All of these have been addressed in SMTT v2.0 which we will look at now.
SMTT v2.0 – Updates and Improvements
SMTT 2.0 has been redeveloped from scratch. With the acquired knowledge from his own input lag studies and the previous development of SMTT v1, including all its strengths and weaknesses, Thomas Thiemann replaced the old DirectX 9 based code with a modular and future-oriented DirectX 11 based approach that combines full DirectX 10.0 support with a solid basis for future updates.
Due to the implied optimizations SMTT 2.0 is not just offering marketing relevant, insubstantial, forward-looking features you can print on a paper box. In fact it highly improves the display performance and accuracy at the same time providing some real benefits to the user right now.
The primary key feature of SMTT 2.0 is still the input lag measurement that you can find in the software as “High Precision Counter” test. This test has not just been updated by the already mentioned transition to DirectX 11 but also by a new display technique called “I.R.O.N.”. I.R.O.N. stands for Improved Readability Of Numbers. This new display technique adds regular column switches to the output on screen to omit any overlapping of the displayed values which reduces the time needed in the evaluation process and increases the accuracy of the readings.
In addition to the input lag testing element of the tool, SMTT also provides other display tests which are useful.
- The “Deep Color Test” pattern has been redesigned to assists the human eye in the percipience of the very fine contrasts that are displayed on screen.
- The Deep Color Map, a 10 bit per colour capable multi-colour transition, shows flawless transitions in all possible directions while the earlier versions of SMTT suffered from a diagonal restriction in some cases. As the Deep Color Test the output will be automatically limited to 8 bit per colour as soon as your system is unable to display 10 bit color depth.
- Customizable colour ramps can be defined in the Gradients section of SMTT. Instead of offering just some presets it is up to the user to select start and end colours of a transition as well as the number of steps within this very special transition. So if your monitor has a display issue with certain colour shades you can focus the displayed colour ramp on the corresponding shades.
- Scaling tests that focus on typical HD resolutions are new to SMTT 2.0. The implied test patterns should help to determine if Full HD (1080p) or 720p signals are displayed with their 16:9 aspect ratio and without any cut offs even if zoomed in to fill the whole area of a monitor that offers a higher resolution than the signal that should be displayed.
Last but not least the whole user interface has been redesigned to offer the best ease of use possible. Intuitive user controls, non-blocking tool-tips and live previews supersede the manual most of the time. SMTT 2.0 is designed to support Windows Vista, Windows 7, Windows Server 2008 and Windows Server 2008 r2. Caused by the use of shaders that require DirectX 10.0, SMTT 2.0 does not support DirectX 9 only graphics cards or Window XP. SMTT v2 is a user-oriented modern test software with lots of technical improvements that alleviate the usage and enhance the accuracy.
We will look at the improvements made in v2.0 along with more detail about why it is superior to traditional stopwatch programs later on in this article as well in the interview with Thomas Thiemann.
Other Methods – Oscilloscopes
Some websites take this whole area one step further and even use an oscilloscope and photosensor to measure the input lag of a display. This is of course an even more precise measurement and can help you show the true image lag along with the typical response times of a pixel transition. This is then used to give you both the overall experienced ‘lag’ of the image and the lag specifically between the electronics and the pixel change instruction (the pure signal processing time). It is the total of the signal processing lag and the pixel response time which gives you a measurement of the perceived and experienced delay of a TFT compared with a CRT. We do not have access to such a method and the costs are extremely high for such devices. If you are particularly bothered about input lag then I would encourage you to compare results between sources and refer to other review sites as well where methods like this are used.

Above: Tektronix DSA71254 oscilloscope used in Thomas’ input lag studies
Keep in mind that even with high-end measurement equipment there is no standardised measurement method that exactly describes what has to be measured to be called ‘input lag’ or ‘display lag’. There is no rule that forces testers to imply or to separate the response time from the raw processing time. Don’t fool yourself by taking measurements that show the raw processing time without response time and believing that this would be the time you see a new picture in practice. Be careful when taking these measurements that the definition of the ‘input lag’ figure quoted is clear. Results using these methods may also differ depending on the measurement equipment used, especially the optical sensors.
In Summary – A New Input Lag Testing Method
The SMTT stopwatch method will give a more accurate indication of a screens input lag compared with older stopwatch methods. It offers many advantages to overcome the errors associated with older methods and v2.0 has made some great improvements compared with older versions. The results from our tests will measure the value of a delay between the image content displayed visibly on each screen and should give you a good indication of the perceived and experienced lag between a TFT and a CRT display.

Above: input lag testing methods compared by Thomas Thiemann
As part of Thomas Thiemann’s studies he has tested the input lag measurements across various different techniques and the results are shown above as an example from the NEC LCD2690WUXi monitor. This provides the results recorded using an oscilloscope method, SMTT v2, SMTT v1 and then traditional stopwatch methods both with V-sync disabled and enabled. As you can see, SMTT 2.0 provides a very good level of accuracy and has made some noticeable improvements over v1.0 as well. We don’t want to over-praise SMTT though as a well done oscilloscope measurement with high end equipment is superior to SMTT and any other photo-based test. However, SMTT 2.0 is very close to the results from an oscilloscope if you add the response time measurement to the signal processing time. It is much better than any plain stopwatch test or a “time code” (which is nothing else than a pre-recorded single stopwatch) as these comparisons show and for the reasons discussed in this article.
For our reviews we have also introduced a broader classification system for these results to help account for any remaining error in the method and classify each screen as one of the following levels:
- Class 1) Less than 16ms / 1 frame lag – should be fine for gamers, even at high levels
- Class 2) A lag of 16 – 32ms / One to two frames – moderate lag but should be fine for many gamers
- Class 3) A lag of more than 32ms / more than 2 frames – Some noticeable lag in daily usage, not suitable for high end gaming
Interview with the Author of SMTT
TFT central: What is SMTT designed to do?
T. Thiemann: SMTT is a multipurpose monitor test tool. The combination of implied test screens and interactive tests should help end users and editorial writers to rate the display quality of a monitor. Including input lag measurements, scaling, colour differentiation and colour resolution for 8 bit and 10 bit outputs.
The HPC (High Precision Counter) test to determine the input lag, also known as display lag, outperforms any other plain stopwatch application available and produces almost oscilloscope-grade results while keeping the costs at a reasonable level. Therefore it does not only help reviewers to rate a monitor, gamers can use it as well to rate their monitor. All that is needed is a CRT and a camera with adjustable fast shutter speed.
The Gradients help to rate the basic colour reproduction and differentiation in all colour shades. If your monitor is prone to clipping colours at the upper or lower end of a gradient or if banding within linear colour ramps is an issue you will find it with ease. You may also set the part of the ramp to be displayed by selecting the starting and end colour of the gradient on screen to magnify the area of interest.
The Deep Color Test is, as far as I know, still unique. I am one of the happy people that have access to NVIDIA Quadro graphics cards that are able to reproduce 10 bit per colour if you have a proper display connected. But there is no test pattern available. Neither in the driver nor in the software deployed with the monitor. Displaying a plain image is always risky as the software may be limited to 8 bit colour processing or the colour management of the software or operating system may cause strange colour shifts and other effects like colour clipping and banding which may reduce the number of colours that are finally displayed on screen. All of these mentioned problems are circumvented accessing the output directly. The deep colour test pattern is easy to evaluate. You won’t need more than five to ten seconds to find out if your display shows an 8 bit output or a 10 bit output.
And there are the new scaling test screens that offer some nifty little details that assist the reviewer for multimedia monitors and TV sets to rate the scaling performance. When I had to test the scaling performance myself I wished to have a clear display for the cut off pixels. Usual test screens offered e.g. white arrows without a clear mark at their tip. Displayed at the outer pixels of the screen it was often hard to say if the first pixel at the arrowhead was still displayed or already cut off. The new scaling test patterns do not suffer from this limitation.

TFT central: Why is SMTT 2.0 better than other stopwatch programs?
T. Thiemann: There are several reasons. At first all other approaches to measure input lag with one stopwatch or time code on screen assume that two displays that are connected to the same graphics card and setup to run in clone mode are totally synchronized. That means that they assume that the vertical sync signal which introduces every new frame is being sent at the same time to both monitors and that both monitors run at the very same frequency.
During my studies I tested this assumption as one of the first and realized that it is absolutely wrong. Connecting a TFT with the digital DVI-D and a CRT using analogue D-Sub cabling to a graphics card caused the monitors to have unsynchronized vertical sync pulses and slightly different frequencies depending on the used graphics card.
Using a high end oscilloscope, like the Tektronix DSA71254 that I used, offers the ability to trigger on the unique bit stream inside the digital TMDS (transition minimized differential signal) 8b/10b coded signal that represents the v-sync pulse. When you assume that both signals are totally synchronized both v-sync pulses should be transferred synchronized or with negligible delay. But that’s not the case. If you use the very same hardware and just unplug the CRT and reconnect it to the computer the vertical sync pulse is set to a new random point of time. This may fit to the v-sync within the digital signal or it may differ by any amount within a range of zero to 16.6 ms.
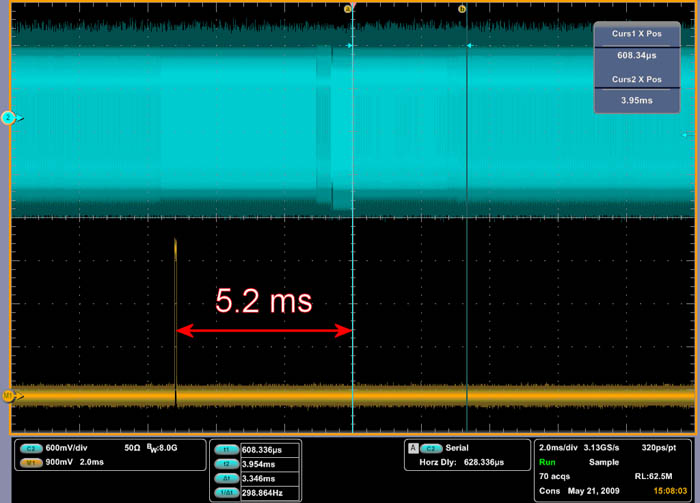
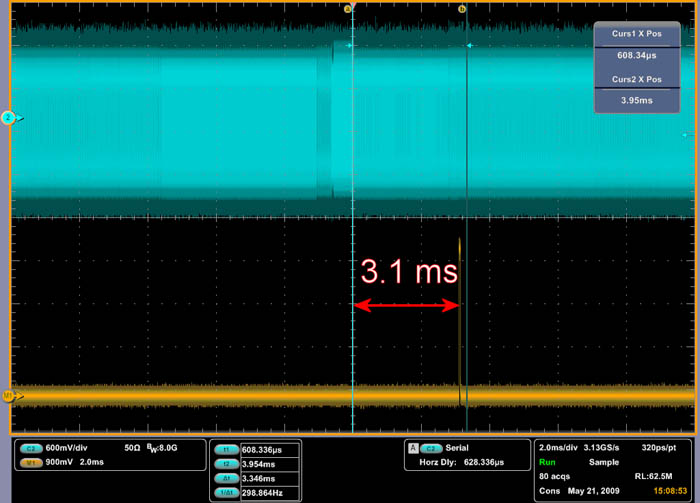
Figure Analogue v-sync 5.2 ms ahead of digital v-sync.2 (right): Analogue v-sync 3.1 ms delayed after reconnection. Click for larger versions.
As long as the frequencies are identical you can randomize the v-sync lag by reconnecting the monitor. Depending on the drivers it may be even enough to disable the secondary display and enable it again. If this is taken into account for display lag measurements you have the first reason why measurements with single stopwatches may differ by up to 16.6 ms. It just depends on the time the monitor is activated.
But the frequencies may be slightly off as well. You setup both monitors to run at 60 Hz as usual but the frequencies are just close to 60 Hz. In these cases the relative positions from analogue v-sync to digital v-sync differ slightly from frame to frame. Depending on the actual difference it may take several seconds or even minutes until the v-sync signals pass each other for the next time. In the example the difference is 0.02 Hz. With every frame the temporal difference between the v-sync pulses grows as the faster signal advances by 1/3001 of a single frame. It takes about 50s until the higher frequency signal is that far ahead that it reaches the next frame. Of course the signal is not travelling to the future – it has to display the same frame two times causing the advance to be reduced by 16.6 ms.
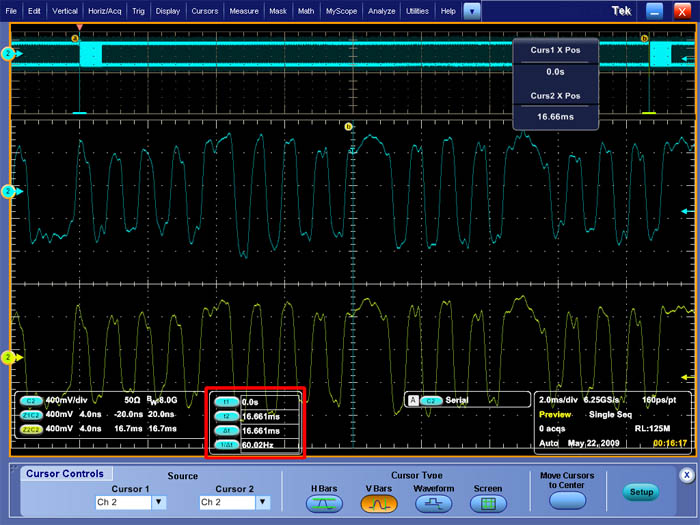
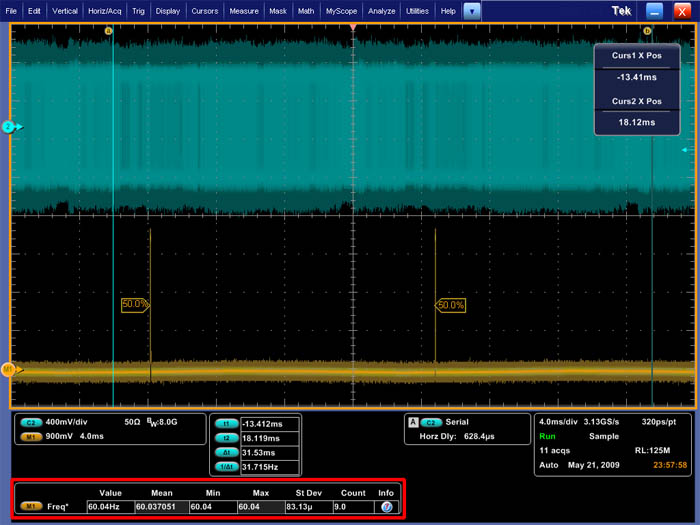
Figure 3 (left): Frame rate within the digital signal: 60.02 Hz. Figure 4 (right): Frame rate within the analogue signal: 60.04 Hz. Click for larger versions.
The point of this is that the delay shifts over time. If you take your photos at the beginning there will be almost no delay, if you wait 20s there will be a mediocre delay and if you take your photo at the end of such a period you will encounter the maximum delay. But this has nothing to do with the display lag. It’s caused by the graphics card but not by the internal signal processing of the monitor. The signals that were presented before are taken both from the input side of the monitors.
So the most important assumption for a plain single stopwatch based measurement has been disproved. It does not matter where you place the stopwatch on screen: On top, in the middle or at the end of the screen. It does not matter what time source you use: A stopwatch application, a time code from a video or whatever. When the first monitor starts updating its content the other monitor will most likely update some other part of the screen. As screen updates are done pixel by pixel, line by line from the upper left hand to the lower right one of the attached monitors may update the first few lines of the screen while the other is updating some lines at the lower half.
This fact opposes up to three different update areas on one screen to the same number of areas on the second screen. Depending on the position of the single stopwatch and the exact point of time the photo is taken you will measure one of the possible three measurement results. Almost totally random but affected by the speed of your camera and used graphics card.

Figure5: Opposing update areas with activated v-sync.
This example is taken with the old version of SMTT just for display purposes. Consider each line to represent the possible position of a single stopwatch on screen.
In the area marked with a green “A” you compare the updated area of the CRT with the updated area of the TFT. The values are identical as vertical sync forces one screen buffer to be kept as long as needed until the screens are completely updated. In this case it does not mean that the TFT has no input lag it just means that the input lag is not “several frames” long.
In the area marked with the red “B” you compare the old screen content of the CRT with the already updated new content of the TFT. In this case the TFT seems to be ahead of the CRT! I can assure you that the CRT has been tested for input lag and that it does not have any remarkable input lag that could cause this delay. It is just caused by the temporal difference of the screen refresh caused by asynchronous v-sync pulses.
Area “C” is almost like Area “A”, just that it opposes two old frames. The added thick yellow bars represent the actual position of the screen update. These positions change over time, they are of course not fixed. The figure is just an example for a specific point of time.
Now consider to place your plain stopwatch application at the top of the monitor: It will show no lag at the given point of time the example deals with. But what if your stopwatch is in the middle of the screen, in Area “B”? You will see 16 ms of “negative lag”. That is of course impossible. If this TFT would have 16 ms true input lag it would show 0 ms in the middle of the screen. This would make the tester to feel much more comfortable but would still be wrong.
In fact it does not matter where you place your stopwatch. The results will not represent the input lag of the monitor but signal delay + input lag + response time + x. That’s one of the reasons why SMTT displays many counters on screen (without v-sync): No matter at which position the monitor is updating its content it will always present the most up-to-date value that was available at that position of the update process. So the missing synchronization is a non-issue using SMTT.
Usual stopwatches are running as plain applications on the desktop or even in the browser using flash for their output. Flash has a very harsh limitation in terms of the speed the code is processed: It is run once per frame of the output. The problem is that the maximum frame rate of flash is limited. The highest frame rate that I could reproduce with flash was at 120 frames per second. Usual Flash based programs run at much lower frequencies, some browsers limit Flash to 60 Hz that is reasonable for usual flash based applications and 60 Hz as typical screen refresh rate. So the maximum theoretical precision of a flash based stopwatch is limited to 1/120 s. Displaying three digits after full seconds means 1/1000 s or single milliseconds. Offering an accuracy that is 8 times worse is somehow strange but no one seems to care.
Even if you do not use flash most stopwatches are bound to the 2D refresh rate of the Desktop. Well, to be more precise: All are bound to the 60 Hz of your monitor for their output but many of them may be bound to their precision to the same update rate. It does not matter how great your programming skills are: One value on screen will be updated only once during every screen update that takes place every 16.67 ms if you are running a monitor at 60 Hz. You are already lucky if this very special value is up to date. During my tests I realized that the Windows desktop seems to use some sort of v-sync that can’t be disabled. Remember that the V-Sync setting in the driver of your graphics card is meant for 3D only.
I was told to use a stopwatch once that used a font which looked like an old fashioned seven segment display. Even such little things like a bad font may causes problems. At that time I tested some monitors that had a relaxed response time so that two subsequent frames overlapped. I recognized that the values I wrote down accumulated the numbers 8 or 9 as last digit.

Figure 6: Accumulation of values using improper fonts.
The given example shows overlapping of the digit “4” with all other possible values. As you can see there is just one overlapping (underscore) that does not look like a valid digit. This is an optical effect. The CRT won’t show the overlapping but the TFT will. Using such digits on a single stopwatch with a fixed position will add some randomness in the lag by wrong readings.
And there are more traps to fall in. Did you know that the timer inside of every operating system which counts the passed milliseconds is not updated every millisecond? Using Microsofts Sysinternals ClockRes you can check the timer resolution of your system. Usually the resolution of this timer is somewhere between 10 ms and 16 ms.

Figure 7: System clock resolution displayed by Sysinternals ClockRes
So using the so called “system ticks” as time reference for a stopwatch is OK as long as you do not want to get a temporal resolution of milliseconds. SMTT uses high precision timers that offer much higher precision than needed and are updated often enough to resolve milliseconds.
So with a plain stopwatch you get a single counter somewhere on screen whose output is updated every 16 milliseconds during the screen refresh showing the content that has been stored in the screen buffer for up to 16 milliseconds and that may be calculated with a temporal precision of another 16 milliseconds, depending on the used code. Maybe based on system ticks with a resolution of about 16 ms. Lots of potential errors that can sum up to a total error you can’t get rid off by taking the average of your measurements. SMTT updates its high precision counters with every frame while running at several thousand frames per second. It is of course impossible to display more than 60 frames per second on a screen that runs at 60 Hz per second but each displayed picture on your monitor that is the results of the SMTT output is a patchwork that consists of approximately 32 pieces from different frames, assuming SMTT to run at 2000 fps. Such high frame rates are quite usual for SMTT 2.0.
SMTT does not need to take control of the picture processing time inside the graphics card. All that is needed is a regular and high-speed update of the output buffer that is accessed by both monitors. While the content of the buffer is transferred to the monitors it is still updated. What would cause so called tearing in a game is used to display many values line by line during one update process. All you have to do is disable v-sync for 3D output. High precision counters, optimized high speed code and several thousand updates per second try to guarantee true millisecond precision on screen.
On the other hand you have to consider that Microsoft Windows is no “real time operating system”. There is no guarantee that a given task will be performed during a fixed period of time. So SMTT may suffer from slight fluctuations if there are other tasks that interrupt the processing. But if you take a look at a picture that has been taken from the SMTT HPC test you will recognize that the values are updated every single millisecond almost every time. So all you have to do is to find and compare the most up-to-date values on both screens. These are most likely not at the same position on the screen, but that is intentional. You compare last-displayed values that represent the lag difference between the monitors instead of additional lags that are caused by asynchronous graphic outputs, inaccurate programming or vertical sync offsets.
TFT central: What’s been improved in v2 from v1?
T. Thiemann: Well, I had to start from scratch as the old DirectX 9 based code could not be updated to DirectX 10 or DirectX 11. The last versions of SMTT v1 featured a HPC test that was strictly DirectX 9.0 based which used sprites for text rendering while the old Deep Colour tests used DirectX 10 as colour depths of 10 bit per component are not supported by DirectX 9. That was hard to maintain and prone to cause errors on the long run. A simple switch to DirectX 10 was impossible because sprites are not supported in DirectX 10. I was stuck between two features that could not be run from the same code basis. Now the code is written for DirectX 11 but uses DirectX 10.0 features only. The sprites have been removed with my own bitmap font that improves the display performance.
SMTT 2.0 does no longer have any known memory leaks. So you may try to start the tests as often as you like without any crashes. The graphical user interface has been redesigned to offer the highest possible ease of use and needed precision for adjustments without being too complex or looking overcrowded. There is a setup process that checks for software requirements and tries to resolve them if needed. The High Precision Counters are optimized to run at even higher frame rates than they used to and the accuracy has been improved with I.R.O.N.. And there are the complete new scaling tests and the easier to use deep colour tests. Even a display issue with the deep colour map has been resolved.
Well, almost everything has been improved without sacrificing the key features. The software is still easy to handle, small, does not “call home”, it does not collect your data. It is still a small monitor test tool.
TFT central: Tell us more about I.R.O.N.?
T. Thiemann: I.R.O.N. stands for improved readability of numbers. This new display technique adds column switches every 16 ms to the output of the counters on the screen to omit any overlapping of the displayed values which reduces the time needed in the evaluation process and increases the accuracy of the readings. SMTT v1 displayed two columns displaying identical values on both sides of the screen. It was meant to be symmetrical so that the reviewer could place his CRT on the left or the right side of the TFT. You could zoom in to the area where the monitor frames touched one another and still had all counters visible. Well, that’s the theory. The problem was the latency of the TFT displays. Several values overlapped causing complicated readings that were prone to errors, reviewers to “guess” values or to waste a lot a time finding an up to date value.
I.R.O.N. avoids these overlapping values. Depending on the intensity of the text you can easily determine which values are new or old and it is easy to find the most actual value on screen – the value that is needed to determine the input lag of the monitor. Improved speed for each evaluation and higher accuracy by improved readability.
TFT central: What is coming up next?
T. Thiemann: There is a 32 bit version planned for Vista and Windows 7. The most time consuming work for a 32 bit version will be the setup process. SMTT code is licensed by an American start-up with great experience in game development that may incorporate SMTT core functionality and know-how to future game development platforms for reducing the overall lag you experience in computer games. SMTT is programmed on a modular basis and it is designed to be extended in the future. Therefore additional features are possible in upcoming versions of SMTT.
Conclusion
Hopefully this article has given you a good insight in to how input lag can be measured and the various pros and cons of each method which can be used. I’d like to thank Thomas Thiemann for his input and thoughts on the matter and would recommend you also read his other studies which have already been linked to in this review over at Prad.de. As the studies have shown, there are a lot of possible issues with traditional simple stopwatch methods which can result in a varying degree of error. This is more apparent if you then try to compare the results between different sources and different methods. SMTT v1.0 made some good improvements to the stopwatch method although had some initial limitations with its use, mainly around readability and some possible interpretation errors. SMTT v2.0 is a great improvement offering a host of updates to make measurement of input lag easier and more accurate, and also providing some new useful tools for testing your display. An oscilloscope can offer a higher level of accuracy if it is well defined and the equipment is of a high standard. Be wary of input lag figures though which crop up without explanation as to how they were obtained as there is no defined standard for what input lag is when using these kind of tools. Overall as long as the signal processing time and pixel response time are accounted for then an oscilloscope should provide a very high level of accuracy and a good measurement of the lag experienced by the end user of the display.
Through Thomas’ tests and in his production of SMTT 2.0 he has managed to create a very useful tool for measuring input lag without the need for very expensive equipment like this, and also providing a high level of accuracy even when compared with such a method. It is acknowledged that this tool provides the ideal photo method for measuring input lag and so we will be using this method in our tests to help improve accuracy from now on and in the absence at the moment of very expensive oscilloscope methods.
| Support US | If you have enjoyed this review and found it useful, please consider making a small donation to the site. |
Further Reading
SMTT – Thomas Thiemann, http://smtt.thomasthiemann.com
Input Lag Tests and Studies – Prad.de (Thomas Thiemann, translated version)
Input Lag Tests and Studies – Prad.de (Thomas Thiemann, original language version)